1 Introduction
1.1 Background
1.1 Background
- Anatec was commissioned by Ossian Offshore Wind Farm Limited (Ossian OWFL), hereafter referred to as ‘the Applicant’, to undertake a Navigational Risk Assessment (NRA) as part of the Ossian Array (hereafter referred to as ‘the Array’) application. This NRA presents information on the Array relative to the existing and estimated future navigational activity and forms the technical appendix to volume 2, chapter 13.
- It is noted that the Proposed offshore export cable(s) will be captured under a separate application, which will include a dedicated NRA for the Proposed offshore export cable(s). On this basis the Proposed offshore export cable(s) have not been assessed in this NRA (the Array NRA, hereafter the “NRA”).
1.2 Navigational Risk Assessment
2 Guidance and Legislation
2.1 Legislation and Policy
2.1 Legislation and Policy
- As part of the EIA Directive (2011/92/EU, as amended by Directive 2014/52/EU) as transposed into UK legislation through the EIA Regulations , an EIA Report is required to support the application for consent under Section 36 of the Electricity Act 1989 and associated marine licences, for the Array. Under Annex 1 to MGN 654, the MCA require that, as part of the EIA Report, an NRA is undertaken that “informs the shipping and navigation chapter of the EIA Report” (MCA, 2021). The NRA includes all aspects required by the MCA as evidenced by the completed MGN 654 Checklist provided in Appendix A, with any relevant detail then summarised in volume 2, chapter 13.
2.2 Primary Guidance
2.2 Primary Guidance
- The primary guidance documents used during the assessment are the following:
- MGN 654 (Merchant and Fishing) Safety of Navigation: Offshore Renewable Energy Installations (OREIs) – Guidance on UK Navigational Practice, Safety and Emergency Response and its annexes (MCA, 2021); and
- Revised Guidelines for FSA for Use in the IMO Rule-Making Process (International Maritime Organization (IMO), 2018).
- MGN 654 highlights issues that need to be taken into consideration when assessing the impact on navigational safety and emergency response (search and rescue, salvage and towing, and counter pollution) caused by offshore renewable energy installation developments (wind, wave and tidal). It applies to proposals in United Kingdom internal waters, Territorial Sea and Exclusive Economic Zone.
- MGN 654 includes several annexes including the Methodology for Assessing the Marine Navigational Safety and Emergency Response Risks of Offshore Renewable Energy Installations (OREI) which the MCA require to be used as a template for preparing NRAs. The methodology is centred on risk management and requires a submission that shows that sufficient controls are, or will be, in place for the assessed risk to be judged as broadly acceptable or tolerable with mitigation (see section 3.2). In both volume 2, chapter 13 and this NRA, the base and future case levels of risk have been identified as well as the mitigation measures required to ensure the future case remains broadly acceptable, or tolerable with mitigation.
2.3 Other Guidance
2.3 Other Guidance
- Other guidance documents used during the assessment include:
- MGN 372 Amendment 1 (M+F) Safety of Navigation: Guidance to Mariners Operating in the Vicinity of UK Offshore Renewable Energy Installations (OREIs) (MCA, 2022);
- International Association of Marine Aids to Navigation and Lighthouse Authorities (IALA) Recommendation RO138 (O-139) The Marking of Man-Made Offshore Structures (IALA, 2021a);
- IALA Guidance G1162 The Marking of Offshore Man-Made Structures (IALA, 2021b);
- The Royal Yachting Association’s (RYA) Position on Offshore Renewable Energy Developments: Paper 1 (of 4) – Wind Energy (RYA, 2019); and
- Regulatory Expectations on Moorings for Floating Wind and Marine Devices – (MCA and Health and Safety Executive (HSE), 2017).
2.4 Lessons Learnt
2.4 Lessons Learnt
- There is considerable benefit in the sharing of lessons learnt within the offshore industry. The NRA, and in particular the risk assessment undertaken in volume 2, chapter 13, includes general consideration for lessons learnt and expert opinion from previous offshore wind farm developments and other sea users, capitalising upon the UK’s position as a leading generator of offshore wind power.
3 Navigational Risk Assessment Methodology
3.1 Formal Safety Assessment Methodology
- A shipping and navigation user can only be exposed to a risk caused by a hazard if there is a pathway through which a risk can be transmitted between the source activity and the user. In cases where a user is exposed to a risk, the overall significance of risk to the user is determined. This process incorporates a degree of subjectivity given it relies on qualitative definition of frequency and occurrence. The assessments presented herein for shipping and navigation users have considered the following criteria:
- baseline data and assessment;
- expert opinion;
- stakeholder consultation comments including output of the Hazard Workshop for the Array;
- time and/or distance of any deviation;
- number of transits of specific vessels and/or vessel types; and
- lessons learnt from existing offshore developments.
- It is noted that, with regards to commercial fishing vessels, the methodology and assessment has been applied to hazards considering commercial fishing vessels in transit. A separate methodology and assessment for commercial fishing vessels have been applied in volume 2, chapter 12 to consider hazards on commercial fishing vessels including safety risks which are directly related to commercial fishing activity (rather than commercial fishing vessels in transit) and risks of a commercial nature.
3.2 Formal Safety Assessment Process
3.2 Formal Safety Assessment Process
- The IMO FSA process (IMO, 2018) as approved by the IMO in 2018 under Maritime Safety Committee – Marine Environment Protection Committee (MEPC).2/circ. 12/Rev.2 will be applied to the risk assessment within this NRA, and informs volume 2, chapter 13.
- The FSA process is a structured and systematic methodology based upon risk analysis and Cost Benefit Analysis (CBA) (if applicable) to reduce hazards to As Low As Reasonably Practicable (ALARP). There are five basic steps within this process as illustrated by Figure 3.1 and summarised in the following list:
- Step 1 – Identification of hazards (a list is produced of hazards prioritised by risk level specific to the problem under review).
- Step 2 – Risk assessment (investigation of the causes and initiating events and risks of the more important hazards identified in step 1).
- Step 3 – Risk control options (identification of measures to control and reduce the identified risks).
- Step 4 – CBA (identification and comparison of the benefits and costs associated with the risk control options identified in step 3).
- Step 5 – Recommendations for decision-making (defining of recommendations based upon the outputs of steps 1 to 4).
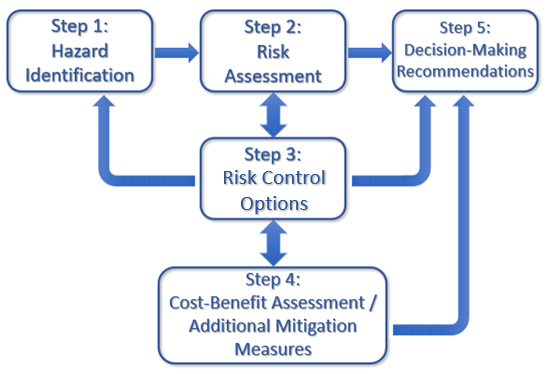
Figure 3.1: Flow Chart of the FSA Methodology
- It is noted that hazards of a commercial nature are considered outside the remit of the NRA but have been assessed using the FSA process in volume 2, chapter 13 where appropriate.
3.2.1 Hazard Workshop Methodology
3.2.1 Hazard Workshop Methodology
- A key tool used in the NRA process is the Hazard Workshop which ensures that all hazards are identified, and the corresponding risks qualified in discussion with relevant consultees (for further details including attendance at the Hazard Workshop see Section 4.3). Table 3.1 and Table 3.2 define the severity of consequence and the frequency of occurrence rankings that have been used to assess risks within the Hazard Log, completed based on the outputs of the Hazard Workshop for the Array (held 31 August 2023). The use of severity of consequence and the frequency of occurrence is as per the IMO FSA process (IMO, 2018).
Table 3.1: Severity of Consequence Ranking Definitions
Description | Definition | ||||
|---|---|---|---|---|---|
People | Property | Environment | Business | ||
1 | Negligible | No perceptible impact | No perceptible impact | No perceptible impact | No perceptible impact |
2 | Minor | Slight injury(s) | Minor damage to property i.e. superficial damage | Tier 1 local assistance required | Minor reputational risks – limited to users |
3 | Moderate | Multiple minor or single serious injury | Damage not critical to operations | Tier 2 limited external assistance required | Local reputational risks |
4 | Serious | Multiple serious injuries or single fatality | Damage resulting in critical impact on operations | Tier 2 regional assistance required | National reputational risks |
5 | Major | More than one fatality | Total loss of property | Tier 3 national assistance required | International reputational risks |
Table 3.2: Frequency of Occurrence Ranking Definitions
Rank | Description | Definition |
|---|---|---|
1 | Negligible | < 1 occurrence per 10,000 years |
2 | Extremely unlikely | 1 per 100 to 10,000 years |
3 | Remote | 1 per 10 to 100 years |
4 | Reasonably probable | 1 per 1 to 10 years |
5 | Frequent | Yearly |
- The severity of consequence and frequency of occurrence are then used to define the significance of risk via a tolerability matrix approach as shown in Table 3.3. The significance of risk is defined as Broadly Acceptable (low risk), Tolerable (intermediate risk) or Unacceptable (high risk).
Table 3.3: Tolerability Matrix and Risk Rankings
5 |
|
|
|
|
| |
4 |
|
|
|
|
| |
3 |
|
|
|
|
| |
2 |
|
|
|
|
| |
1 |
|
|
|
|
| |
|
| 1 | 2 | 3 | 4 | 5 |
|
| Frequency of Occurrence | ||||
| Unacceptable (high risk) |
| Tolerable (intermediate risk) |
| Broadly Acceptable (low risk) |
- Once identified, the significance of risk will be assessed to ensure it is ALARP. Further risk control measures may be required to further mitigate a hazard in accordance with the ALARP principles. Unacceptable risks are not considered to be ALARP.
3.3 Methodology for Assessing Cumulative Hazards
3.3 Methodology for Assessing Cumulative Hazards
- The hazards identified in the FSA for the Array are also assessed for cumulative risks with other projects and proposed developments within the cumulative risk assessment. Given the varying type, status and location of developments, different scenarios have been considered in the cumulative risk assessment, which allocates developments into the scenarios depending upon the following criterion:
- development status;
- distance from the Array;
- level of interaction with baseline traffic of relevance to the Array;
- stakeholder consultation comments; and
- data confidence.
- The scenarios and associated level of assessment undertaken for each, are summarised in Table 3.4.
- The maximum distance within which developments are considered for the cumulative risk assessment is 50 nautical miles (nm) from the Array perimeter as set out in the Array EIA Scoping Report (Ossian OWFL, 2023), noting the UK Chamber of Shipping (CoS) indicated this was an appropriate value during consultation (see section 4). This distance is standard within NRAs and provides a good overview of cumulative traffic patterns.
- An aggregate of the criterion can determine the relevant scenario(s) for each development. For example, if a development is located within 50 nm of the Array but does not impact a main commercial route passing within 1 nm of the Array and has low data confidence it may still be screened out of the cumulative risk assessment.
- Outputs of the cumulative tiering process are given in section 14.
Tier | Minimum Development Status | Criterion | Level of Cumulative Assessment |
|---|---|---|---|
Baseline | Under construction or Operational |
| Screened out of cumulative assessment as captured in the baseline. |
1 | Consented or under determination
|
| Quantitative assessment of vessel routeing
|
2 | Scoped |
| Qualitative assessment of vessel routeing |
3 | Pre-Scoping |
| Screened out |
3.4 Study Area
3.4 Study Area
- A buffer of 10 nm has been applied around the site boundary, as shown in Figure 3.2, as the study area for shipping and navigation (hereafter the ‘shipping and navigation study area’). This is a standard buffer for shipping and navigation and has been used in the majority of NRAs for UK offshore wind farms. It also aligns with the approach detailed in the Array EIA Scoping Report (Ossian OWFL, 2023), and has been presented to key shipping and navigation stakeholders including at the Hazard Workshop (see section 4.3).
- The shipping and navigation study area has been defined in order to provide local context to the analysis of risks by capturing the relevant routes, vessel traffic movements and historical incident data within and in proximity to the site boundary. Navigational features deemed of relevance located wholly or partially outside the shipping and navigation study area are considered where appropriate, e.g. Seagreen 1 Offshore Wind Farm.
- Cumulative development screening and the associated routeing assessment has been undertaken within a 50 nm buffer of the Array perimeter.
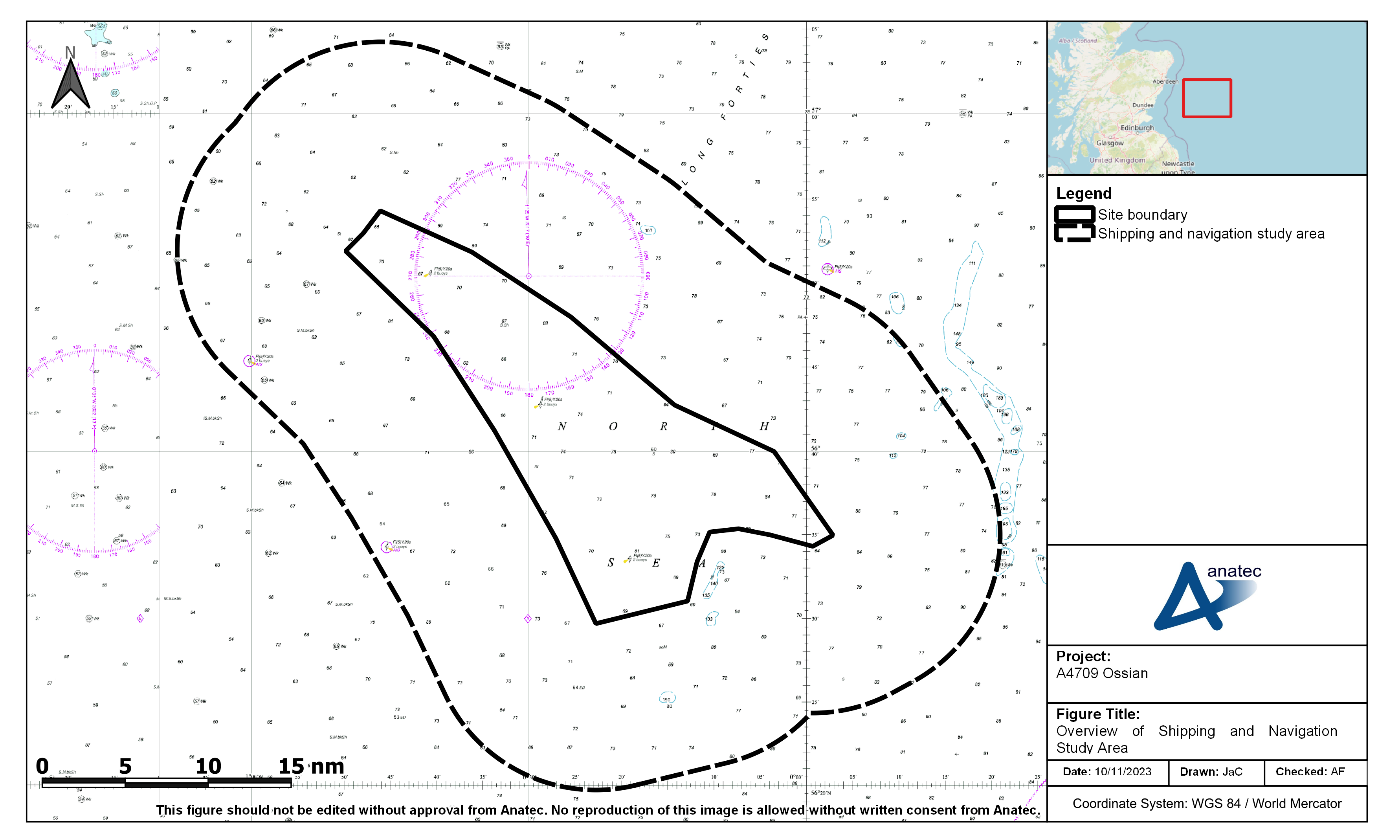
Figure 3.2: Overview of Shipping and Navigation Study Area
4 Consultation
4 Consultation
4.1 Key Stakeholders Consulted in the Navigational Risk Assessment Process
4.2 Consultation Responses
- Various responses have been received from stakeholders during consultation undertaken during the NRA process, either during conference calls, via email correspondence or through the Ossian Array Scoping Opinion (Marine Directorate – Licensing and Operations Team (MD-LOT), 2023). The key points and where they have been addressed in the NRA or volume 2, chapter 13 are summarised in Table 4.1. Points raised in the Hazard Workshop are presented separately in Section 4.3.3.
Table 4.1: Summary of Key Points Raised During Consultation
Stakeholder | Form of Correspondence | Point Raised | Response and Where Addressed in the NRA |
|---|---|---|---|
Ossian Array Scoping Opinion | |||
NLB | Scoping Opinion | “Northern Lighthouse Board note the inclusion of Section 7.2 – Shipping and Navigation, within the report, with particular reference to 7.2.7, where you confirm your intention to comply with MGN 654 covering shipping and navigational risk assessment and further in section 7.2.11, where you confirm that this will lead to the development of a Navigational Risk Assessment and that you will consult with the NLB further in relation to your intended development of a Lighting and Marking Plan (LMP) and Navigational Safety Plan (NSP).” | An NRA has been produced as required, including a completed MGN 654 checklist in Appendix A. NLB will be consulted on the Lighting and Marking Plan (LMP) and Navigational Safety Plan (NSP). |
NLB | Scoping Opinion | “NLB also note the inclusion of Cumulative Effects (Section 7.2.8) within this chapter, and the factors upon which other cumulative projects will be screened in or out of the assessment.” | The NRA includes cumulative assessment of routeing in section 14, with hazards assessed in volume 2, chapter 13. |
NLB | Scoping Opinion | “NLB have no objection to the content of the Scoping Report, and have no further suggestions for additional content.” | Methodology and assessment are as per the Array EIA Scoping Report (Ossian OWFL, 2023) (see section 3). |
RYA Scotland | Scoping Opinion | “Do you agree with the data sources, including project-specific surveys, to be used to characterise the shipping and navigation baseline within the NRA and Array EIA? The data to be used for recreational craft are adequate. The requirements for MGN 654 will have to be met but no additional data are needed even though only a proportion of recreational vessels transmit an AIS signal and recreational vessels can be difficult to spot on radar. It should be assumed that a small number of vessels will pass through the site each year. Clearly Shipping and Navigation should be scoped in to the EIA. RYA Scotland would like to contribute to the Navigational Risk Assessment.” | RYA Scotland has been consulted as part of the NRA process, with relevant input captured in the Hazard Workshop. The data used is as set out in the Array EIA Scoping Report (Ossian OWFL, 2023) (see section 5). |
RYA Scotland | Scoping Opinion | “Do you agree that all potential impacts (hazards and associated risks) have been identified for shipping and navigation? An additional risk is the failure of Aids to Navigation marking the devices. There have been several cases where lights or AIS transmissions have failed on wind farms off the coast of Scotland and it has taken several days to replace them due to adverse weather. Mitigation might include the use of virtual AtNs.” | The Array will comply with the relevant IALA requirements, including with regards to aid to navigation availability. The NLB have been consulted during the NRA process and lighting and marking will be agreed with NLB post-consent. An outline Aids to Navigation (AtoN) Management Plan is provided in volume 4, appendix 26, annex A. |
RYA Scotland | Scoping Opinion | “Do you agree with the proposed approach to assessment? Yes.” | Noted. Approach is as per the Array EIA Scoping Report (Ossian OWFL, 2023) (see section 3). |
RYA Scotland | Scoping Opinion | “Do you agree with the approach to screening other developments in or out of the cumulative assessment? Yes.” | Noted. Approach is as per the Array EIA Scoping Report (Ossian OWFL, 2023) (see section 3.3). |
RYA Scotland | Scoping Opinion |
“Do you have any additional comments relating to the use of floating technology specifically and potential associated additional mitigation options (e.g., operational safety zones) in relation to navigational safety impacts? From experience with existing floating wind farms we cannot see that the risks are significantly different from conventional schemes. A little depends on where the anchor chains are connected but we see no reason for operational safety zones and would be opposed to them being granted. I feel that creating safety zones by itself is not mitigation. It only becomes mitigation when the zone is actively enforced. Most recreational sailors will keep well clear off wind turbines, as they would when passing a ship at anchor.”
| The Applicant will determine which safety zones will be applied for post-consent in consultation with key stakeholders including RYA Scotland. The Array application will include procedures by which the safety zones will be monitored and enforced where necessary.
|
MCA | Scoping Opinion | “The Environmental Impact Report should supply detail on the possible impact on navigational issues for both commercial and recreational craft, specifically: • Collision Risk. • Navigational Safety. • Visual intrusion and noise. • Risk Management and Emergency response. • Marking and lighting of site and information to mariners. • Effect on small craft navigational and communication equipment. • The risk to drifting recreational craft in adverse weather or tidal conditions. • The likely squeeze of small craft into the routes of larger commercial vessels.” | The listed hazards have all been assessed in section 16 and volume 2, chapter 13. Mitigations are discussed in section 18.1. |
MCA | Scoping Opinion | “The development area carries a moderate amount of traffic with several important commercial shipping routes to/from UK ports and the North Sea. Attention needs to be paid to routing, particularly in heavy weather so that vessels can continue to make safe passage without large-scale deviations. The likely cumulative and in combination effects on shipping routes should be considered for this project. It should consider the proximity to other wind farm developments, other infrastructure, and the impact on safe navigable sea room.” | Routes pre wind farm have been assessed in section 11, routes post wind farm have been assessed in section 13.4.2, routeing in adverse weather has been assessed in section 11.3 and routeing on a cumulative basis has been assessed in section 14. |
MCA | Scoping Opinion | “A Navigational Risk Assessment will need to be submitted in accordance with MGN 654.This NRA should be accompanied by a detailed MGN 654 Checklist which can be found at https://www.gov.uk/guidance/offshore-renewable-energy-installations-impact-on-shipping” | An NRA has been produced as required, including a completed MGN 654 checklist presented in Appendix A. |
MCA | Scoping Opinion | “A vessel traffic survey will be undertaken to the standard of MGN 654 – at least 28 days which is to include seasonal data (two x 14-day surveys) collected from a vessel-based survey using AIS, radar and visual observations to capture all vessels navigating in the study area. We understand from the information presented in table 7.5 and paragraph 523 that in addition to the preliminary assessment of 28 days (13 – 26 January 2022 and 08 – 21 July 2022) of Automatic Identification System (AIS) data, a dedicated survey vessel located on-site in December 2022 carried out a traffic survey to the standard required in MGN 654. This data will be updated further once the project-specific summer vessel traffic survey has been completed in 2023.” | The NRA has assessed vessel traffic survey data that is fully compliant with MGN 654 in section 10, in addition to 12 months of AIS in Appendix E. |
MCA | Scoping Opinion |
“The Development Specification and Layout Plan referred to in Chapter 7.2.5, paragraph 533 and table 2.1 in Annex 2 will require MCA approval prior to construction to minimise the risks to surface vessels, including rescue boats, and Search and Rescue aircraft operating within the site. Any additional navigation safety and/or Search and Rescue requirements, as per MGN 654 Annex 5, will be agreed at the approval stage.”
| The Applicant will ensure full MGN 654 compliance, including in relation to layout and the Search and Rescue (SAR) checklist (see section 18.1). |
MCA | Scoping Opinion | “We note in Chapter 4.3.7, para 198 that Cumulative Effects Assessment will be carried out. As highlighted in paragraph 200, the proximity to other offshore wind farms in particular the proposed Morven and Bell Rock offshore wind farms will need to be fully considered, with an appropriate assessment of the distances between OREI boundaries and shipping routes as per MGN 654.” | Cumulative routeing has been assessed in section 14, with the assessment including account of Morven and Bellrock Offshore Wind Farms. The assessment has considered consultation undertaken with the MCA on distances to other projects as discussed within the relevant rows of this table. |
MCA | Scoping Opinion |
“It is noted that this scoping report concentrates on the array area only. However, attention should still be paid to cabling routes and where appropriate burial depth for which a Burial Protection Index study should be completed and subject to the traffic volumes, an anchor penetration study may be necessary. If cable protection measures are required e.g., rock bags or concrete mattresses, the MCA would be willing to accept a 5% reduction in surrounding depths referenced to Chart Datum. This will be particularly relevant where depths are decreasing towards shore and potential impacts on navigable water increase, such as at the HDD location.”
| MGN 654 requirements will be fully complied with, including in relation to underkeel clearance. A Burial Protection Index study will be completed, and an anchoring penetration study if required, post-consent. See section 18.1. |
MCA | Scoping Opinion | “In Chapter 7.2.5, paragraph 533 compliance with regulatory expectations on moorings for floating wind and marine devices (HSE and MCA, 2017) is identified as a designed in mitigation measure for floating infrastructure. This guidance should be followed, and a Third-Party Verification of mooring arrangements will be required.” | The requirements of the Regulatory Expectations will be followed, and Third-Party Verification (TPV) of all mooring and anchoring arrangements will be completed (see section 2). |
MCA | Scoping Opinion | “Particular consideration will need to be given to the implications of the site size and location on SAR resources and Emergency Response Co-operation Plans (ERCoP). The report must recognise the level of radar surveillance, AIS and shore-based VHF radio coverage and give due consideration for appropriate mitigation such as radar, AIS receivers and in-field, Marine Band VHF radio communications aerial(s) (VHF voice with Digital Selective Calling (DSC)). A SAR checklist will also need to be completed in consultation with MCA, as per MGN 654 Annex 5 SAR requirements.” | The Array will comply with MGN 654 requirements including in relation to the completion of a SAR checklist (see section 18.1). |
MCA | Scoping Opinion | “MGN 654 Annex 4 requires that hydrographic surveys should fulfil the requirements of the International Hydrographic Organisation (IHO) Order 1a standard, with the final data supplied as a digital full density data set, and survey report to the MCA Hydrography Manager. Failure to report the survey or conduct it to Order 1a might invalidate the Navigational Risk Assessment if it was deemed not fit for purpose.”
| Hydrographic surveys will be undertaken post-consent as per MGN 654. |
MCA | Scoping Opinion | “It is noted that the use of HVAC and HVDC transmission infrastructure is not discussed in this report. We would however like to remind the applicant when considering this that in the case of HVDC installation, consideration must be given to the effect of electromagnetic deviation on ships' compasses. The MCA would be willing to accept a three-degree deviation for 95% of the cable route. For the remaining 5% of the cable route no more than five degrees will be attained. If an HVDC cable is being used, we would expect the applicant to do a desk based compass deviation study based on the specifications of the cable lay proposed and assess the effect of EMF on ship’s compasses. MCA may request for a deviation survey post the cable being laid; this will confirm conformity with the consent condition. The developer should then provide this data to UKHO via a hydrographic note (H102), as they may want a precautionary notation on the appropriate Admiralty Charts (actions at a later stage depending upon the desk-based study and post installation deviation survey).” | This NRA does not consider the Proposed offshore export cable(s). Potential electromagnetic field (EMF) effects associated with other infrastructure are considered in section 12.6. |
MCA | Scoping Opinion | “Chapter 7.2.10, Scoping Questions to Consultees: 1- Do you agree with the data sources, including project-specific surveys, to be used to characterise the shipping and navigation baseline within the NRA and Array EIA? Yes. 2- Do you agree that all potential impacts (hazards and associated risks) have been identified for shipping and navigation? Yes 3- Do you agree with the proposed approach to assessment? Yes 4- Do you agree with the approach to screening other developments in or out of the cumulative assessment? Yes. 5- Do you have any additional comments relating to the use of floating technology specifically and potential associated additional mitigation options (e.g., operational safety zones) in relation to navigational safety impacts? None. On the understanding that the Shipping and Navigation aspects are undertaken in accordance with MGN 654 and its annexes, along with a completed MGN checklist, MCA is likely to be content with the approach.” | Noted. Approach is as per the Array EIA Scoping Report (Ossian OWFL, 2023) (see section 3). |
Cruising Association | Scoping Opinion |
“The area chosen for the Ossian OWF is not in an area which has a high concentration of recreational boats so the array will not have a big impact either during construction or when operational. However, there will be some traffic north and south along the coast and a small amount of traffic across the North Sea to Denmark, Norway and Sweden, all mostly in the summer months, perhaps as boats make for the Baltic Sea which is a popular cruising area. It should be borne in mind that sailing boats do not necessarily follow direct routes, depending on wind direction.”
| Recreational vessel traffic has been captured and assessed in section 10.3.5. |
Cruising Association | Scoping Opinion | “We have some concerns that when new arrays are being planned not enough consideration is given to the interaction with existing arrays of those being earmarked for the future. Each new array displaces larger commercial and fishing vessels which can result in increased concentration of traffic between arrays. This can present an increased hazard for small craft who do not wish to pass through the arrays. It would be good if these issues of interaction could be considered in more detail”. | Cumulative assessment has been undertaken in section 14. Hazards to small craft have been assessed in section 16. |
Cruising Association | Scoping Opinion | “We consider it important that vessels have the right of passage through arrays both during their construction and when they are operational (subject of course to the guidance given in the MCA MGN 372 Amendment 1 (M+F)) so we would not want to see any objections raised to this. In fact, given the point above regarding the concentration of traffic between arrays it can sometimes be safer for small craft to traverse an array I [sic] order to avoid shipping channels.” | Hazards to small craft have been assessed in section 16. |
Cruising Association | Scoping Opinion | “When considering the density of traffic passing through the area proposed for the array the analysis should not depend on AIS data for small craft. Many still do not carry AIS and many that do only receive and do not transmit their position. There are no numbers available to quantify this but my guess is that it would be prudent to assume that less than 20% transmit.”
| The vessel traffic survey data assessed in section 10 accounts for non-AIS traffic. |
UK CoS | Scoping Opinion | “The list of documentation looks broadly as expected to assess the shipping and navigation impact, however should also include Scotland’s National Marine Plan and its policies and Scotland’s Sectoral Marine Plan for Offshore Wind Energy and its policies.” | All relevant policy has been considered including Scotland’s National Marine Plan and Sectoral Marine Plan. |
UK CoS | Scoping Opinion | “Yes the 10nm study area is an accepted standard. The Chamber recommends a wider routeing study area of 50nm, which may be included as part of the wider cumulative impact assessment to consider routeing impacts of the proposed development in combination with other developments.” | A 50 nm study area has been used for cumulative assessment in section 14. |
UK CoS | Scoping Opinion | “The Chamber would recommend in addition to the MGN 654 compliant 2 x 14 day periods of vessel traffic data, additional AIS only data for a prolonged period to assist with analysis of seasonal variation and weather routeing which may be get picked up from only the short survey period.
This is widely available and commonplace for large proposed developments such as Ossian.” | Twelve months of AIS data has been assessed in Appendix E. |
UK CoS | Scoping Opinion | “The Chamber would expect to see inclusion of all the embedded mitigation measures as a minimum.” | The embedded mitigation measures will be implemented and are discussed in section 18.1. |
UK CoS | Scoping Opinion | “The receptors and impacts are broadly as one would expect for a fixed turbine development, however there are some additional receptors for floating which have are not yet considered.
What will be the construction phase of the build out? Will wet storage be required for turbines not at station? What is the navigational risk for these?” | Associated hazards are considered in section 16, based on worst-case parameters including in relation to construction, which includes consideration of wet storage. The location of the final integration and marshalling port is currently unknown. The Applicant is currently developing a fabrication, delivery and integration strategy and engaging with a number of port and harbour operators to identify an optimised approach. In the absence of an integration and marshalling yard it is not possible, at this stage, to consider the potential site-specific impacts on relevant receptors. Enabling works, including integration, and marshalling activities, required within the final integration port to cover turbine pre-commissioning, testing and storage (if required) will be covered by the consenting requirements applying to them (including any requirements for environmental assessment) and will be managed by the port or harbour authority with support where appropriate from the Applicant. The Array construction programme will be managed to reduce the requirement for storage of integrated pre-commissioned turbines within port. A stock of floating foundations will be accumulated, and mooring lines and cables would be installed within the Array in advance of turbine integration. The Applicant aims to minimise any wet storage requirements by towing integrated turbines to their final location within the Array as soon as they are ready, subject to suitable weather conditions for transfer.
|
UK CoS | Scoping Opinion | “Floating platforms are inherently mobile assets and the greater movement of them will increase the range of impacts that a project has. Platforms will be towed to/from the array area, construction base or wet storage sites and may encounter other traffic or activities whilst on route.” | Associated hazards are considered in section 16. |
UK CoS | Scoping Opinion | “What will be the O&M phase, will it carried out at the array area or is there a need to bring the turbines into more sheltered locations?” | Routine maintenance will be carried out with the wind turbine in-situ. Wind turbines would be removed from stations and towed to an operation and maintenance port facility for any major component replacements, or similar. Lighting and marking will consider this, with mitigations agreed with the NLB. |
UK CoS | Scoping Opinion | “In addition, vessel displacement leading to deviation, longer journey time and other environmental/economic impacts besides additional collision risk should be considered and does not present appear.” | See volume 2, chapter 18. |
UK CoS | Scoping Opinion | “The Chamber agrees that no potential impacts should be scoped out.” | Impacts have been assessed as per the Array EIA Scoping Report (Ossian OWFL, 2023); see section 16.
|
UK CoS | Scoping Opinion | “The Chamber does not agree that the following should be scoped out of the Construction and Decommissioning phase as there will still be an impact. Whilst the impact will be less than during the O&M phase it will nevertheless still be present particularly when the developments are half built/decommissioned: • Loss of station; • Interference with navigation, communications, and position-fixing equipment • Reduction of SAR capability.” | These hazards are considered for all phases in section 16. |
UK CoS | Scoping Opinion | “The Chamber agrees that cumulative and transboundary impacts need to be considered and is satisfied with a 50nm study area.” | Cumulative and transboundary impacts have been assessed using a 50 nm study area in section 14. |
UK CoS | Scoping Opinion | “Do you agree with the proposed assessment approach and list of planned consultees? Yes” | The assessment approach undertaken (see section 3) and the consultees (see section 4) are as per the Array EIA Scoping Report. |
Marine Directorate - Licensing Operations Team (MD-LOT) | Scoping Opinion | “The Scottish Ministers are content with the study area identified in Section 7.2.2 of the Scoping Report however note the representation from UKCoS which recommends a wider routeing study area of 50 nautical miles when considering the cumulative impact assessment with regards to routeing impacts in combination with other developments.” | A 50 nm study area has been used for cumulative assessment in section 14. |
MD-LOT | Scoping Opinion | “With regards to the shipping and navigation baseline, in line with the representation from the MCA, the Scottish Ministers are content that that the two separate 14 day periods of Automatic Identification System (“AIS”) data set out in the Scoping Report meets the standard MGN 654, however highlight the advice from UKCoS that additional AIS data over a prolonged period is obtained to assist with analysis of seasonal variation and weather routeing should be considered in the EIA Report. The Scottish Ministers advise that the Developer must engage further with the MCA and UKCoS to reach a suitable agreement on the provision of AIS data and document the rationale for the final approach within the EIA Report. Additionally, the Scottish Ministers highlight the representation from the CA regarding the limitations of AIS data for smaller craft which should be taken into consideration in the EIA Report.”
|
Data sources were agreed with the MCA, NLB and UK CoS in consultation.
The project has collected non-AIS data as required under MGN 654, with this data assessed in section 10. Twelve months of AIS data has been assessed in Appendix E.
Adverse weather routeing has been assessed in section 11.3.
Consultation with recreational representatives has also been undertaken to ensure the baseline data is validated.
|
MD-LOT | Scoping Opinion | “Table 7.7 of the Scoping Report summarises the potential impacts on shipping and navigation for each phase of the Proposed Development. The Scottish Ministers agree with the impacts scoped into the EIA Report, however the Developer is directed to the advice from the UKCoS that loss of station, interference with navigation, communications and positioning-fixing equipment and reduction of SAR capability should be scoped into the EIA Report during construction and decommissioning phases in addition to operation and maintenance. The UKCoS also identifies additional receptors in respect of floating offshore wind which the Scottish Ministers advise should be scoped into the EIA Report. Additionally, for the avoidance of doubt, the Developer must ensure that each of the possible impacts on navigational issues, including routing and effects on shipping, outlined in the MCA representation are addressed within the EIA Report. Finally, the Scottish Ministers highlight the RYA representation around failure of Aids to Navigation marking the devices which should be fully addressed in the EIA Report.” | These impacts are considered for all phases of the Array in section 16. An outline AtoN Management Plan is provided in volume 4, appendix 26, annex A. |
MD-LOT | Scoping Opinion | “With regards to approach to assessment, the Scottish Ministers confirm that, in line with NLB and MCA representations, the Developer will be required to submit a Navigational Risk Assessment in accordance with MGN 654, accompanied by a detailed MGN 654 checklist. Hydrographic surveys should fulfil the requirements set out in Annex 4 of MGN 654. In addition, the Scottish Ministers direct the Developer to the representation from the UKCoS and advise that the additional documentation highlighted should be considered when assessing the impact on shipping and navigation from the Proposed Development.” | An NRA has been produced as required, including a completed MGN 654 checklist in Appendix A.
Hydrographic surveys will be completed post-consent as required.
The referenced documents have been considered in volume 2, chapter 13. |
MD-LOT | Scoping Opinion | “The Scottish Ministers also highlight the MCA representation regarding SAR, Emergency Response Co-operation Plans, levels of radar surveillance, AIS and shore-based VHF radio coverage. The Scottish Ministers advise that the MCA representation must be fully addressed within the EIA Report and that a SAR checklist must be completed by the Developer in consultation with the MCA.” | A SAR checklist will be agreed with the MCA post-consent (see section 18.1). |
MD-LOT | Scoping Opinion | “Representation from the CA notes the preference of smaller craft to traverse wind farm arrays throughout all stages of its development due to the reduced risk from traversing busy shipping channels and that sailing boats don’t necessarily follow direct routes – this should be taken into consideration in the EIA Report.” | Hazards to small craft have been assessed in section 16. |
MD-LOT | Scoping Opinion | “With regards to cabling routes and cable burial, the Scottish Ministers advise that a Burial Protection Index should be completed and, subject to the traffic volumes, an anchor penetration study may be necessary. The Scottish Ministers advise that this should be fully addressed in the EIA Report and highlight the MCA advice on a maximum 5% reduction in surrounding depth referenced to Chart Datum if cable protection measures are required.” | MGN 654 requirements will be fully complied with including in relation to underkeel clearance. A Burial Protection Index study will be completed, and an anchoring penetration study if required, post-consent. See section 18.1. |
MD-LOT | Scoping Opinion | “With regards to the proposed mitigation in Section 7.2.5 of the Scoping Report, the Scottish Ministers highlight the representation from the RYA regarding its objection to operational safety zones, which should be taken into consideration when finalising the proposed designed in measures. In line with the representation from the MCA, the Developer should note that compliance with regulatory expectations for floating infrastructure, as stated in Section 7.2.5, is required and Third-Party Verification of the mooring arrangements will also be required.” | The project will determine safety zones to be applied for post-consent in consultation with key stakeholders including RYA Scotland. The Array application will include procedures by which the safety zones will be monitored and enforced. See section 18.1.
The requirements of the Regulatory Expectations will be followed, and a TPV of mooring arrangements will be undertaken. See section 2. |
MD-LOT | Scoping Opinion | “With regard to potential cumulative effects summarised in Section 7.2.8 of the Scoping Report, the Scottish Ministers are broadly content with the approach proposed and highlight the MCA requirement for an appropriate assessment of the distances between the neighbouring offshore renewable project boundaries and shipping routes in line with MGN Standard 654 which must be addressed in the EIA Report. In addition, the Scottish Ministers highlight the Cruising Association representation regarding increased concentration of traffic and advise that this must be fully considered in the EIA Report.” | Cumulative routeing has been assessed in section 14, with the assessment considering consultation undertaken with the MCA on distances to other projects as discussed within the relevant rows of this table.
Hazards to recreational vessels have been assessed in section 16. |
Relevant Consultation to Date | |||
Aurora Offshore | Email correspondence (Response received 15 May 2023) | “Navigation within wind farms is something we avoid today, unless there is a clear fairway indicated on the ENC charts allowing us to do so. There are a few farms off Holland and Belgium where this is allowed. However, the wind farms today are mostly bottom-fixed and fairly dense.
Ossian is a floating field, and with a 1,000 m spacing distance – we would have no objections sailing internally within the array – as long as the ENC charts and sailing directions in the area allows it. When looking at the planned footprint of Ossian and our historical navigation tracks in the same area, it is clear to us that sailing within the array is something we would have to do in order to avoid additional voyage lengths. That is extra cost and extra emissions on behalf of our clients.” | Post wind farm routeing has been assessed in section 13.4.2, with deviation assessed in section 16. |
Scotline | Email correspondence (Responses received 09 May 2023 and 10 May 2023) |
“This will affect our vessel trading patterns due to reduction of sea room and on the passage from Inverness – Rochester, Inverness – Humber, Inverness – Thames and the reverse routes.”
“It all depends on weather and traffic density”.
| Post wind farm routeing has been assessed in section 13.4.2, with deviation assessed in section 16. Adverse weather routeing is assessed in section 11.3.
|
Smyril Line | Email correspondence (Responses received 10 May 2023, 17 May 2023, 15 March 2014) | “I can see that the windmills themselves will [sic] have 1 nm apart. This will make your vessel able to navigate between the windmills in good weather conditions only. And for the north sea aera [sic] we often have very poor weather conditions. So, during winter times the vessel will have to sail around the wind farm. And then it also depends on the precise position of the wind mills themselves + the depth of underwater installations to say if the vessel will safely be able to pass between the windmills. Then as I understand the windmills will be floating units, this will have them shifting in position or? Thinking about currents, waves and wind. All these factors and most likely other factors too will have to be considered for us in a risk assessment during passage planning. Vessel safe navigation will always have highest priority. Just for general information, the Smyril Line Cargo Company currently is operating two RO-RO vessels that transit this aera [sic] 2 times every week all year round. Total of 4 transits for both vessels every week. Route net for both vessels is Faroe Islands-Island-Rotterdam. We have already sailed passed the wave and lidar buoys many times. In the Morven site and for the Pentland side just SE of Sule Skerry and Sule Stack where there are also wave and lidar buoys placed”
“I have looked at the coordinates in your system and I can say that the Ossian project will have no impact on vessel movements. The vessel will navigate as normal with no changes in route network. However, the Morven north and south, is right on your [sic] current routes. But when this project starts the vessel will sail in between the two wind farms and it will not be necessary to go inside the wind farms themselves. See acc . Where all our normal routes are in the chart as orange lines and the projects are the blue lines. Here you can see very clearly that for the Morven project, the vessel will only do a small change in the passage planning for the transit in between the wind farms. Little to no extra distance will be added to our routes as this project starts. These projects Bellrock – Ossian – Morven S N. Will have very minimal to no impact on the Smyril Line Cargo Company’s ships”
“For us to go between the Windmill parks or we have to adjust our route a bit to the west, is no big deal [sic].”
It “will not make any big different [sic].”
| Commercial route deviations are assessed in section 13.4.2. Adverse weather routeing is assessed in section 11.3. Cumulative routeing is assessed in section 14. |
Tidewater | Email correspondence (Responses received 4 May 2023 and 5 May 2023) | “Any vessels we would have in or around that area would generally be on transit and would navigate well clear of any works or they may be involved in any of those projects and would navigate according to the scope of work as required.”
“I would imagine that North/South between Ossian and Seagreen[1] would be the route taken for vessels in transit providing it was safe to do so whilst keeping well clear of any hazards to navigation.” | Commercial route deviations are assessed in section 13.4.2. Cumulative routeing is assessed in section 14. |
Wilson Ship Management | Email correspondence (Responses received 15 May 2023 and 16 May 2023) | “Understand that our commercial division have given a general feedback at an earlier stage. At that time as minimal impact for Wilson. To be a bit more detailed, obviously we would ask our navigators to plan voyages around the area, not sailing in between, while transiting. While entering ports in the area, we would prefer sailing between cumulative arrays. Of other comments, given the additional network of cables etc at the seabed, and high-end equipment on the surface, I trust that plans for development of the area also include emergency preparedness in terms of towing/assist-vessels in case of loss of propulsion, drifting etc. There might be further limitations of performing emergency anchoring if needed. In addition, evaluate how to collect the seabed-cables in order to maximize the area around for possible emergency anchoring”.
“It will not be our preferred transit route through the area to the reduce the risk. Obviously I cannot guarantee that we will not use it (weather permitting etc), but based on our normal routes in the area, sailing through the Morven-Ossian-Bellrock will be limited while transiting in normal trade.” | Commercial route deviations are assessed in section 13.4.2. The risk related to interactions between anchors and subsea cables is assessed in section 16. |
MCA and NLB | Meeting on 20 June 2022 | Approach to NRA and data collection agreed.
Noted that the cumulative picture was important. | The approach to data collection, shipping and navigation study areas and NRA approach is as agreed with the MCA and NLB.
Cumulative assessment has been undertaken in sections 14 and 17. |
MCA | Meeting on 25 July 2023 | General discussions were held on the cumulative scenario, in particular around distances to nearby developments. | Associated assessment and summary of consultation is provided in section 14. |
MCA | Meeting on 25 July 2023 | MCA confirmed limited concern with use of HVDC interconnector cables in the Array in terms of potential EMF effects. | Potential EMF effects are assessed in section 12.6, with the assessment considering MCA consultation input. |
MCA | Meeting on 25 July 2023 | Confirmed content with study areas and data collection. | The approach to data collection, shipping and navigation study areas and NRA approach is as agreed with the MCA. |
UK CoS | Meeting on 31 July 2023 | Confirmed content with study areas and data collection. | The approach to data collection, shipping and navigation study areas and NRA approach is as agreed with the UK CoS. |
UK CoS | Meeting on 31 July 2023 | General discussions were held on the cumulative scenario, in particular around distances to nearby developments. | Associated assessment and summary of consultation is provided in section 14. |
NLB | Meeting on 28 August 2023 | Indicated preference for consistency in width of any navigable areas between wind farms. General discussions were held on the cumulative scenario, in particular around distances to nearby developments. | Associated assessment is provided in section 14. |
NLB | Meeting on 28 August 2023 | Noted that a scenario where a turbine with a marine light was towed away from the Array for maintenance would need further discussion in the LMP process. | Lighting and marking, in agreement with NLB, has been included as embedded mitigation (see section 18.1). |
NLB | Meeting on 28 August 2023 | Confirmed content with study areas and data collection. | The approach to data collection, shipping and navigation study areas and NRA approach is as agreed with the NLB. |
NLB, MCA and UK CoS | Meeting on the 10 October 2023 | General discussions were held on the cumulative scenario, in particular around distances to nearby developments. MCA and NLB confirmed content with the distance between the Array and the Bellrock array. | Considered in cumulative routeing assessment in section 14.2. |
NLB | Meeting on the 20 March 2024 | General discussions were held on the cumulative scenario, in particular cumulative routeing options for vessels. Agreed outputs of this NLB consultation include:
| Associated assessment is provided in section 14 which considers the output of the NLB consultation. |
UK CoS | Meeting on 23 April 2024 | General discussions around cumulative routeing options in the area. The UK CoS highlighted importance of maintaining optionality for vessel routeing within the region. | Associated assessment is provided in section 14 including cumulative routeing options available to vessels. |
MCA | Meeting on 02 May 2024 |
| Associated assessment is provided in section 14 which considers the output of the NLB consultation.
The MCA comment on sea room is noted, and final build out within the Array will be agreed with the MCA and NLB as part of the Development Specification and Layout Plan (DSLP) process, noting this will consider the most up to date cumulative picture at the time. |
4.3 Hazard Workshop
4.3 Hazard Workshop
- A key element of the consultation undertaken was the Hazard Workshop, meetings of local and national marine stakeholders to identify and discuss potential shipping and navigation hazards. Using the information gathered, a Hazard Log was produced to be used as input into the risk assessment undertaken in volume 2, chapter 13. This ensured that expert opinion and local knowledge was incorporated into the hazard identification process and that the Hazard Log was site-specific.
4.3.1 Hazard Workshop Attendance
4.3.1 Hazard Workshop Attendance
- BP;
- Forth Ports;
- MCA;
- NLB;
- Port of Aberdeen;
- RYA Scotland / Cruising Association;
- SFF;
- SPFA;
- SWFPA;
- UK CoS; and
- Wilson Ship Management.
4.3.2 Hazard Workshop Process and Hazard Log
4.3.2 Hazard Workshop Process and Hazard Log
- During the Hazard Workshop, key maritime hazards associated with the construction, operation and maintenance and decommissioning of the Array were identified and discussed. Where appropriate, hazards were considered by vessel type to ensure risk control options could be identified on a type-specific basis.
- Following the Hazard Workshop, the risks associated with the identified hazards were ranked in the Hazard Log based upon the discussions held during the Workshop. Where appropriate, mitigation measures were identified, including any additional measures required to reduce the risks to ALARP. The Hazard Log was then provided to the Hazard Workshop attendees for comment.
- The Hazard Log has been used to inform the risk assessment undertaken in volume 2, chapter 13 and is presented in full in Appendix B.
4.3.3 Hazard Workshop Minutes
4.3.3 Hazard Workshop Minutes
- A summary of the hazard workshop discussions is provided in Table 4.2.
Table 4.2: Hazard Workshop Minutes
Stakeholder | Point Raised | Response and Where Addressed in the NRA |
|---|---|---|
Various (see paragraph 33) | Consideration of cumulative routeing would be important for the NRA. General consensus that on a cumulative basis, vessels choosing not to navigate in proximity to Ossian would likely pass further inshore.
The minutes state that “vessels using potential corridors in the area formed on a cumulative basis are likely to be relatively low” and “large open areas are more important than multiple small cumulative corridors”. | Cumulative routeing assessment is provided in section 14.2. |
RYA Scotland | Noted the importance of marine lights and addressing outages. | The Array complies with the relevant IALA requirements, including with regards to aid to navigation availability. The NLB have been consulted during the NRA process and lighting and marking will be agreed with NLB post-consent. An outline AtoN Management Plan is provided in volume 4, appendix 26, annex A. |
SWFPA | Noted the importance of marine coordination and Vessel Management Plans (VMPs). | An outline NSVMP is provided in volume 4, appendix 24. |
SWFPA | Future traffic should also be considered. | Approach taken in terms of future case traffic assumptions is detailed in section 13. |
SWFPA | Emphasised the importance of marking structures on Electronic Chart Display and Information Systems, including depths and sizes of subsea hazards | Appropriate marking of structures on UKHO Admiralty Charts and other electronic charts as appropriate as an embedded mitigation for the Array as detailed in volume 2, chapter 12. |
NLB | Noted that risk to transiting vessels was unlikely from catenary mooring lines given how close large vessels would need to be to turbines to risk interaction. | Underkeel interaction risk is assessed in section 16. |
SWFPA and SPFA | Fishing vessels up to 24 m would likely keep a clearance of around 250-300 m, larger fishing vessels such as 70-90 m pelagic vessels would likely keep a 500 m clearance, and would be unlikely to transit through the Array. | Considered in the risk assessment in section 16. |
SWFPA | Fishing vessel activity broadly well represented in the AIS datasets presented. | Data sources used are presented in section 5. |
RYA Scotland | Noted that non-AIS recreational vessels were unlikely so far offshore, and that regardless those on AIS were a good representative of overall activity. | Data sources used are presented in section 5. |
5 Data Sources
5 Data Sources
- This section summarises the main data sources used to characterise the shipping and navigation baseline relative to the Array.
5.1 Summary of Data Sources
5.1 Summary of Data Sources
- The main data sources used to characterise the shipping and navigation baseline relative to the Array are outlined in Table 5.1.
Table 5.1: Data Sources Used to Inform the Shipping and Navigation Baseline
Data | Source(s) | Purpose |
|---|---|---|
Vessel traffic | Winter vessel traffic survey data consisting of AIS, Radio Detection and Ranging (Radar) and visual observations for the shipping and navigation study area (14 days; 07 to 21 December 2022) recorded from a dedicated survey vessel on site. | Characterising vessel traffic movements within and in proximity to the Array in line with MGN 654 (MCA, 2021) requirements. |
Summer vessel traffic survey data consisting of AIS, Radar and visual observations for the shipping and navigation study area (14 days; 02 to 18 July 2023) recorded from a dedicated survey vessel on site. | ||
AIS data for the shipping and navigation study area (12 months, January to December 2022) recorded from coastal and satellite receivers. | Validation of the vessel traffic surveys and characterising seasonal variations. | |
Anatec’s ShipRoutes database (2023). |
Secondary source for characterising vessel traffic movements including cumulatively within and in proximity to the Array.
| |
Maritime incidents | Maritime Accident Investigation Branch (MAIB) marine accidents database (2002 to 2021). | Review of maritime incidents within and in proximity to the Array. |
Royal National Lifeboat Institution (RNLI) incident data (2013 to 2022). | ||
Department for Transport (DfT) UK civilian SAR helicopter taskings (April 2015 to March 2023). | ||
Recreational traffic density and features | UK Coastal Atlas of Recreational Boating 2.1 (RYA, 2019) | Characterising recreational activity within and in proximity to the Array. |
Other navigational features | Admiralty Charts 273 (United Kingdom Hydrographic Office (UKHO), 2023). | Characterising other navigational features in proximity to the Array. |
Admiralty Sailing Directions NP54 (UKHO, 2021). | ||
Weather | Wind direction data (data taken from metocean buoys deployed on site between August 2022 and August 2023). | Characterising weather conditions in proximity to the Array for use as input to the collision and allision risk modelling. |
Site-specific hindcast sea state dataset (data taken from metocean buoys deployed on site between August 2022 and August 2023). | ||
Visibility data provided in Admiralty Sailing Directions NP54 (UKHO, 2021). | ||
Site-specific hydrodynamic hindcast dataset. |
5.2 Vessel Traffic Surveys
5.2 Vessel Traffic Surveys
- The vessel traffic surveys were undertaken by the guard vessel Star of Hope and in agreement with the MCA and NLB in terms of methodology and approach. Two 14-day AIS, Radar, and visual observation surveys undertaken in winter 2022 (07 to 21 December 2022) and summer 2023 (02 to 18 July 2023) have been considered within the baseline for a total of 28 full days as required under MGN 654 (MCA, 2021). The dataset from each vessel traffic survey was supplemented with AIS collected from alternate AIS receivers to ensure optimal coverage.
- A number of vessel tracks recorded during the survey period were classified as temporary (non-routine) and were therefore excluded from the analysis to ensure the data was representative of routine activity. Besides the survey vessel itself, this included survey/research vessels and a vessel associated with the construction of the Seagreen 1 Offshore Wind Farm.
- The dataset is assessed in full in section 10.
5.3 Long-Term Vessel Traffic Data
5.3 Long-Term Vessel Traffic Data
- The long-term vessel traffic data consisting of AIS covering the entire 12 month period of 2022 was collected from coastal and satellite receivers. The assessment of this dataset allowed additional understanding of seasonal variation across the span of an entire year.
- The dataset is assessed in full in Appendix E.
5.4 Data Limitations
5.4 Data Limitations
5.4.1 Automatic Identification System Data
5.4.1 Automatic Identification System Data
- The carriage of AIS is required on board all vessels of greater than 300 Gross Tonnage (GT) engaged on international voyages, cargo vessels of more than 500 GT not engaged on international voyages, passenger vessels irrespective of size built on or after 01 July 2002, and fishing vessels over 15 metre (m) length overall (LOA).
- Therefore, for the vessel traffic surveys, larger vessels were recorded on AIS while smaller vessels without AIS installed (including fishing vessels under 15 m LOA and recreational craft) were recorded, where possible, on the Automatic Radar Plotting Aid (ARPA) Radar on board the Star of Hope. A proportion of smaller vessels also carry AIS voluntarily, typically utilising a Class B AIS device.
- The vessel traffic surveys demonstrated that non-AIS traffic in proximity to the Array is minimal; no non-AIS vessels were recorded during the winter survey and a single non-AIS vessel was recorded during the summer survey (accounting for less than 0.5% of the traffic).
- The long-term vessel traffic data – an AIS only dataset – assumes that vessels under a legal obligation to broadcast via AIS will do so. Both the long-term vessel traffic data and the AIS component of the vessel traffic survey data assume that the details broadcast via AIS are accurate (such as vessel type and dimensions) unless there is clear evidence to the contrary.
5.4.2 Historical Incident Data
5.4.2 Historical Incident Data
- Although all UK commercial vessels are required to report accidents to the MAIB, non-UK vessels do not have to report unless they are in a UK port or within 12 nm territorial waters (noting that the shipping and navigation study area is not located within 12 nm territorial waters) or carrying passengers to a UK port. There are also no requirements for non-commercial recreational craft to report accidents to the MAIB.
- The RNLI incident dataset cannot be considered comprehensive of all incidents in the shipping and navigation study area. Although hoaxes and false alarms are excluded, any incident to which a RNLI resource was not mobilised has not been accounted for in this dataset.
5.4.3 United Kingdom Hydrographic Office Admiralty Charts
5.4.3 United Kingdom Hydrographic Office Admiralty Charts
- The UKHO admiralty charts are updated periodically and therefore the information shown may not reflect the real-time features within the region with total accuracy. However, during consultation for the Array, input has been sought from relevant stakeholders regarding the navigational features baseline.
6 Project Description
6 Project Description
- The NRA reflects the Project Description which is detailed in full in volume 1, chapter 3. The following subsections outline the maximum extent of the Array for which any shipping and navigation hazards are assessed.
6.1 Site Boundary
6.1 Site Boundary
- The site boundary is located at a minimum distance of approximately 43 nm from the coast (from Aberdeen to the north-western corner of the site boundary). The total area covered by the site boundary is approximately 250 square nautical miles (nm2) (858 km2), with charted water depths ranging from 62 m to 84 m below Chart Datum (CD) (site survey data indicates water depths range between 63.8 m and 88.7 m relative to LAT).
- The key coordinates defining the site boundary are illustrated in Figure 6.1, with the main defining coordinates numbered. Following this, Table 6.1 presents each coordinate numerically using World Geodetic System 1984 (WGS84) latitude/longitude.
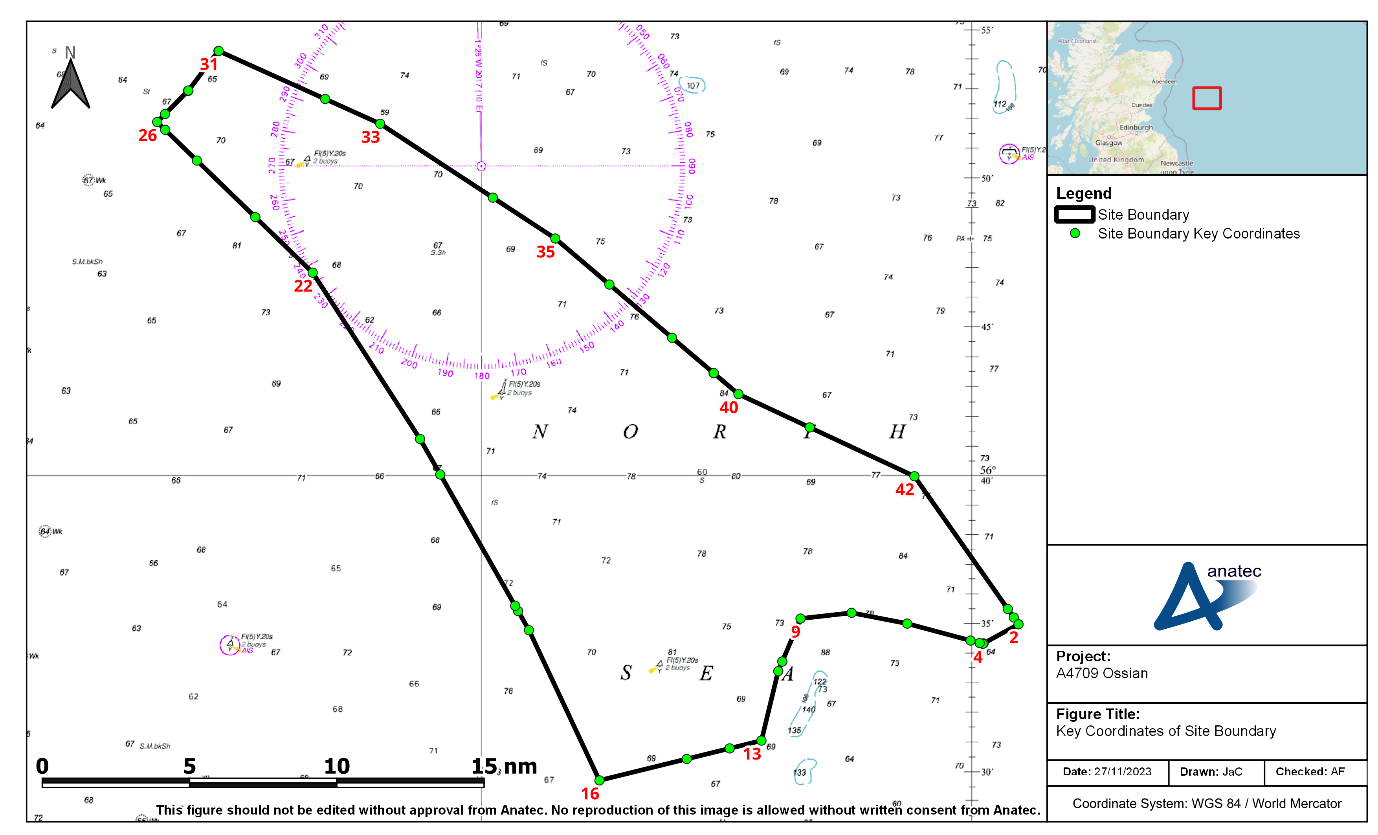
Figure 6.1: Key Coordinates of Site Boundary (Geographic)
Table 6.1: Key Coordinates of Site Boundary (Numeric)
ID | Latitude | Longitude |
|---|---|---|
1 | 56° 35' 11.533" N | 000° 02' 35.596" E |
2 | 56° 34' 57.893" N | 000° 02' 53.016" E |
3 | 56° 34' 19.204" N | 000° 00' 44.626" E |
4 | 56° 34' 18.235" N | 000° 00' 41.422" E |
5 | 56° 34' 19.909" N | 000° 00' 30.118" E |
6 | 56° 34' 24.863" N | 000° 00' 03.373" W |
7 | 56° 34' 59.254" N | 000° 03' 55.901" W |
8 | 56° 35' 21.134" N | 000° 07' 20.312" W |
9 | 56° 35' 09.449" N | 000° 10' 27.966" W |
10 | 56° 33' 42.512" N | 000° 11' 34.840" W |
11 | 56° 33' 42.257" N | 000° 11' 35.038" W |
12 | 56° 33' 22.918" N | 000° 11' 49.913" W |
13 | 56° 31' 01.855" N | 000° 12' 51.613" W |
14 | 56° 30' 45.979" N | 000° 14' 48.365" W |
15 | 56° 30' 24.552" N | 000° 17' 25.987" W |
16 | 56° 29' 40.952" N | 000° 22' 46.675" W |
17 | 56° 34' 45.887" N | 000° 27' 05.512" W |
18 | 56° 35' 24.853" N | 000° 27' 45.590" W |
19 | 56° 35' 35.390" N | 000° 27' 56.426" W |
20 | 56° 40' 01.164" N | 000° 32' 31.427" W |
21 | 56° 41' 12.908" N | 000° 33' 45.662" W |
22 | 56° 46' 48.821" N | 000° 40' 20.226" W |
23 | 56° 48' 40.680" N | 000° 43' 50.844" W |
24 | 56° 50' 34.717" N | 000° 47' 25.559" W |
25 | 56° 51' 36.619" N | 000° 49' 22.109" W |
26 | 56° 51' 52.258" N | 000° 49' 51.557" W |
27 | 56° 52' 08.432" N | 000° 49' 22.264" W |
28 | 56° 52' 54.566" N | 000° 47' 58.711" W |
29 | 56° 52' 55.639" N | 000° 47' 56.774" W |
30 | 56° 54' 15.325" N | 000° 46' 06.316" W |
31 | 56° 54' 15.048" N | 000° 46' 05.192" W |
32 | 56° 52' 38.608" N | 000° 39' 34.247" W |
33 | 56° 51' 48.737" N | 000° 36' 12.078" W |
34 | 56° 49' 20.021" N | 000° 29' 18.128" W |
35 | 56° 47' 57.646" N | 000° 25' 28.837" W |
36 | 56° 46' 24.888" N | 000° 22' 10.114" W |
37 | 56° 44' 37.464" N | 000° 18' 19.966" W |
38 | 56° 43' 26.026" N | 000° 15' 46.912" W |
39 | 56° 43' 26.026" N | 000° 15' 46.912" W |
40 | 56° 42' 43.600" N | 000° 14' 16.015" W |
41 | 56° 41' 36.352" N | 000° 09' 54.137" W |
42 | 56° 39' 57.629" N | 000° 03' 29.693" W |
43 | 56° 35' 28.864" N | 000° 02' 13.466" E |
6.2 Surface Infrastructure
6.2 Surface Infrastructure
6.2.1 Indicative Worst-Case Layout
6.2.1 Indicative Worst-Case Layout
- For the purposes of the NRA, the MDS for the Array layout considers installation of up to 280 surface structures, consisting of up to 265 wind turbines, up to three large Offshore Substation Platforms (OSPs) with up to 12 smaller OSPs. Although the final locations of infrastructure have not yet been defined, an indicative worst-case layout has been determined for shipping and navigation and is presented in Figure 6.2.
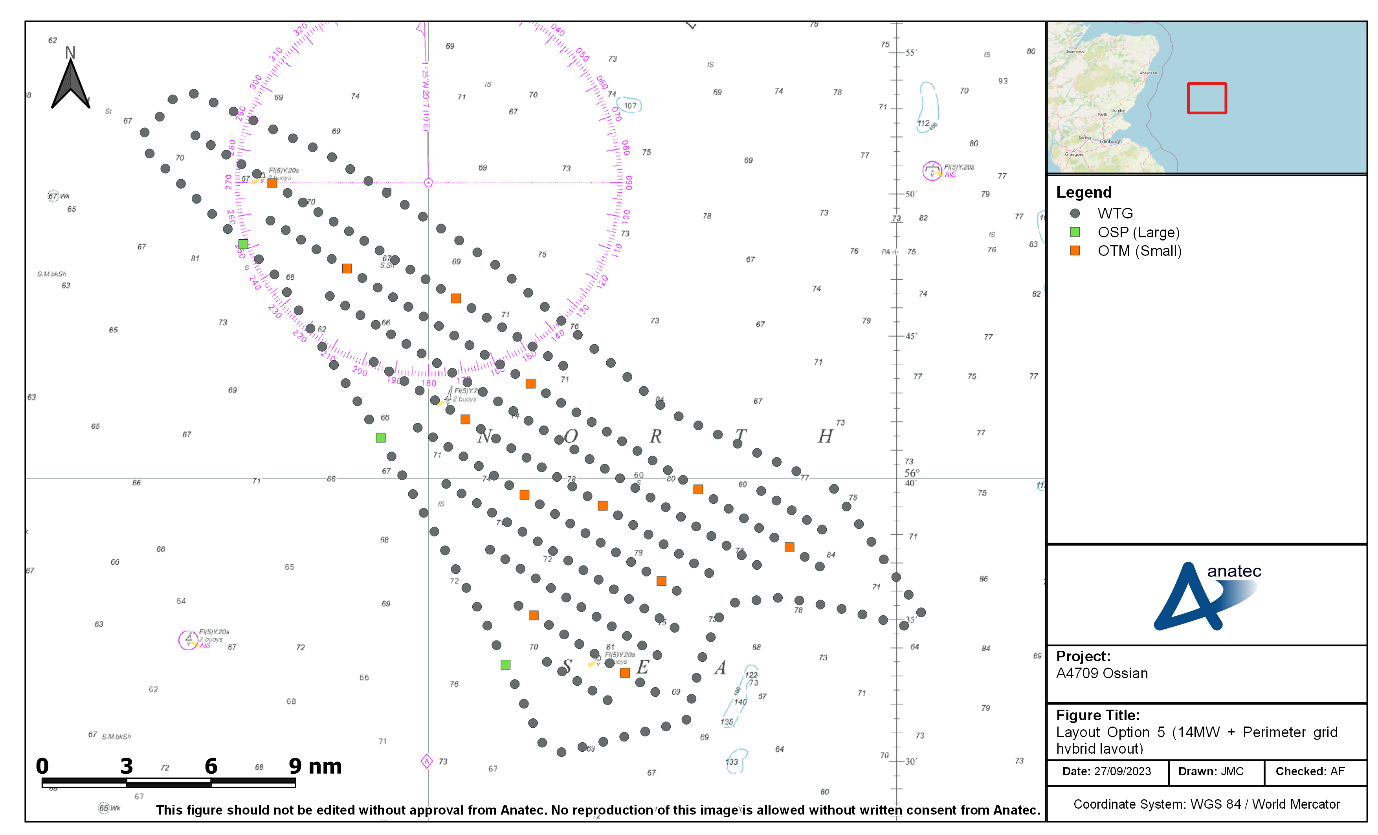
Figure 6.2: Indicative Worst-Case Layout for Shipping and Navigation
- As part of the worst-case layout for shipping and navigation, the three large OSPs are all located on the western boundary in proximity to regular routeing vessel traffic (see section 11).
- The indicative worst-case layout includes a dense perimeter to maximise passing allision risk. It is noted that the final layout may include a Single Line of Orientation dependent on ground conditions. The final layout including any proposal for a Single Line of Orientation will be discussed with the MCA post consent as per MGN 654 (MCA, 2021).
- The minimum spacing between structures is 1 km.
6.2.2 Wind Turbine Generators
6.2.2 Wind Turbine Generators
- The wind turbines within the indicative layout each have a maximum rotor diameter of 236 m and maximum blade tip height (above Lowest Astronomical Tide (LAT)) of 266 m, noting that these values represent the MDS for shipping and navigation and do not necessarily represent the maximum parameters presented within volume 1, chapter 3.
- Semi-submersible floating foundations have been considered as the MDS for shipping and navigation as this foundation type has the largest surface dimensions (when assuming a layout with the largest number of wind turbines). The MDS wind turbine measurements assuming use of this foundation type are provided in Table 6.2.
Table 6.2: MDS for Shipping and Navigation – Wind Turbines
Parameter | MDS for shipping and navigation |
|---|---|
Foundation type | Semi-submersible floating foundations |
Dimensions at sea surface | 130×110 m |
Maximum blade tip height (above LAT) | 266 m |
Minimum blade clearance (above LAT) | 36 m |
Maximum rotor diameter | 236 m |
Maximum number of mooring lines per floating foundation | Six |
Highest connection point beneath waterline | 5 m below waterline |
Greatest angle of descent | 82 degrees from horizontal |
- As well as semi-submersible floating foundations, tension leg platforms (TLPs) are also under consideration as a foundation type, noting they would fall under the MDS assessed. Descriptions of each foundation type under consideration are provided in volume 1, chapter 3.
6.2.3 Offshore Substations
6.2.3 Offshore Substations
- For the purposes of the NRA, the MDS for shipping and navigation considers up to 15 OSPs, comprising three large OSPs and 12 smaller satellite OSPs, each with fixed jacket foundations. The large OSPs will have maximum topside dimensions of 121 m by 89 m, and the smaller satellite OSPs will have maximum topside dimensions of 41 m by 37 m. Topside dimensions, rather than foundation dimensions, have been used for the purposes of modelling as these are larger and therefore more conservative.
6.3 Subsea Cables
6.3 Subsea Cables
- Two types of subsea cables will be installed within the Array: inter-array and interconnector cables. Each of these are summarised in the following subsections.
6.3.1 Inter-Array Cables
6.3.1 Inter-Array Cables
- Inter-array cables will connect individual wind turbines to each other within the Array. Up to 1,261 km of inter-array cables will be required with the final length dependent on the final Array layout. The inter-array cable will include up to 116 km of dynamic cable located within the water column. Buoyancy modules and clump weights and tether clamps may be attached to the dynamic inter-array cable (subject to final design) to support the weight of the cable and maintain the ‘lazy-S’ configuration in the water column. Tether clamps and weighted anchors may also be required to limit the movement at the touch down area. A tether clamp is designed to secure subsea lines to an anchor on the seabed and usually comprises a steel housing that is bolted over the cable with a padeye to secure a chain to a weighted anchor on the seabed. Bend stiffeners help to reduce the fatigue in the inter-array cables, and are typically used where the cable exits the floating foundation and at touchdown points of the cable on the seabed. An indicative schematic of the inter-array cables is shown in Figure 6.3.
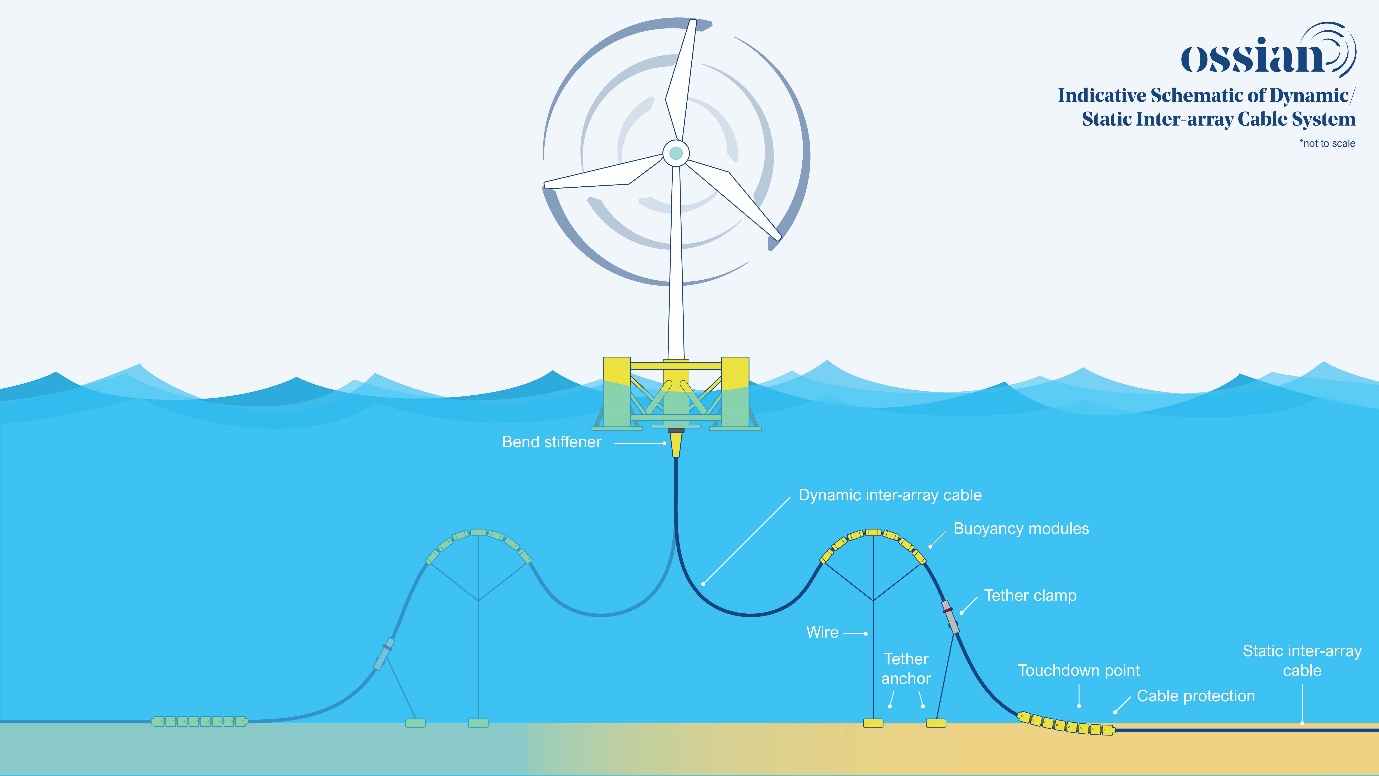
Figure 6.3: Indicative Schematic of the Dynamic/Static Inter-Array Cable System
6.3.2 Interconnector Cables
6.3.2 Interconnector Cables
- Up to 12 interconnector cables will be installed within the Array, connecting the OSPs. They will have a combined total length of up to 236 km, with the final length dependent of the final Array layout. As the OSPs will be fixed there will be no dynamic cables associated with the interconnector cables.
6.3.3 Cable Burial and Protection
6.3.3 Cable Burial and Protection
- Where practicable, the primary means of cable protection will be by seabed burial. The extent and method by which the static portion of the inter-array cables and the interconnector cables will be buried will depend on the results of a detailed seabed survey of the final inter-array and interconnector cable routes and associated Cable Burial Risk Assessment (CBRA). For both the static portion of the inter-array cables and the interconnector cables, the minimum burial depth is anticipated to be 0.4 m, subject to CBRA confirmation.
- Where target cable burial depths cannot be achieved, alternative cable protection methods may be deployed which will be determined within the CBRA. Further information on cable protection is provided in volume 1, chapter 3. Alternative cable protection will likely comprise a hard protective layer, such as graded rock or concrete mattresses. The need for this additional external protection will be subject to whether minimum target cable burial depths recommended for protection from the external threats can be achieved. In addition, Where the dynamic cable transitions to static (the transition point) some form of rock protection may be required.
- Cable burial and protection is captured in the embedded mitigation measures (see section 18.1).
6.4 Construction Timelines
6.4 Construction Timelines
- The offshore construction phase will last for approximately eight years.
6.5 Indicative Vessel and Helicopter Numbers
6.5 Indicative Vessel and Helicopter Numbers
6.5.1 Construction
6.5.1 Construction
- Indicatively 7,902 return trips from construction vessels may be made throughout the construction phase, with up to 97 vessels on site at one time. These numbers are broken down in terms of activity in Table 6.3.
Table 6.3: Indicative Vessel Numbers During Construction Phase per Activity (Total Across Construction Period)
Construction Activity
| Indicative Number of Vessels | Indicative Number of Return Trips |
|---|---|---|
Main Installation Vessels (Jack-up Barge/Dynamic Positioning vessel) | 6 | 220 |
Cargo Barge / Heavy Transport Vessel (Self-propelled) | 9 | 421 |
Support vessels (Service Operations Vessel / Offshore Supply Vessel / Offshore Accommodation Vessel) | 10 | 1270 |
Tug/Anchor Handlers | 27 | 2059 |
Construction Support Vessels | 6 | 1353 |
Cable Installation Vessels (Cable Lay Vessel) | 3 | 236 |
Guard Vessels | 6 | 1026 |
Survey Vessels | 5 | 80 |
Crew Transfer Vessels | 6 | 770 |
Trenching Support Vessel | 3 | 189 |
Boulder clearance vessel | 3 | 42 |
Geophysical/geotechnical survey vessel | 4 | 50 |
Sand wave clearance vessel | 2 | 42 |
Unexploded Ordnance clearance vessel | 2 | 4 |
Pre Lay Grapnel Run Vessel | 2 | 64 |
Rock Dumping | 2 | 40 |
Dive Support Vessel | 1 | 36 |
Total | 97 | 7,902 |
- Up to 3,942 return trips from helicopters may be made throughout the construction phase, with up to seven helicopters on site at one time.
6.5.2 Operation and Maintenance
6.5.2 Operation and Maintenance
- Up to 508 return trips from vessels may be made per annum throughout the operation and maintenance phase, with up to 31 vessels on site at one time. These numbers are broken down in terms of vessel type in Table 6.4.
Table 6.4: Vessel Numbers During Operation and Maintenance Phase per Vessel Type per Annum
Vessel Type | Maximum Number of Vessels | Maximum Number of Return Trips |
|---|---|---|
Crew Transfer Vessel (CTV) / Service Operation Vessel (SOV) / Workboats | 9 | 117 |
Tug (Anchor Handlers) vessels | 6 | 200 |
Jack-up Vessels | 2 | 5 |
Cable repair vessels (including burial solution) | 2 | 40 |
Construction Support Vessels | 5 | 60 |
Dive Support Vessel (DSV) | 1 | 26 |
Other vessels | 6 | 60 |
Total | 31 | 508 |
- Up to 216 return trips from helicopters may be made throughout the operation and maintenance phase, with up to three helicopters on site at one time.
6.5.3 Decommissioning
6.5.3 Decommissioning
- The decommissioning sequence will generally be the reverse of the construction sequence and involve similar types and numbers of vessels (albeit likely in lower numbers).
6.6 Maximum Design Scenario
6.6 Maximum Design Scenario
- The MDS for each shipping and navigation impact is provided in Table 6.5 and is based on the parameters described in the previous subsections.
Table 6.5: Maximum Design Scenario by Impact for Shipping and Navigation
Potential Impacts | Phase | Maximum Design Scenario | Justification |
|---|---|---|---|
Increased vessel to vessel collision risk resulting from displacement (third party to third party) | Construction |
| Largest possible extent of site boundary and structure size plus greatest duration resulting in the maximum effect on vessel displacement. |
Operation and maintenance |
| ||
Decommissioning |
| ||
Displacement from adverse weather routeing | All phases | As for ‘Increased vessel to vessel collision risk resulting from displacement (third party to third party)’ - see above. | Largest possible extent of site boundary and structure size plus greatest duration resulting in the maximum effect on vessel displacement from adverse weather routeing. |
Increased vessel to vessel collision risk resulting from displacement (third party to Array vessels) | Site preparation and construction |
| Maximum number of project vessels and movements leading to largest collision risk. |
Operation and maintenance |
| ||
Decommissioning |
| ||
Vessel to structure allision risk | Construction |
| Largest possible extent of site boundary, greatest number of surface structures and maximum associate dimensions, plus greatest duration resulting in the maximum effect on vessel to structure allision risk. |
Operation and maintenance |
| ||
Decommissioning |
| ||
Reduced access to local ports and harbours | All phases | As for ‘Increased vessel to vessel collision risk resulting from displacement (third party to Array Vessels)’ - see above. | Maximum number of project vessels and movements leading to largest potential impact on port access. |
Loss of station | Construction |
| Maximum number of wind turbines with greatest surface dimensions leading to largest loss of station risk. |
Operation and maintenance |
| ||
Decommissioning |
| ||
Reduction of underkeel clearance as a result of subsea infrastructure | Construction |
| Maximum number of mooring lines, plus longest length of inter-array and interconnector cables. |
Operation and maintenance | As for the construction phase. | ||
Decommissioning |
| ||
Anchor interaction with subsea cables (including dynamic cabling) | Construction |
| Maximum length of inter-array and interconnector cables. |
Operation and maintenance |
| ||
Decommissioning |
| ||
Anchor interaction with mooring lines | Construction |
| Maximum number of mooring lines. |
Operation and maintenance |
| ||
Decommissioning |
| ||
Reduction in SAR Capability | Construction |
| Largest possible extent of site boundary, greatest number of vessel activities, greatest number of surface structures and greatest duration resulting in the maximum effect on emergency response capability. |
Operation and maintenance |
| ||
Decommissioning |
|
7 Navigational Features
7 Navigational Features
- Figure 7.1 presents the charted navigational features located in proximity to the site boundary. Each of the features shown are discussed in the following subsections and have been identified using the most detailed UKHO admiralty chart available.
- It is noted that none of the following navigational features were identified in proximity to the site boundary:
- marine aggregate dredging areas;
- IMO routeing measures;
- spoil grounds;
- pilot boarding stations;
- port approaches;
- reported or designated anchorage locations; and
- Vessel Traffic Service (VTS) areas.
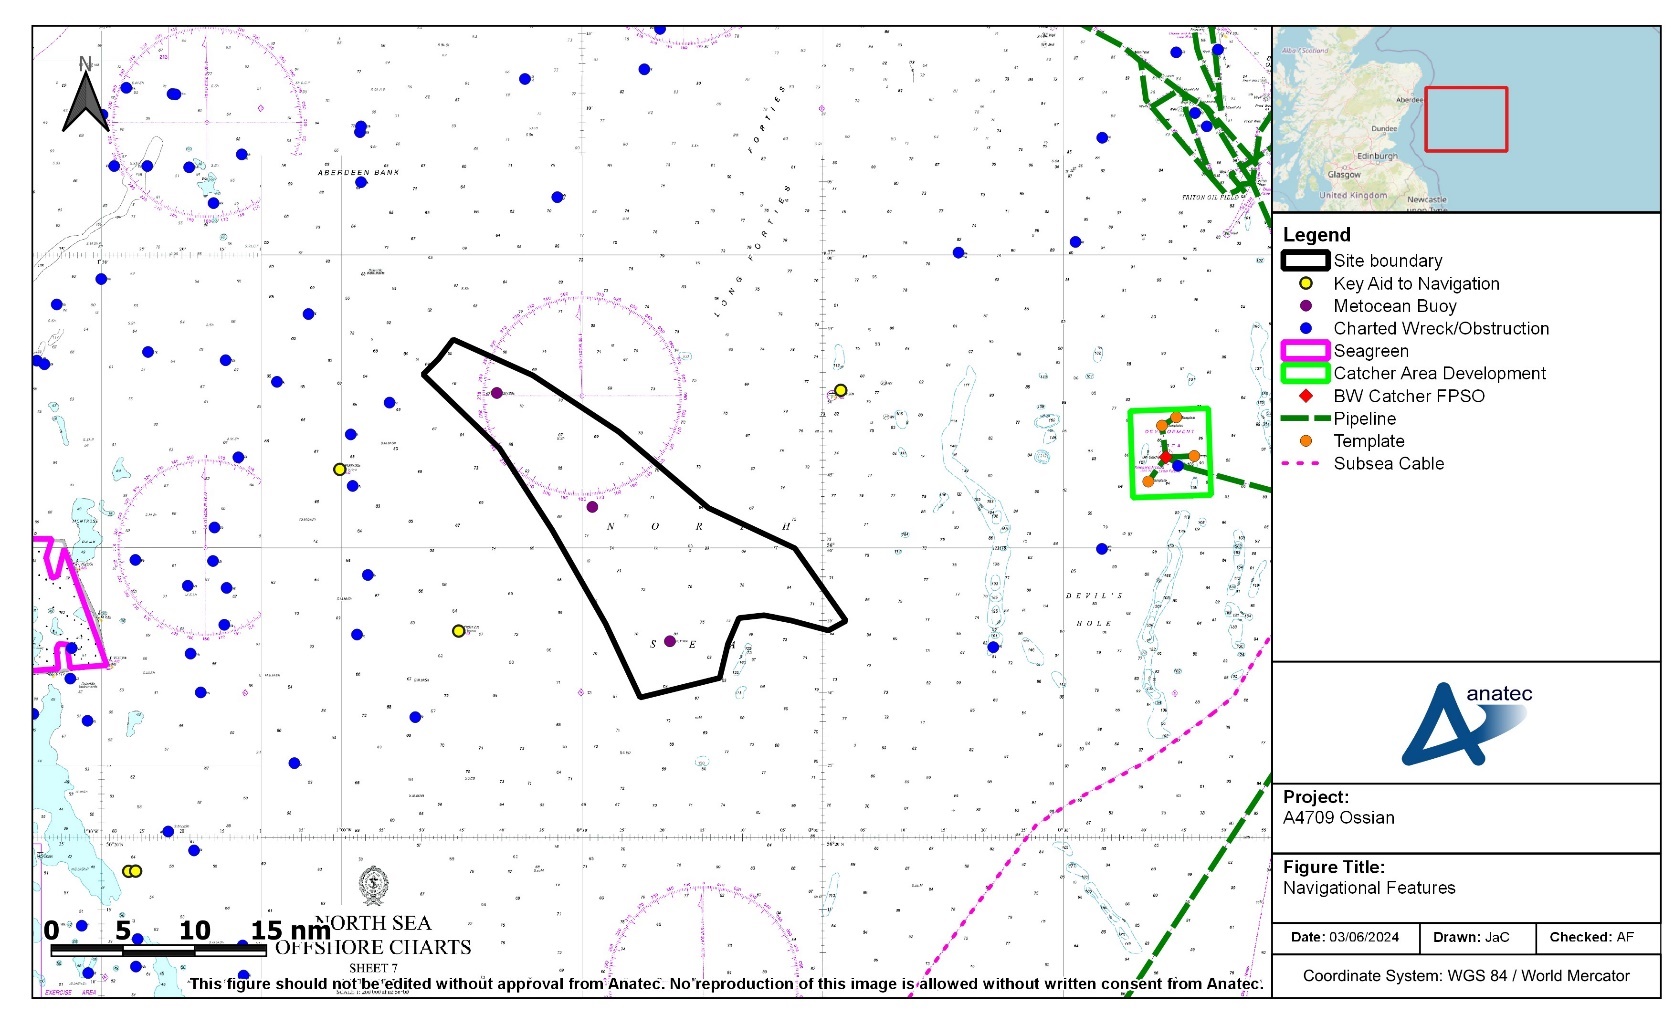
Figure 7.1: Navigational Features in the Vicinity of the Site Boundary
7.1 Key Aids to Navigation
7.2 Charted Wrecks and Obstructions
- Charted wrecks and obstructions are more commonly found in inshore waters, rather than offshore, with none located within the site boundary. The closest is a charted wreck located 3 nm from the north-western corner of the site boundary, at an approximate depth of 67 m below CD.
- Further details of wrecks including non charted wrecks is provided in volume 2, chapter 19 (which classified two wrecks and one potential wreck in the Array).
7.3 Other Offshore Wind Farm Developments
7.3 Other Offshore Wind Farm Developments
- Seagreen 1 Offshore Wind Farm is the closest baseline offshore wind farm to the Array. It is located inshore of the site boundary, at a minimum distance of approximately 27 nm, and comprises 114 wind turbines. As of May 2024, Admiralty charts indicate the construction buoyage has not yet been removed. Cumulative offshore wind farms are considered in section 14.
7.4 Oil and Gas Infrastructure
7.4 Oil and Gas Infrastructure
- A Development Area (i.e., an area charted around some oil and gas fields) is charted approximately 21 nm offshore of the site boundary; vessels that are not involved in servicing the installations within the charted limits are strongly advised to keep outside via a note on the relevant Admiralty Chart. Within the limits of the Development Area is the BW Catcher Floating, Production, Storage and Offloading (FPSO) unit with a chains and anchors zone surrounding it in addition to subsea infrastructure including subsea templates[3]. A pipeline connecting to this FPSO exits the Development Area to its east.
7.5 Subsea Cables
7.5 Subsea Cables
- A subsea power cable lies south-east of the site boundary, at a minimum distance of approximately 19 nm.
7.6 Military Practice and Exercise Areas
7.6 Military Practice and Exercise Areas
- There are various military Practice and Exercise Areas (PEXAs) in the region, however the MOD confirmed via the Ossian Array Scoping Opinion that they “do not anticipate that the development would have any substantial impact” (MD-LOT, 2023). Further details are provided in volume 2, chapter 14.
8 Meteorological Ocean Data
8 Meteorological Ocean Data
- This section presents meteorological and oceanographic statistics local to the site boundary. The data presented in this section is used as input to the collision and allision risk modelling (see section 14).
8.1 Wind Direction Probabilities
8.1 Wind Direction Probabilities
- The distribution of wind direction is presented in Figure 8.1, in the form of a wind rose. The associated data was collected from metocean buoys deployed on site between August 2022 and August 2023.
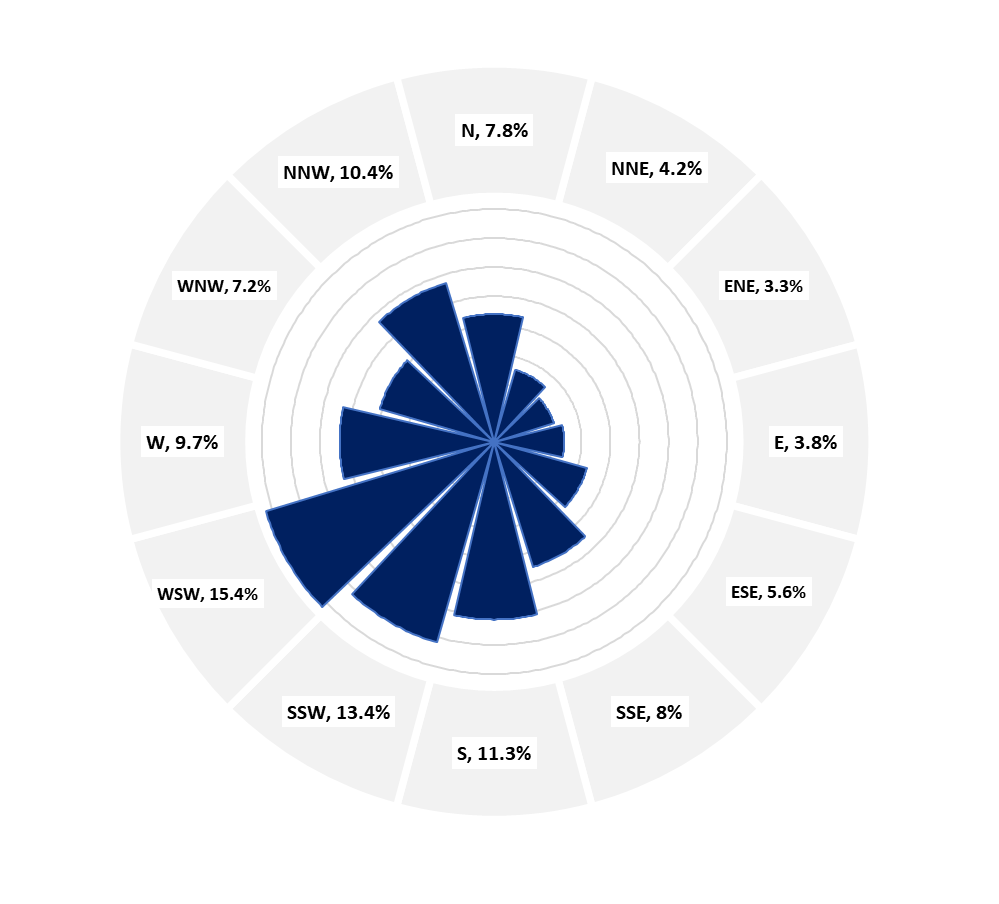
Figure 8.1: Wind Direction Distribution in Proximity to the Site Boundary
- It can be seen that the predominant wind directions at the site boundary are broadly from the south-west.
8.2 Significant Wave Height
8.2 Significant Wave Height
- The significant wave height proportions are derived from the site-specific hindcast dataset, validated on regional level. The associated data was collected from metocean buoys deployed on site between August 2022 and August 2023. The data is selected from the part of the Array with most onerous wave conditions. Table 8.1 presents the proportion of the sea state within each of three defined ranges.
Sea State | Proportion (%) |
|---|---|
Calm (< 1 m) | 18.98% |
Moderate (1–5 m) | 79.42% |
Severe (> 5 m) | 1.60% |
8.3 Visibility
8.3 Visibility
- The annual average incidence of poor visibility in the general region (defined as the proportion of a year where the visibility can be expected to be less than 1 km) is 3% (UKHO, 2021).
8.4 Tidal
8.4 Tidal
- The tidal information is derived from a site-specific hydrodynamic hindcast dataset, where the model was driven by tidal and meteorological forcing. The tidal current speeds and directions were derived using harmonic analysis of the total current speeds and subsequent prediction for 20 years to cover full nodal period. Note that the provided current speeds are depth-average values. The current speeds were derived from the region of the Array with the strongest current speeds at the north of the site boundary.
- Table 8.2 presents the peak flood and ebb direction and speed values. The directions broadly align with the admiralty charts while the speeds are greater and therefore more conservative.
Table 8.2: Peak Flood and Ebb Speed and Direction Data (Assumed for Array)
Tidal Current Point Coordinates | Flood | Ebb | ||
|---|---|---|---|---|
Direction (°) | Speed (knots) | Direction (°) | Speed (knots) | |
56° 53' 60.0" N, 000° 45' 57.6" W | 11 | 1.30 | 193 | 1.36 |
- Based upon the available data, no impacts are expected at high water that would not also be expected at low water, and vice versa. The infrastructure associated with the Array are not expected to have any additional impact on the existing tidal streams in relation to their effect on existing shipping and navigation users.
9 Emergency Response and Incident Overview
9 Emergency Response and Incident Overview
- This section summarises the existing emergency response resources (including SAR) and reviews historical maritime incident data to assess baseline incident rates in proximity to the site boundary.
9.1 Maritime Rescue Coordination Centres and Joint Rescue Coordination Centres
9.1 Maritime Rescue Coordination Centres and Joint Rescue Coordination Centres
- His Majesty’s Coastguard (HMCG), a division of the MCA, is responsible for requesting and tasking SAR resources are made available to other authorities and for coordinating the subsequent SAR operations (unless they fall within military jurisdiction).
- The HMCG coordinates SAR operations through a network of 11 Maritime Rescue Coordination Centres (MRCC), including a Joint Rescue Coordination Centre (JRCC) based in Hampshire, England.
- All of the MCA’s operations, including SAR, are divided into 18 geographical regions. Area 3 – ‘East Scotland’ covers the east coast of Scotland, from Inverness to Carnoustie, and therefore covers the area encompassing the site boundary. The Aberdeen MRCC is located within Area 3 approximately 45 nm north-west of the site boundary and coordinates the SAR response for maritime and coastal emergencies within the district boundary.
9.2 Global Maritime Distress and Safety System
9.2 Global Maritime Distress and Safety System
- The Global Maritime Distress and Safety System (GMDSS) is a maritime communications system used for emergency and distress messages, vessel to vessel routeing communications and vessel to shore routine communications. It is implemented globally, and vessels engaged in international voyages are obliged to carry GMDSS certified communication equipment.
- There are four GMDSS sea areas and, in the UK, it is the responsibility of the MCA to ensure Very High Frequency (VHF) coverage from coastal stations within sea area ‘A1’, shown in Figure 9.1.
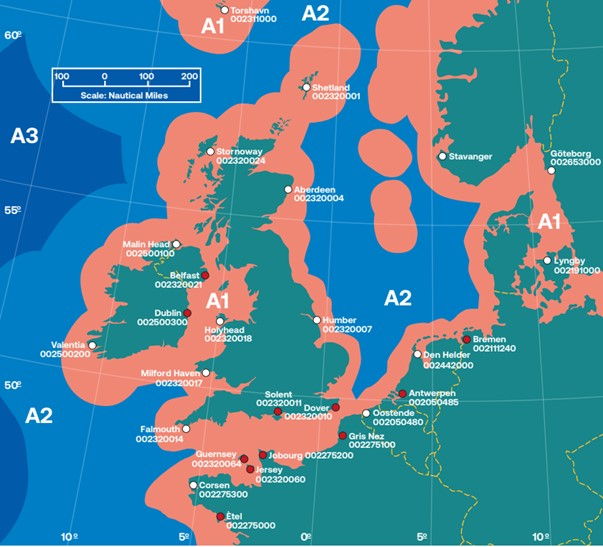
Figure 9.1: GMDSS Sea Area 1 (Red), 2 (Light Blue), and 3 (Dark Blue) (MCA, 2021)
9.3 Search and Rescue Helicopters
9.3 Search and Rescue Helicopters
- In July 2022, the Bristow Group (hereafter referred to as ‘Bristow’) were awarded a new ten year contract by the MCA (as an executive agency of the DfT), commencing in September 2024, to provide helicopter SAR operations in the UK. Bristow have been operating the service since April 2015.
- The SAR helicopter service is currently operated out of 12 base locations around the UK, with the closest to the site boundary located at Inverness Airport, approximately 113 nm north-west of the site boundary. This base operates two ‘AgustaWestland 189’ helicopters.
- As part of the new MCA contract, Bristow will also launch two new seasonal bases in Fort William and Carlisle, with the former potentially relevant to the Array (Bristow Group, 2022).
- The DfT has produced data on civilian SAR helicopter activity in the UK by the Bristow Group on behalf of the MCA. This dataset has been assessed in this NRA for the period of April 2015 to March 2023. Within this dataset, two data points are located within the shipping and navigation study area; these are presented in Figure 9.2, colour-coded by tasking type.
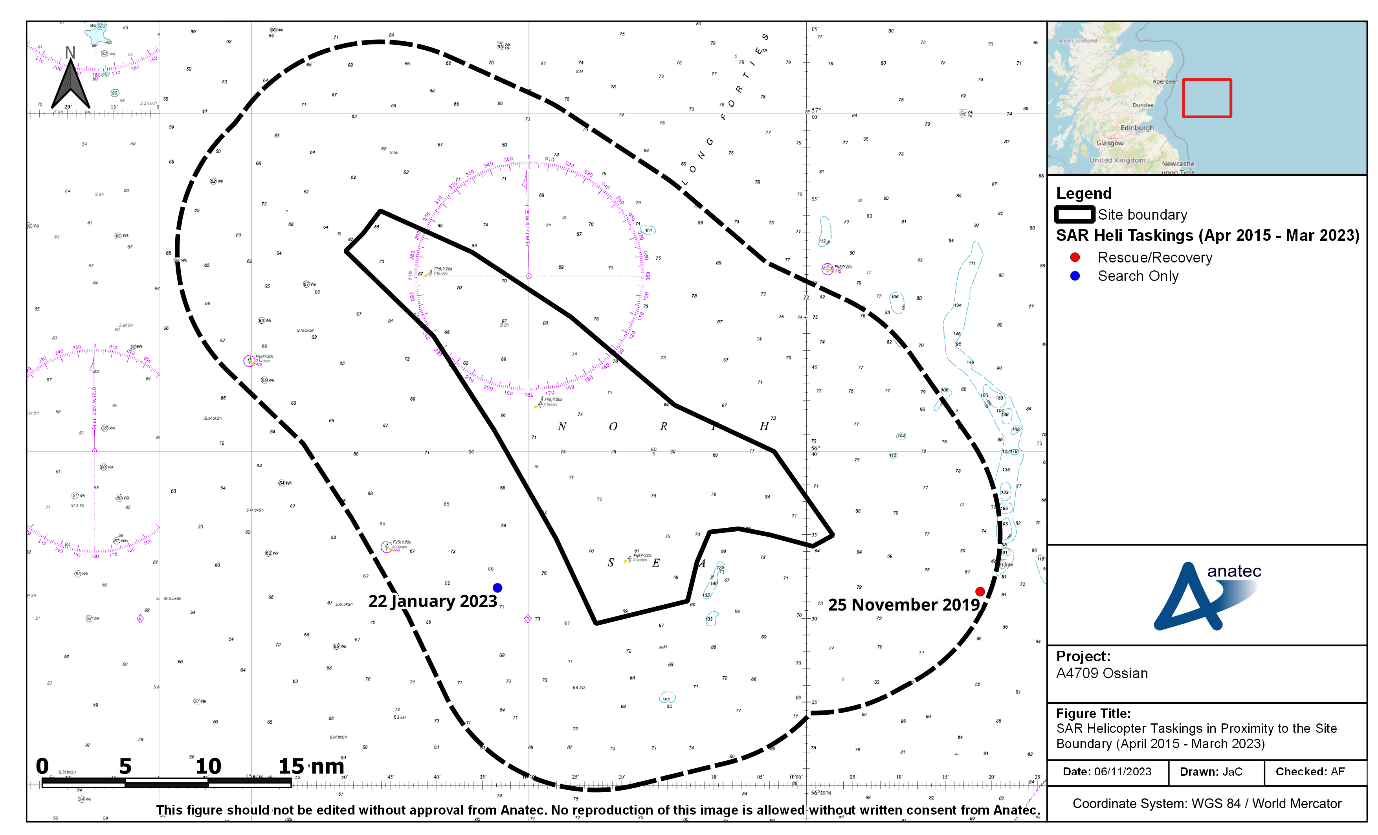
Figure 9.2: SAR Helicopter Taskings in Proximity to the Site Boundary (April 2015 to March 2023)
- A total of two taskings corresponds to an average frequency of one every four years. One of the taskings occurred at the south-eastern extent of the shipping and navigation study area on 25 November 2019, and was of type ‘Rescue/Recovery’. The other tasking occurred inshore of the site boundary on 22 January 2023, and was of type ‘Search Only’. Both operations were mobilised from Inverness.
9.4 Royal National Lifeboat Institution
9.4 Royal National Lifeboat Institution
- The RNLI is organised into six divisions, with the relevant region for the Array being the Scotland division. Based out of more than 230 stations, there are over 400 active lifeboats across the RNLI fleet, including both All-Weather Lifeboats (ALBs) and Inshore Lifeboats (ILBs).
- The closest RNLI station to the site boundary is at Aberdeen (approximately 44 nm to the north-west), where both an ALB and ILB are in use. Given that the RNLI have an operational limit of 100 nm, it is anticipated that an incident occurring in proximity to the site boundary would likely result in a response from a RNLI asset.
- Figure 9.3 and Figure 9.4 present the RNLI incidents documented within the shipping and navigation study area during the ten year period between 2013 and 2022, alongside the RNLI stations. Figure 9.3 colour-codes the incidents by casualty type and Figure 9.4 colour-codes the incidents by incident type.
- A total of three incidents were documented by the RNLI within the shipping and navigation study area[4] between 2013 and 2022, corresponding to an average of one incident every three years. It is noted that hoaxes and false alarms have been excluded from the analysis.
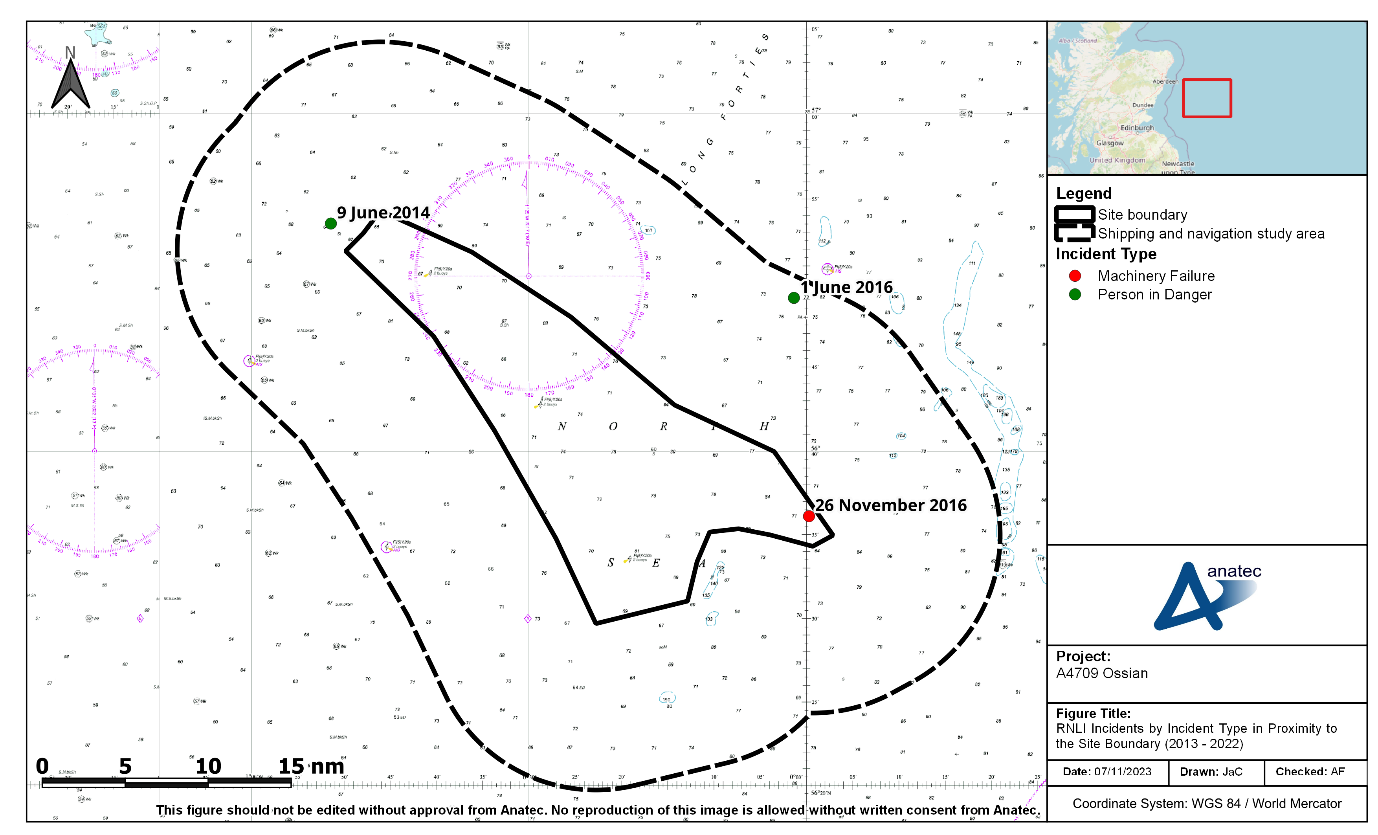
Figure 9.3: RNLI Incidents by Incident Type in Proximity to the Site Boundary (2013 to 2022)
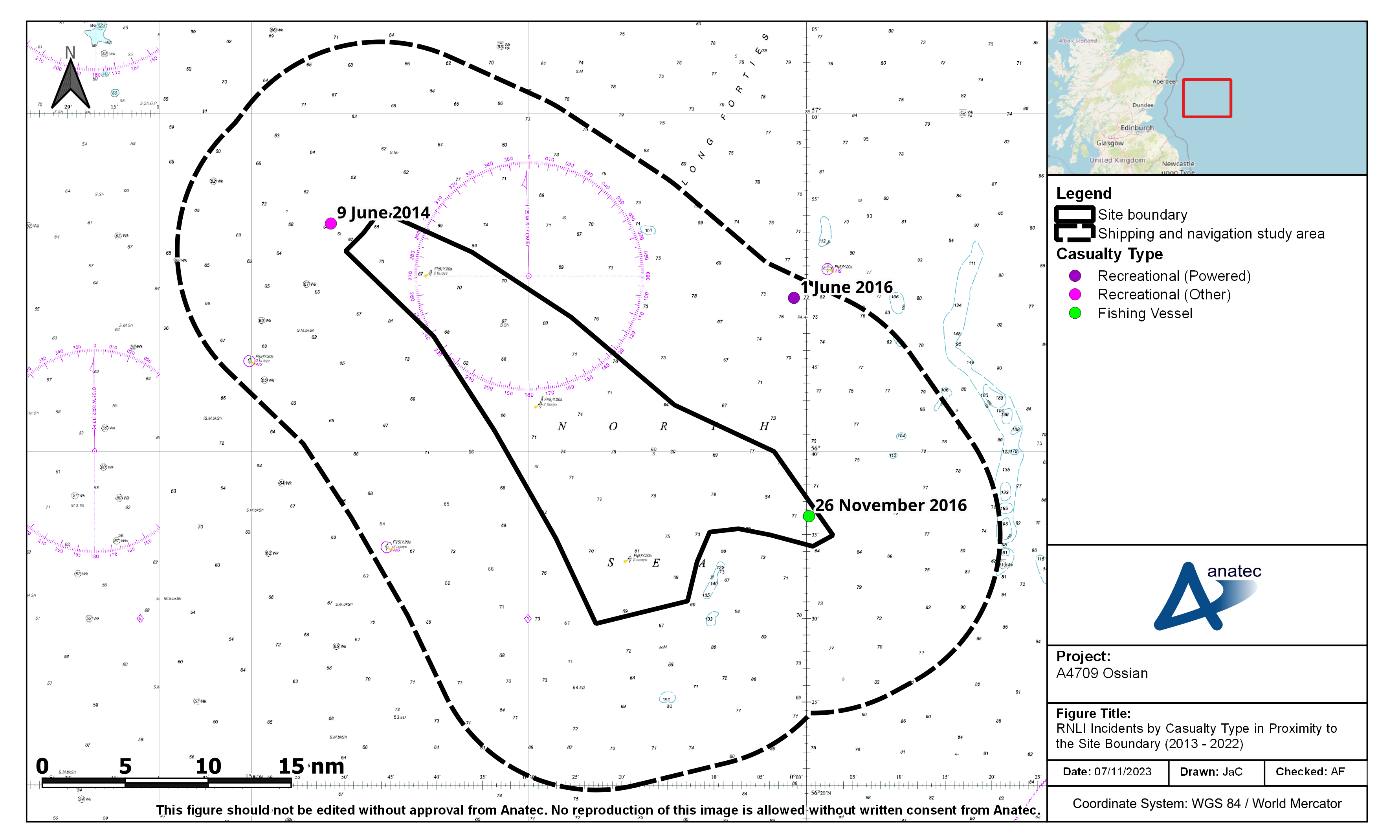
Figure 9.4: RNLI Incidents by Casualty Type in Proximity to the Site Boundary (2013 to 2022)
- One of these incidents occurred within the site boundary, at its south-eastern extent; this incident was a fishing vessel that experienced machinery failure in November 2016. The other two incidents involved recreational vessels with a person in danger; one of these occurred in June 2014 while the other occurred in June 2016.
9.5 Marine Accident Investigation Branch
9.5 Marine Accident Investigation Branch
- All UK flagged vessels and non-UK flagged vessels in UK territorial waters (within 12 nm), a UK port or carrying passengers to a UK port are required to report incidents to the MAIB. Data arising from these reports are assessed within this section, covering the ten year period between 2012 to 2021. Consideration has also been given to the preceding ten year period in section 9.5.1.
- The incidents recorded within the MAIB data between 2012 and 2021 occurring within the shipping and navigation study area are presented in Figure 9.5, colour-coded by incident type. Following this, Figure 9.6 shows the same data colour-coded by casualty type.
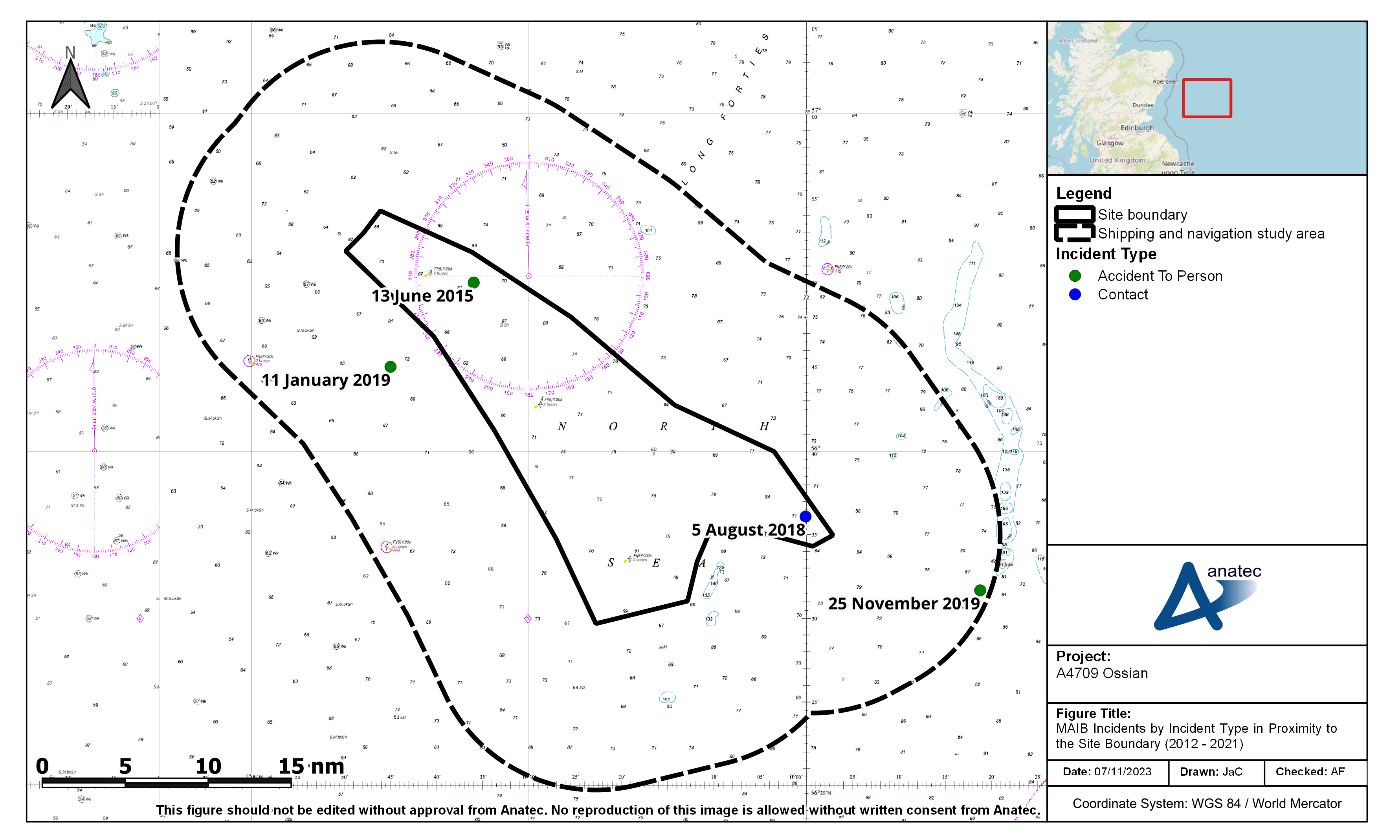
Figure 9.5: MAIB Incidents by Incident Type in Proximity to the Site Boundary (2012 to 2021)
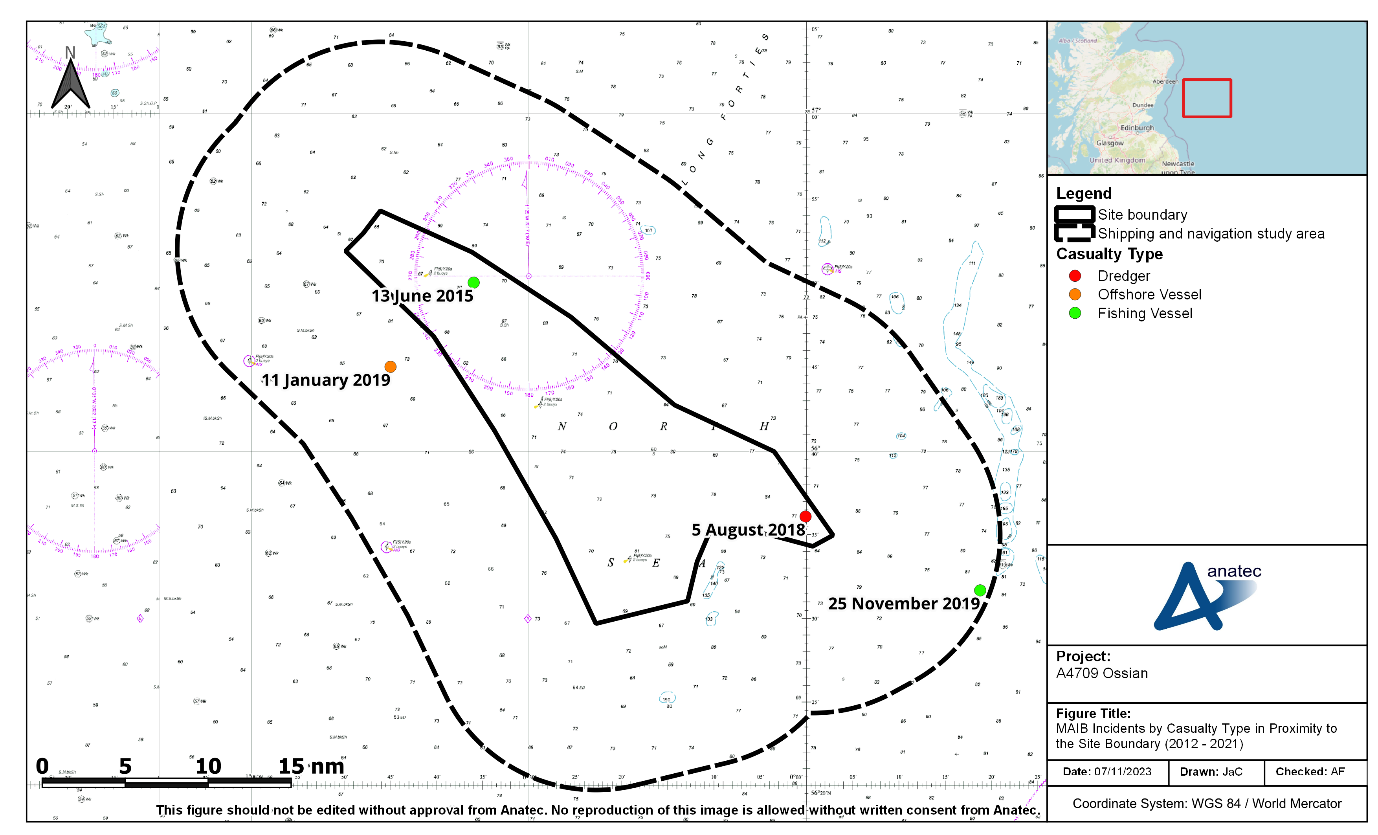
Figure 9.6: MAIB Incidents by Casualty Type in Proximity to the Site Boundary (2012 to 2021)
- A total of four incidents documented by the MAIB occurred within the shipping and navigation study area between 2012 and 2021, corresponding to an average of one incident every two to three years. Two of these incidents occurred within the site boundary; one involved a dredger alliding with a buoy in 2018 (at the south-eastern extent of the site boundary) and the other involved a person involved in an accident on a fishing vessel in 2015 (at the north of the site boundary).
- The two other incidents within the shipping and navigation survey area but outside the site boundary involved an accident to a person on a fishing vessel in 2019 (at the south-eastern extent of the shipping and navigation study area) and an accident to a person on an offshore vessel in 2019 (inshore of the site boundary).
9.5.1 Review of 2002 to 2011 MAIB Data
9.5.1 Review of 2002 to 2011 MAIB Data
- A review of older MAIB incident data during the previous ten years, i.e. 2002 to 2011, indicated that the frequency of incidents has seen a minor decline over time in this area. Figure 9.7 presents an overview of this data within the shipping and navigation study area, colour-coded by incident type.
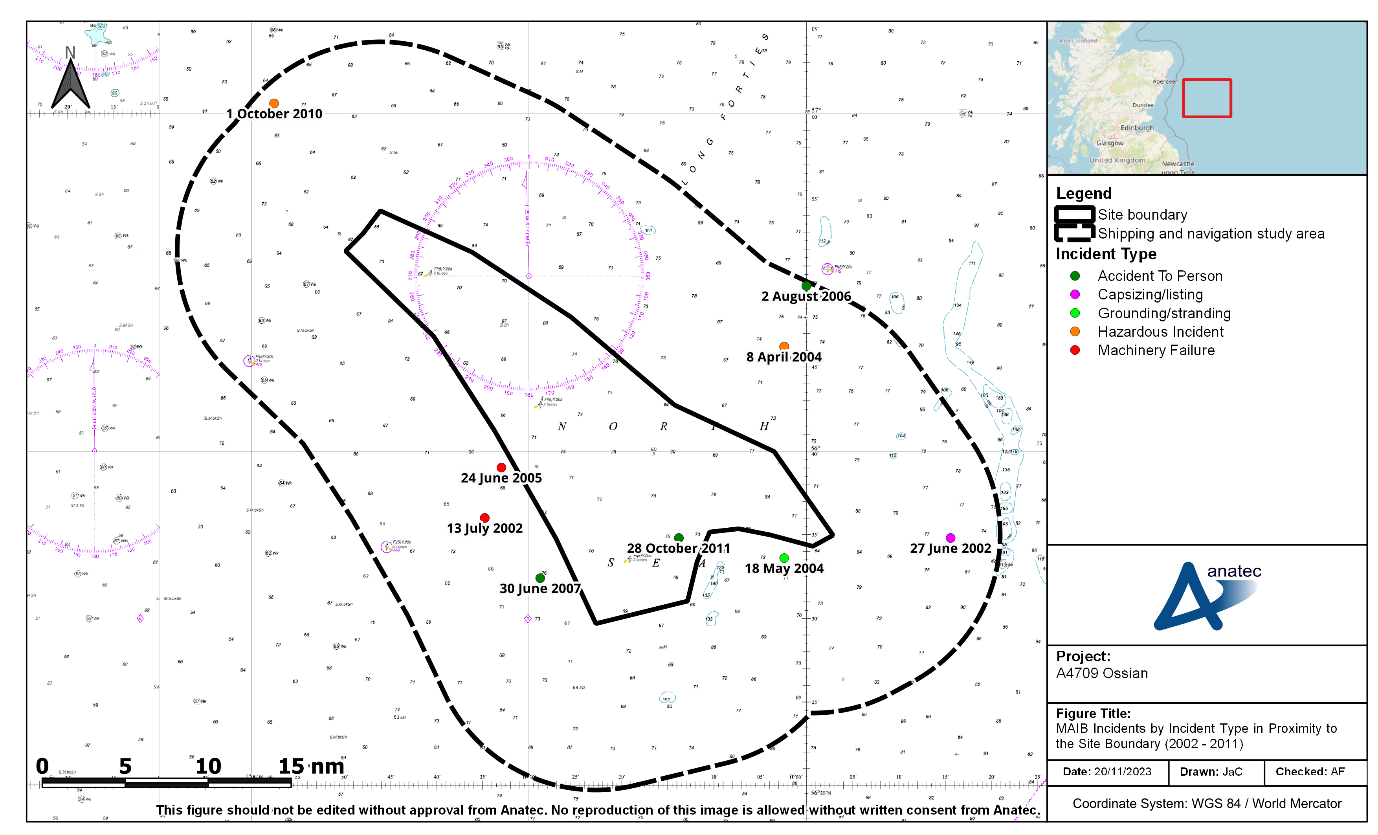
Figure 9.7: MAIB Incidents by Incident Type in Proximity to the Site Boundary (2002 to 2011)
- Within the shipping and navigation study area, a total of nine unique incidents (involving ten vessels) documented by the MAIB occurred between 2002 and 2011, corresponding to an average of one incident per year. Compared to the total of four unique incidents between 2012 and 2021, which corresponds to an average of an incident every two to three years, this demonstrates a slight decrease in the number of incidents.
- One incident occurred within the site boundary itself; this occurred in 2011 and involved an accident to a person onboard a fishing vessel.
- The most common incident type documented within the shipping and navigation study area during 2002 and 2011 was ‘accident to person’, which accounted for three out of the nine incidents. The most common casualty type was fishing vessels, accounting for seven out of the ten casualties.
9.6 Historical Offshore Wind Farm Incidents
9.6 Historical Offshore Wind Farm Incidents
9.6.1 Incidents Involving UK Offshore Wind Farm Developments
9.6.1 Incidents Involving UK Offshore Wind Farm Developments
- As of November 2023, there are 42 operational offshore wind farms in the UK, ranging from the North Hoyle Offshore Wind Farm (fully commissioned in 2003, located in Liverpool Bay) to Hornsea Project Two (fully commissioned in 2022, located in North Sea). Between them, these developments encompass approximately 22,050 fully operational wind turbine years.
- MAIB incident data has been used to collate a list of reported historical collision and allision incidents involving UK offshore wind farm developments[5], which is summarised in Table 9.1. Incidents have been categorised as involving a project vessel, third party vessel, or both. Other sources have also been used to produce this list including the UK Confidential Human Factors Incident Reporting Programme (CHIRP) for Aviation and Maritime, International Marine Contractors Association (IMCA) (CHIRP, 2023) and basic web searches.
Table 9.1: Summary of Historical Collision and Allision Incidents Involving UK Offshore Wind Farm Developments (2003 to 2022)
Incident Vessel | Incident Type | Date | Description of Incident | Vessel Damage* | Harm to Persons | Source |
|---|---|---|---|---|---|---|
Project | Allision | 07 August 2005 | Wind turbine installation vessel allision with wind turbine base whilst manoeuvring alongside it. Minor damage sustained to a gangway on the vessel, the wind turbine tower and a wind turbine blade. | Minor damage to gangway on the vessel | None | MAIB |
Project | Allision | 29 September 2006 | Offshore services vessel allision with rotating wind turbine blade. | None | None | MAIB |
Project | Allision | 08 February 2010 | Work boat allision with disused pile following human error with throttle controls whilst in proximity. Passenger later diagnosed with injuries and no serious damage sustained by vessel. | Minor | Injury | MAIB |
Project / third-party | Collision | 23 April 2011 | Third-party catamaran collision with project guard vessel within harbour. | Moderate | None | MAIB |
Project | Allision | 18 November 2011 | Cable-laying vessel allision with wind turbine foundation following watchkeeping failure. Two hull breaches to vessel. | Major | None | MAIB |
Project / project | Collision | 02 June 2012 | CTV allision with flotel. Nine persons safely evacuated and transferred to nearby vessel before being brought back into port. | Moderate | None | UK CHIRP (CHIRP, 2023) |
Project | Allision | 20 October 2012 | Project vessel allision with wind turbine monopile following human error (misjudgement of distance). Minor damage sustained by vessel. | Minor | None | MAIB |
Project | Allision | 21 November 2012 | Passenger transfer catamaran allision with buoy following navigational error. Vessel abandoned by crew of 12 having been holed, causing extensive flooding but no injuries sustained. | Major | None | MAIB |
Project | Allision | 21 November 2012 | Work boat allision with unlit wind turbine transition piece at moderate speed following navigational error. Vessel able to proceed to port unassisted with no water ingress but some structural damage sustained. | Moderate | None | MAIB |
Project | Allision | 01 July 2013 | Service vessel allision with wind turbine foundation following machinery failure. Minor damage sustained by vessel. | Minor | None | IMCA Safety Flash (CHIRP, 2023) |
Project | Allision | 14 August 2014 | Standby safety vessel allision with wind turbine pile. Oil leaked by vessel which moved away from environmentally sensitive areas until leak was stopped. | Minor with pollution | None | UK CHIRP (CHIRP, 2023) |
Third-party | Allision | 26 May 2016 | Third-party fishing vessel allision with wind turbine following human error (autopilot). Lifeboat attended the incident. | Moderate | Injury | Web search (RNLI, 2016) |
Project | Allision | 14 February 2019 | Survey vessel allided with wind turbine jacket while autopilot was engaged. | Minor | None | MAIB |
Project | Allision | 17 January 2020 | Project vessel allision with wind turbine. Injury sustained by crew member but vessel able to proceed to port unassisted. | None | Injury | Web search (Vessel Tracker, 2020) |
Project | Allision | 27 January 2020 | Project vessel allision with wind turbine. Minor damage to vessel and wind turbine sustained, with no personal injuries. | Minor | None | Marine Safety Forum (2020) |
Third-party | Allision | 09 June 2022 | Fishing vessel allision with wind turbine resulting in damage to vessel and two minor injuries for crew members. RNLI lifeboat escorted vessel under its own power to port. | Minor | Injury | Web search (RNLI, 2022) and web search (Vessel Tracker, 2022) |
(*) As per incident reports.
- The worst consequences reported for vessels involved in a collision or allision incident involving a UK offshore wind farm development has been flooding, with no life-threatening injuries to persons reported.
- As of November 2023, there have been no third-party collisions directly as a result of the presence of an offshore wind farm in the UK. The only reported collision incident in relation to a UK offshore wind farm involved a project vessel hitting a third-party vessel whilst in harbour.
- As of November 2023, there have been 13 reported cases of an allision between a vessel and a wind turbine (under construction, operational or disused) in the UK, with all but one involving a support vessel for the development. Therefore, there has been an average of 1,696 years per wind turbine allision incident in the UK, noting that this is a conservative calculation given that only operational wind turbine hours have been included (whereas allision incidents counted include non-operational wind turbines).
9.6.2 Incidents Involving Non-UK Offshore Wind Farms
9.6.2 Incidents Involving Non-UK Offshore Wind Farms
- It is acknowledged that collision and allision incidents involving non-UK offshore wind farm developments have also occurred. However, it is not possible to maintain a comprehensive list of such incidents.
- One high profile non-UK incident of note is that involving a bulk carrier in January 2022 which dragged anchor during a storm in Dutch waters and collided with another anchored vessel. The vessel began to take on water, leading to all crew members being evacuated by helicopter. The vessel then continued to drift towards shore, including though an under-construction offshore wind farm, where it allided with a wind turbine foundation and a platform foundation before being taken under tow.
9.6.3 Incidents Responded to by Vessels Associated with UK Offshore Wind Farms
9.6.3 Incidents Responded to by Vessels Associated with UK Offshore Wind Farms
- From news reports, basic web searches and experience at working with existing offshore wind farm developments, a list has been collated of historical incidents responded to by vessels associated with UK offshore wind farm developments, which is summarised in Table 9.2.
- Table 9.2 comprises known incidents that were responded to by a wind farm vessel. Additional incidents associated with the construction or operation of offshore wind farms are also known to have occurred. These incidents typically involve an accident to person which requires medical attention (including emergency response) but does not affect the operation of the vessel involved.
Table 9.2: Historical Incidents Responded to by Vessels Associated with UK Offshore Wind Farm Developments
Incident Type | Date | Related Development | Description of Incident | Source |
|---|---|---|---|---|
Capsize | 21 June 2018 | Walney Offshore Wind Farm | HMCG issued mayday relay broadcast following trimaran capsize. Support vessel for Walney arrived and recovered two persons from the water who were then winched onboard a SAR helicopter. | Web search (4C Offshore, 2018) |
Capsize | 05 November 2018 | Race Bank Offshore Wind Farm | Fishing vessel capsized resulting in two persons in the water. Vessel operating at the nearby Race Bank Offshore Wind Farm reported to have assisted with the rescue which also involved a Belgian military helicopter and the RNLI. | Web search (British Broadcasting Corporation (BBC), 2018) |
Vessel in distress | 15 May 2019 | London Array Offshore Wind Farm | Yacht in difficulty sought shelter by tying up to a wind turbine but suffered damage and a person in the water. Support vessel for London Array Offshore Wind Farm identified and secured the casualty vessel and recovered the person in the water. The support vessel raised the alarm to HMCG. HMCG later instructed the support vessel to return to port and seek medical assistance for the casualty vessel’s occupant. | Web search (The Isle of Thanet News, 2019) |
Drifting | 07 July 2019 | Gwynt y Môr Offshore Wind Farm | Speedboat suffered mechanical failure stranding four persons. Support vessel for Gwynt y Môr Offshore Wind Farm responded to an ‘all-ships’ broadcast from the HMCG and prevented the casualty vessel drifting into the Gwynt y Môr array. The support vessel later towed the casualty vessel back towards port. | Web search (Renews, 2019) |
Machinery failure | 28 September 2019 | Race Bank Offshore Wind Farm | Fishing vessel suffered mechanical failure and launched flares. Guard vessel and SOV for Race Bank Offshore Wind Farm both immediately offered assistance until the MCA’s arrival on-scene. | Internal daily progress report received by Anatec |
Vessel in distress | 13 December 2019 | Race Bank Offshore Wind Farm | Passing vessel got into difficulty and guard vessel for Race Bank Offshore Wind Farm was requested to assist. The HMCG later requested that the guard vessel tow the casualty vessel into port. | Internal daily progress report received by Anatec |
Search | 21 May 2020 | Walney Offshore Wind Farm | HMCG contacted guard vessel for Walney Offshore Wind Farm reporting red flare sighting at the offshore wind farm. Guard vessel proceeded to undertake search but did not find anything to report. | Internal daily progress report received by Anatec |
Aircraft crash | 15 June 2020 | Hornsea Project One | United States (US) jet crashed into sea during routine flight. CTV and SOV for Hornsea Project One joined the search for the missing pilot. | Web search (4C Offshore, 2020) |
Fire/ explosion | 15 December 2020 | Dudgeon Offshore Wind Farm | Fishing vessel experienced explosions on board with crew injured. SOV for Dudgeon Offshore Wind Farm deployed its Fast Rescue Boat (FRB) and evacuated the casualty vessel. | Web search (Offshore WIND, 2020) |
Vessel in distress | 03 July 2021 | Robin Rigg Offshore Wind Farm | Wind farm CTV fire alarm sounded, with the engine then shut down. A support vessel for Robin Rigg Offshore Wind Farm was able to assist in escorting the vessel to port. | Web search (Vessel Tracker, 2021) |
Drifting | 17 July 2021 | Neart na Gaoithe Offshore Wind Farm | Small dinghy with two children aboard drifted offshore due to strong winds. A guard vessel associated with Neart na Gaoithe Offshore Wind Farm was able to retrieve the children. | Web search (Edinburgh Evening News, 2021) |
Allision | 09 June 2022 | Westermost Rough Offshore Wind Farm | Fishing vessel allided with a wind turbine at Westermost Rough Offshore Wind Farm. A supply vessel was among the responders as a RNLI lifeboat escorted the vessel under its own power to port. | Web search (Vessel Tracker, 2022) |
10 Vessel Traffic Movements
10 Vessel Traffic Movements
- This section presents an overview of vessel traffic movements within the shipping and navigation study area, primarily based upon the findings of the winter and summer vessel traffic surveys undertaken in December 2022 and July 2023, respectively (see section 5.2). All vessels were recorded on AIS during the winter period and all vessels during the summer period were recorded on AIS except for one (which was recorded on Radar).
10.1 Overview
10.1 Overview
- A plot of the vessel tracks recorded during the 14-day winter survey period within the shipping and navigation study area, colour-coded by vessel type, is presented in Figure 10.1. Following this, Figure 10.2 presents the same data converted to a density heat map. All vessels were of a known type.
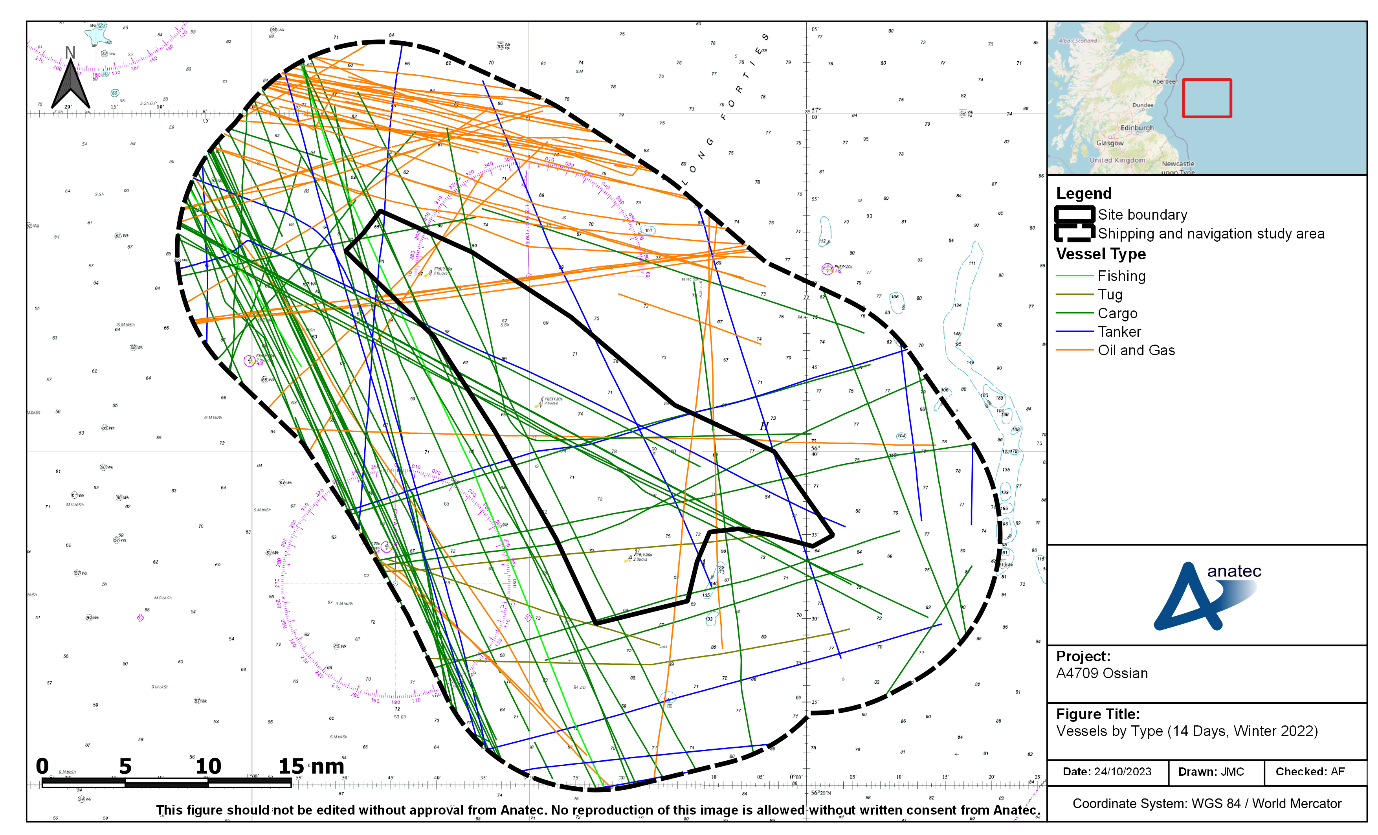
Figure 10.1: Vessels by Type Recorded During the Winter Vessel Traffic Survey (14 Days; December 2022)
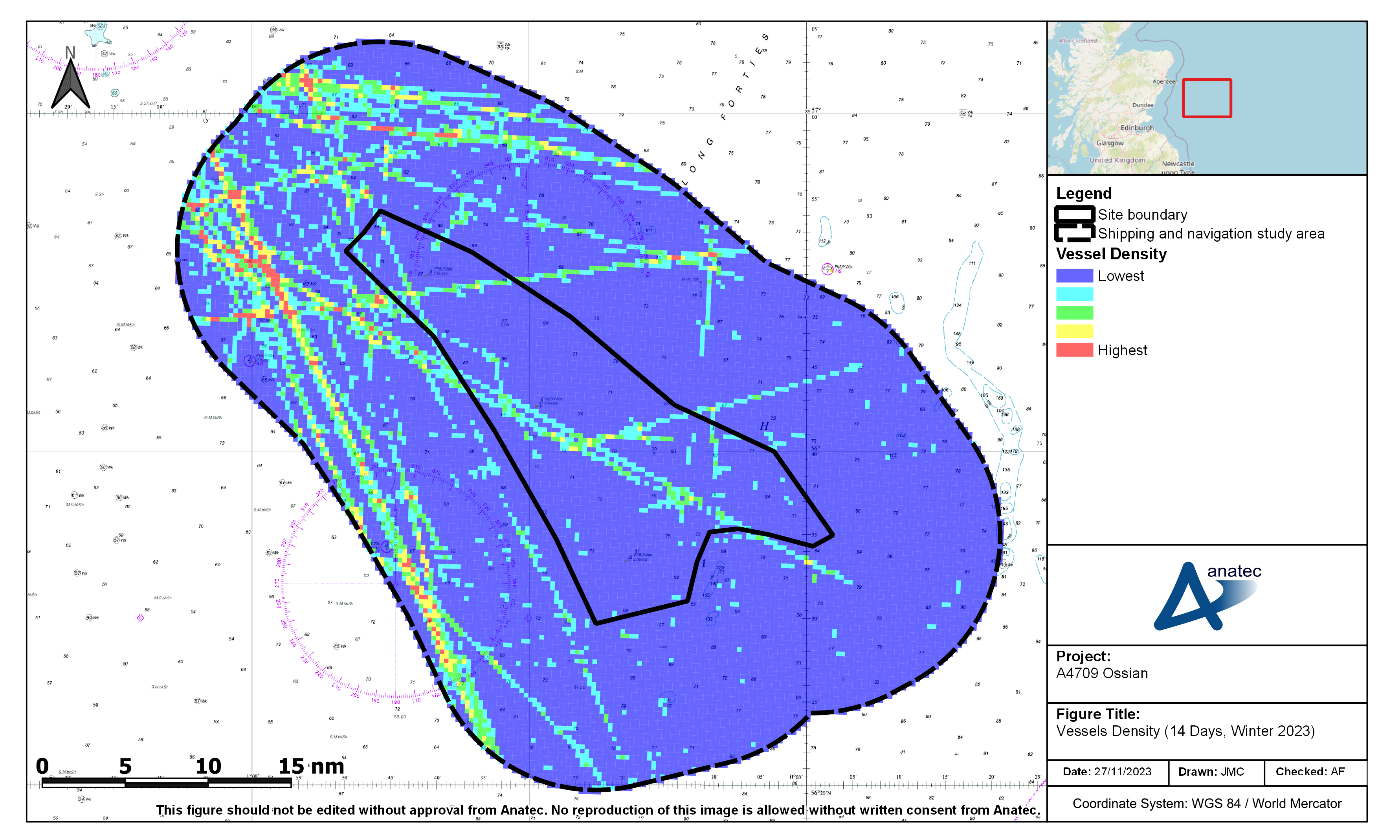
Figure 10.2: Density of Vessels Recorded During the Winter Vessel Traffic Survey (14 Days; December 2022)
- A plot of the vessel tracks recorded during the 14-day summer survey period within the shipping and navigation study area, colour-coded by vessel type, is presented in Figure 10.3. Following this, Figure 10.4: presents the same data converted to a density heat map. All vessels were of a known type, except for a single vessel which was recorded via Radar (the only non-AIS vessel).
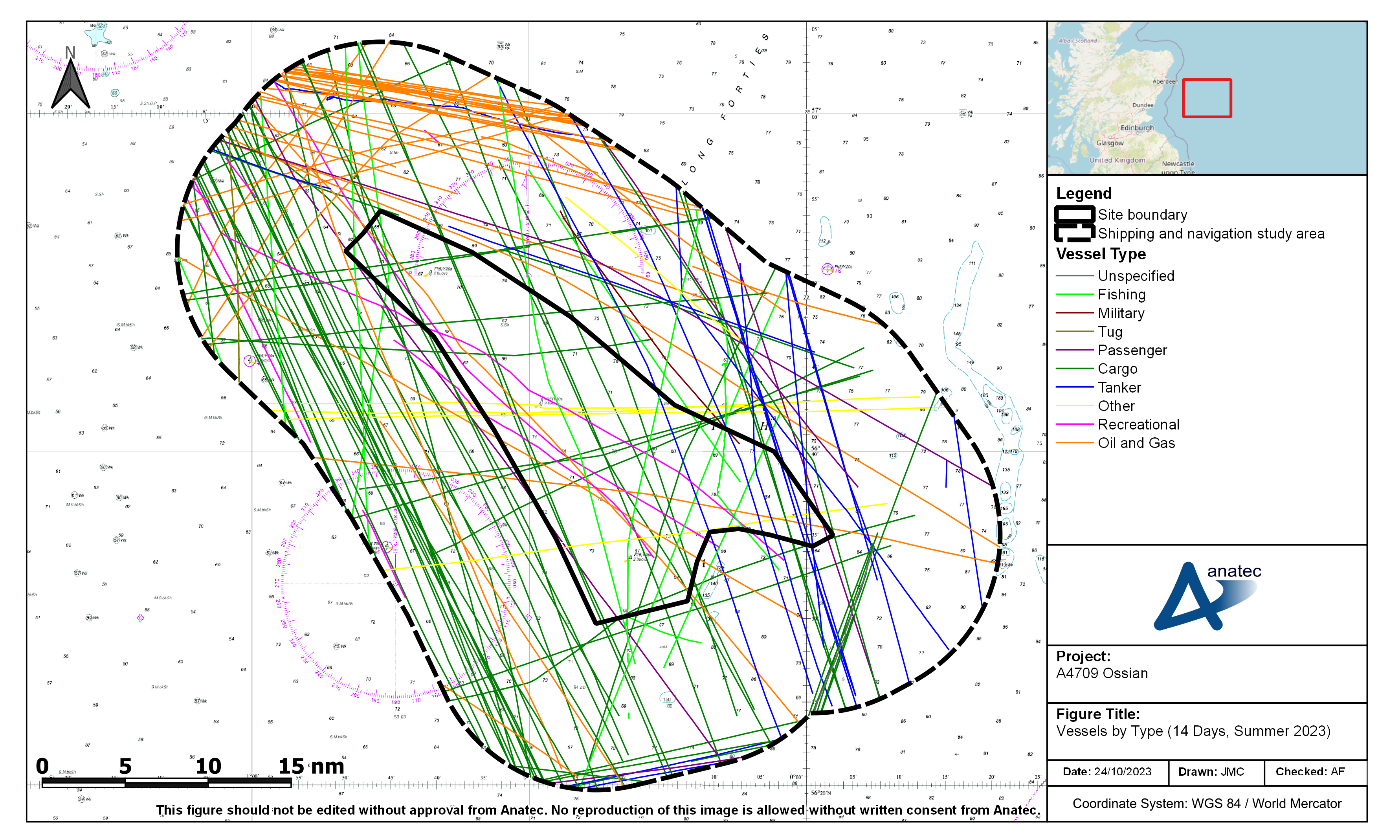
Figure 10.3: Vessels by Type Recorded During the Summer Vessel Traffic Survey (14 Days; July 2023)
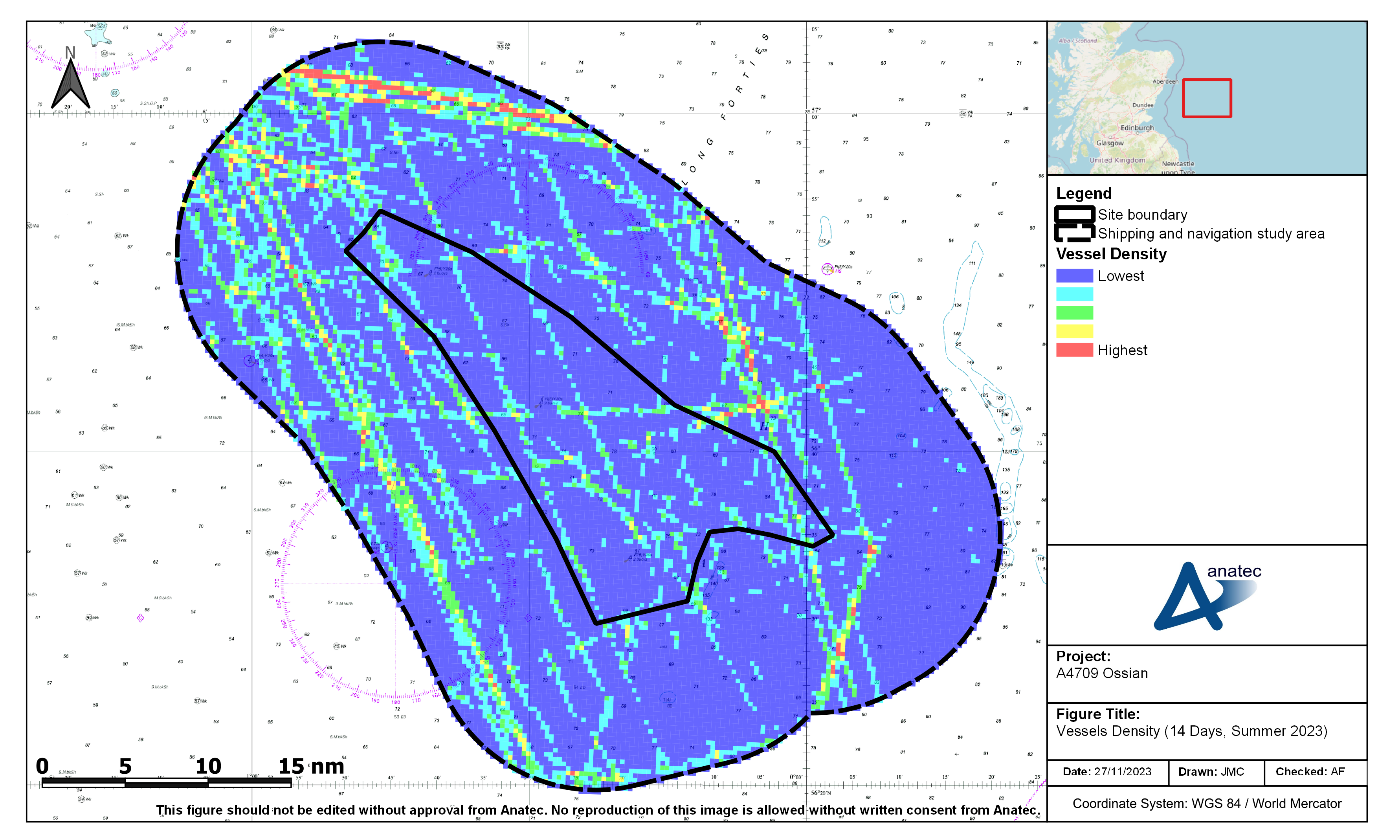
Figure 10.4: Density of Vessels Recorded During the Summer Vessel Traffic Survey (14 Days; July 2023)
10.2 Vessel Counts
10.2 Vessel Counts
10.2.1 Winter
10.2.1 Winter
- Figure 10.5 illustrates the daily number of unique vessels recorded within the shipping and navigation study area, as well as intersecting the site boundary, during the winter vessel traffic survey period.
Figure 10.5: Number of Vessels per Day Recorded During the Winter Vessel Traffic Survey (14 Days; December 2022)
- During the winter vessel traffic survey period, there was an average of nine unique vessels per day recorded within the shipping and navigation study area, with two to three per day within the site boundary.
- The busiest full days within the shipping and navigation study area were the 10 December 2022, 12 December 2022, 16 December 2022, and 17 December 2022; on each of these days, 12 unique vessels were recorded. The quietest full day within the shipping and navigation study area was 15 December 2022, on which five unique vessels were recorded.
- The busiest full day within the site boundary was the 16 December 2022, on which eight unique vessels were recorded. The quietest full days within the site boundary were the 08 December 2022, 15 December 2022, 18 December 2022, and 19 December 2022; on each of these days, a single unique vessel was recorded.
10.2.2 Summer
10.2.2 Summer
- Figure 10.6 illustrates the daily number of unique vessels recorded within the shipping and navigation study area, as well as intersecting the site boundary, during the summer vessel traffic survey period.
Figure 10.6: Number of Vessels per Day Recorded During the Summer Vessel Traffic Survey (14 Days; July 2023)
- During the summer vessel traffic survey period, there was an average of 11 unique vessels per day recorded within the shipping and navigation study area, with three to four per day within the site boundary.
- The busiest full day within the shipping and navigation study area was the 15 July 2023, on which 16 unique vessels were recorded. The quietest full days within the shipping and navigation study area were the 16 July 2023 and 17 July 2023; on each of these days, eight unique vessels were recorded.
- The busiest full day within the site boundary was the 05 July 2023, on which seven unique vessels were recorded. The quietest full day within the site boundary was the 17 July 2023, on which no vessels were recorded.
10.3 Vessel Type
10.3 Vessel Type
- Figure 10.7 presents the percentage distribution of the main vessel types recorded passing within the shipping and navigation study area, as well as the site boundary, during the winter vessel traffic survey period. The same distribution for the summer vessel traffic survey data is presented in Figure 10.8.
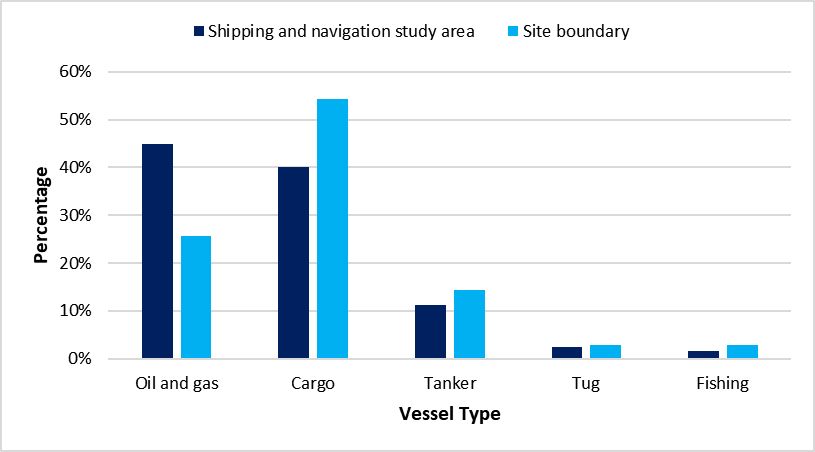
Figure 10.7: Distribution of Vessel Types Recorded During the Winter Vessel Traffic Survey (14 Days; December 2022)
Figure 10.8: Distribution of Vessel Types Recorded During the Summer Vessel Traffic Survey (14 Days; July 2023)
- During the winter vessel traffic survey period, the most common vessel types within the shipping and navigation study area were oil and gas, and cargo, accounting for 45% and 40% respectively. This was followed by tankers (11%), tugs (2%), and fishing vessels (2%).
- Within the site boundary, the most common vessel type was cargo (54%). This was followed by oil and gas (26%), tankers (14%), tugs (3%) and fishing vessels (3%).
- During the summer vessel traffic survey period, the most common vessel types within the shipping and navigation study area were cargo and oil and gas, accounting for 38% and 29% respectively. This was followed by tankers (11%), fishing (6%), recreational (5%), ‘other’ (5%), passenger (4%), and military (1%). Also recorded was a vessel of unspecified type and a tug (each of which accounted for less than 1%).
- Within the site boundary, the most common vessel type was cargo (40%). This was followed by tankers (15%), fishing (15%), ‘other’ (12%), oil and gas (6%), recreational (6%), passenger (4%), and military (2%).
- The following subsections consider each of the main vessel types individually.
10.3.1 Cargo Vessels
10.3.1 Cargo Vessels
- Figure 10.9 presents the cargo vessels recorded within the shipping and navigation study area during the combined 28-day survey period.
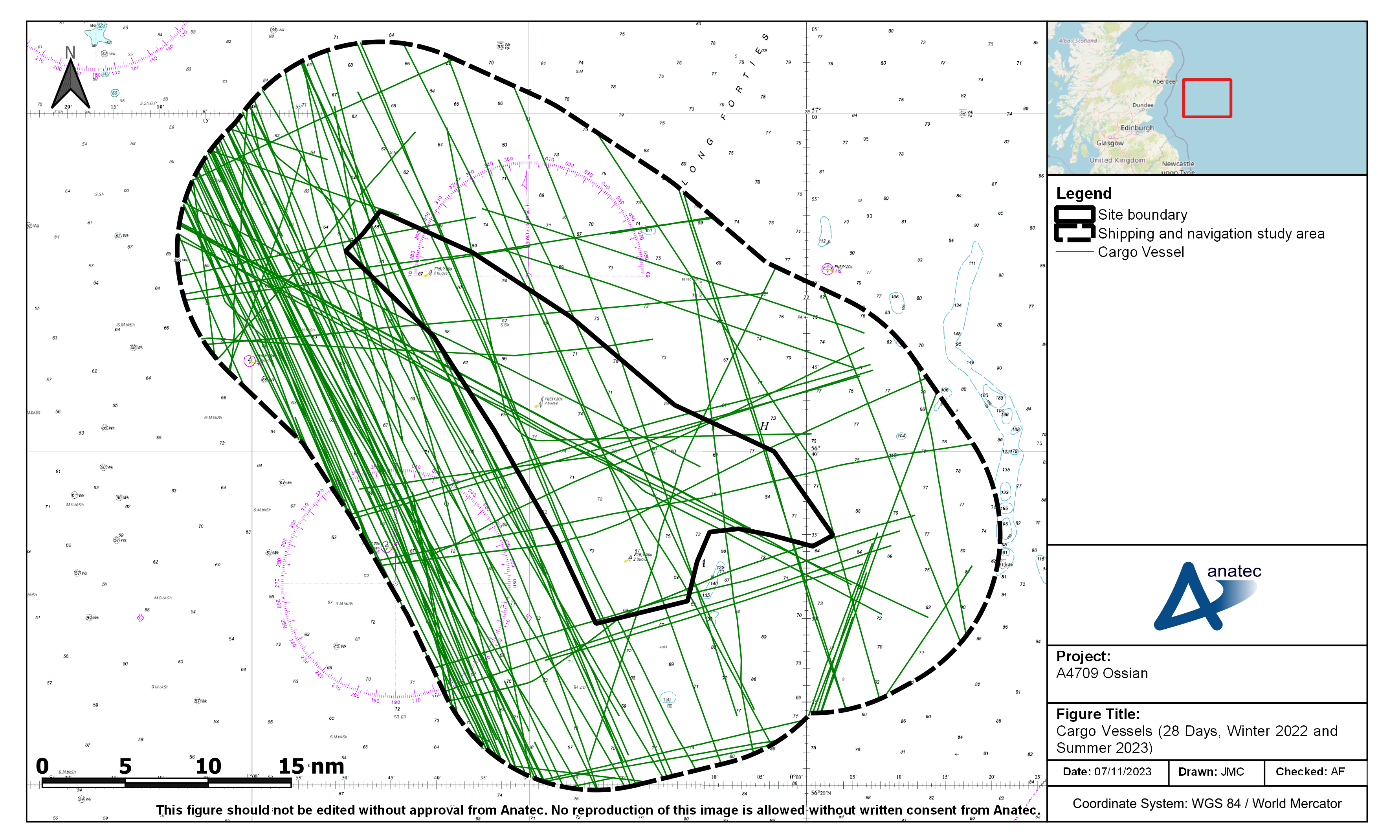
Figure 10.9: Cargo Vessels Recorded During the Combined 28-Day Vessel Traffic Survey Period (Winter 2022 and Summer 2023)
- Cargo vessels were most commonly seen in south-east/north-west transit inshore of the site boundary, with Rotterdam (Netherlands) and Iceland being common destinations. An average of four cargo vessels per day was recorded within the shipping and navigation study area during the combined 28-day period, with one to two per day within the site boundary.
- The data indicates that two Roll On Roll Off cargo ferries use the area, the Mykines and the Akranes both operated by Smyril Line. Input from Smyril Line during consultation was that these vessels transit the area two times every week all year round, i.e. a total of four transits for both vessels every week.
10.3.2 Oil and Gas Vessels
10.3.2 Oil and Gas Vessels
- Figure 10.10 presents the oil and gas vessels recorded within the shipping and navigation study area during the combined 28-day survey period.
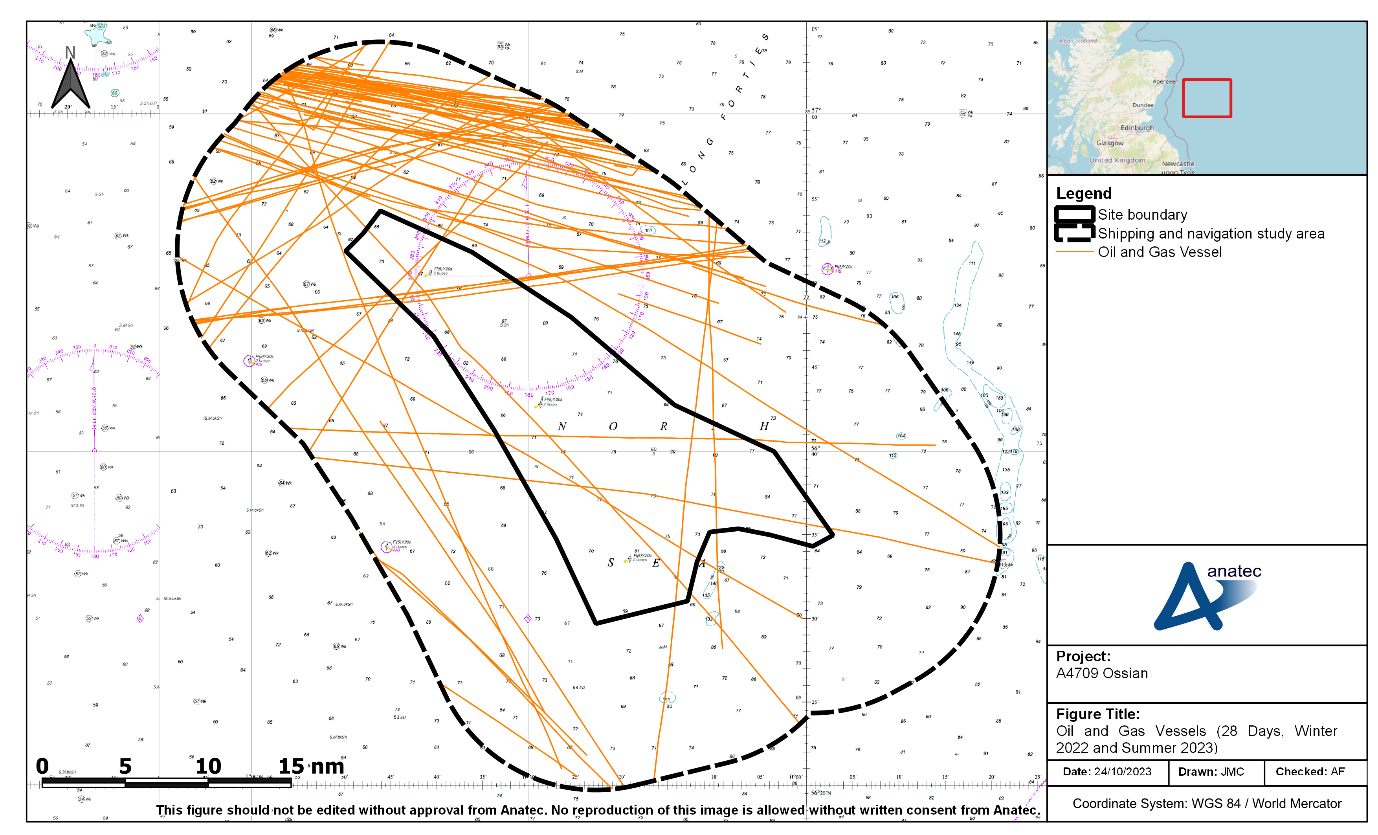
Figure 10.10: Oil and Gas Vessels Recorded During the Combined 28-Day Vessel Traffic Survey Period (Winter 2022 and Summer 2023)
- Oil and gas vessels were most commonly seen in south-east/north-west transit north of the site boundary, between Aberdeen and various oil and gas infrastructure. An average of three to four oil and gas vessels per day was recorded within the shipping and navigation study area during the combined 28-day period, with one every two to three days within the site boundary.
10.3.3 Tankers
10.3.3 Tankers
- Figure 10.11 presents the tankers recorded within the shipping and navigation study area during the combined 28-day survey period.
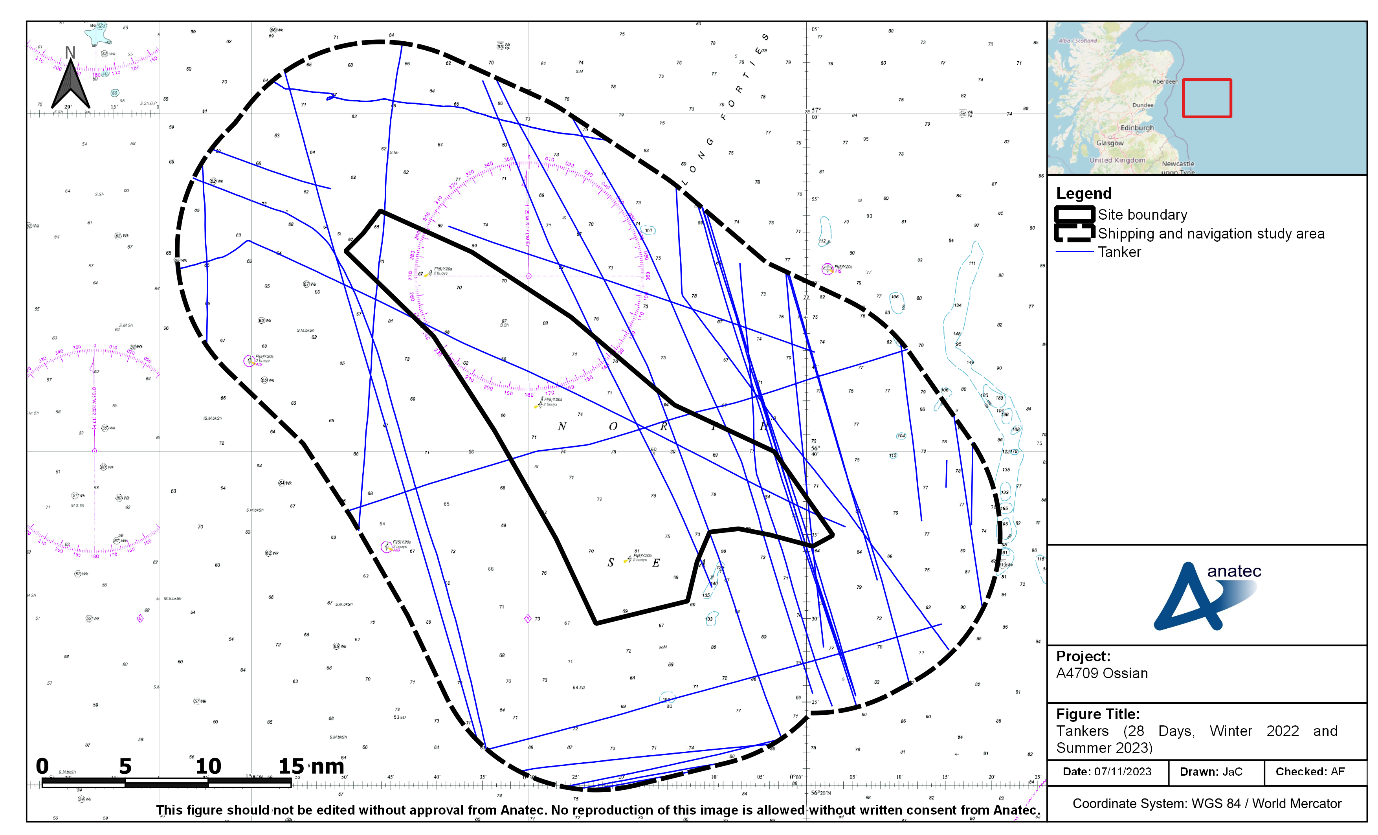
Figure 10.11: Tankers Recorded During the Combined 28-Day Vessel Traffic Survey Period (Winter 2022 and Summer 2023)
- Tankers were most commonly seen transiting south-east/north-west within the eastern half of the shipping and navigation study area, with destinations including Rotterdam (Netherlands), Iceland and the Shetland Islands. An average of one tanker per day was recorded within the shipping and navigation study area during the combined 28-day period, with one every two days within the site boundary.
10.3.4 Fishing Vessels
10.3.4 Fishing Vessels
- Figure 10.12 presents the fishing vessels recorded within the shipping and navigation study area during the combined 28-day survey period, colour-coded by average speed. As a general heuristic, average speeds of below six knots are indicative of potential active fishing.
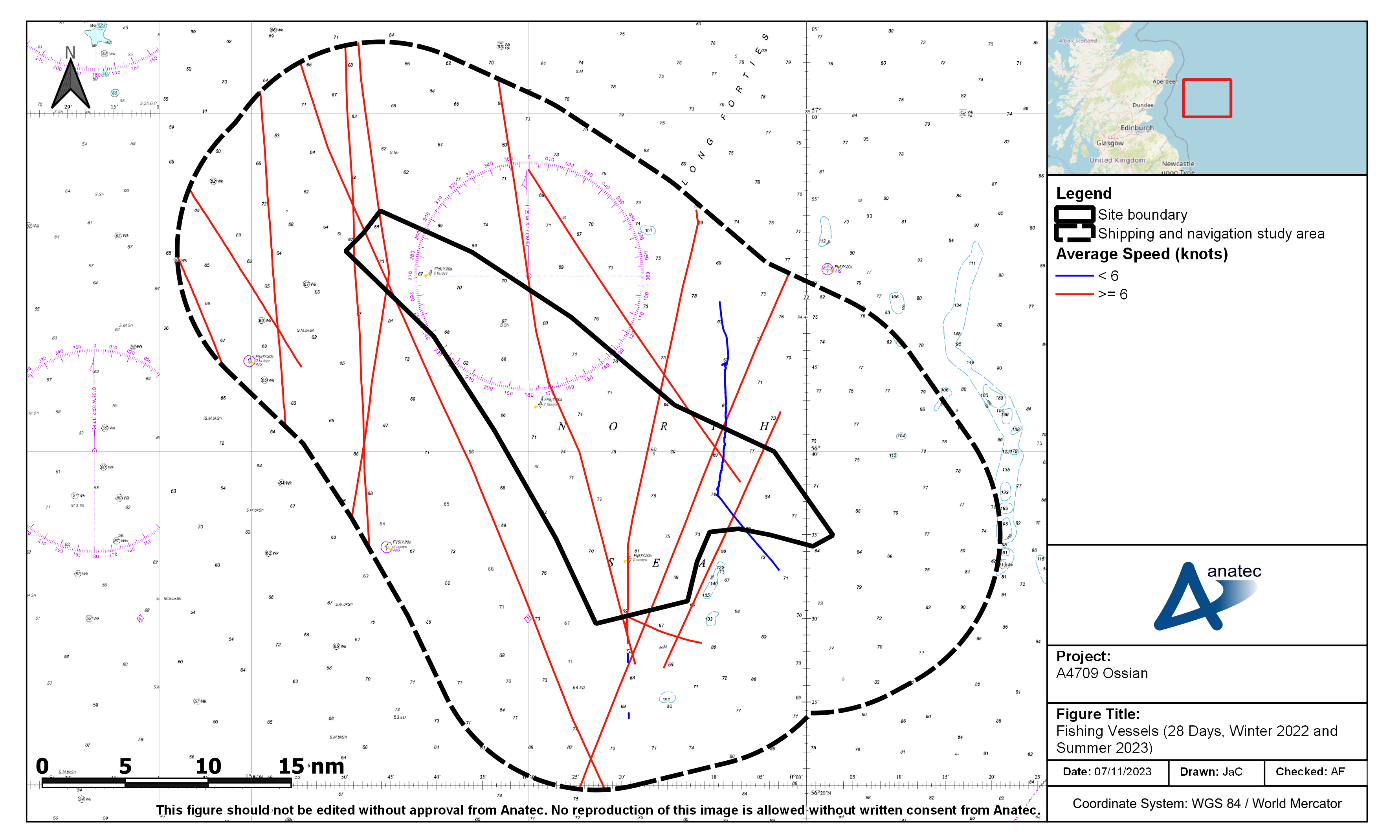
Figure 10.12: Fishing Vessels Recorded During the Combined 28-Day Vessel Traffic Survey Period (Winter 2022 and Summer 2023)
- Fishing vessels were recorded in a variety of locations throughout the shipping and navigation study area, with one vessel exhibiting potential active fishing behaviour (based on its average speed, navigational status and track behaviour). It was noted during consultation (see section 4) that routes used by fishing vessels are not always consistent and depend on choice of port and fishing grounds.
- There were low levels of fishing vessel activity recorded during the 28-day period, which aligns with input received during consultation (see section 4). An average of one fishing vessel every two to three days was recorded within the shipping and navigation study area during the combined 28-day period, with one every three days within the site boundary.
- Further information about commercial fisheries can be found in volume 2, chapter 12.
10.3.5 Recreational Vessels
10.3.5 Recreational Vessels
- Figure 10.13 presents the recreational recorded within the shipping and navigation study area during the combined 28-day survey period.
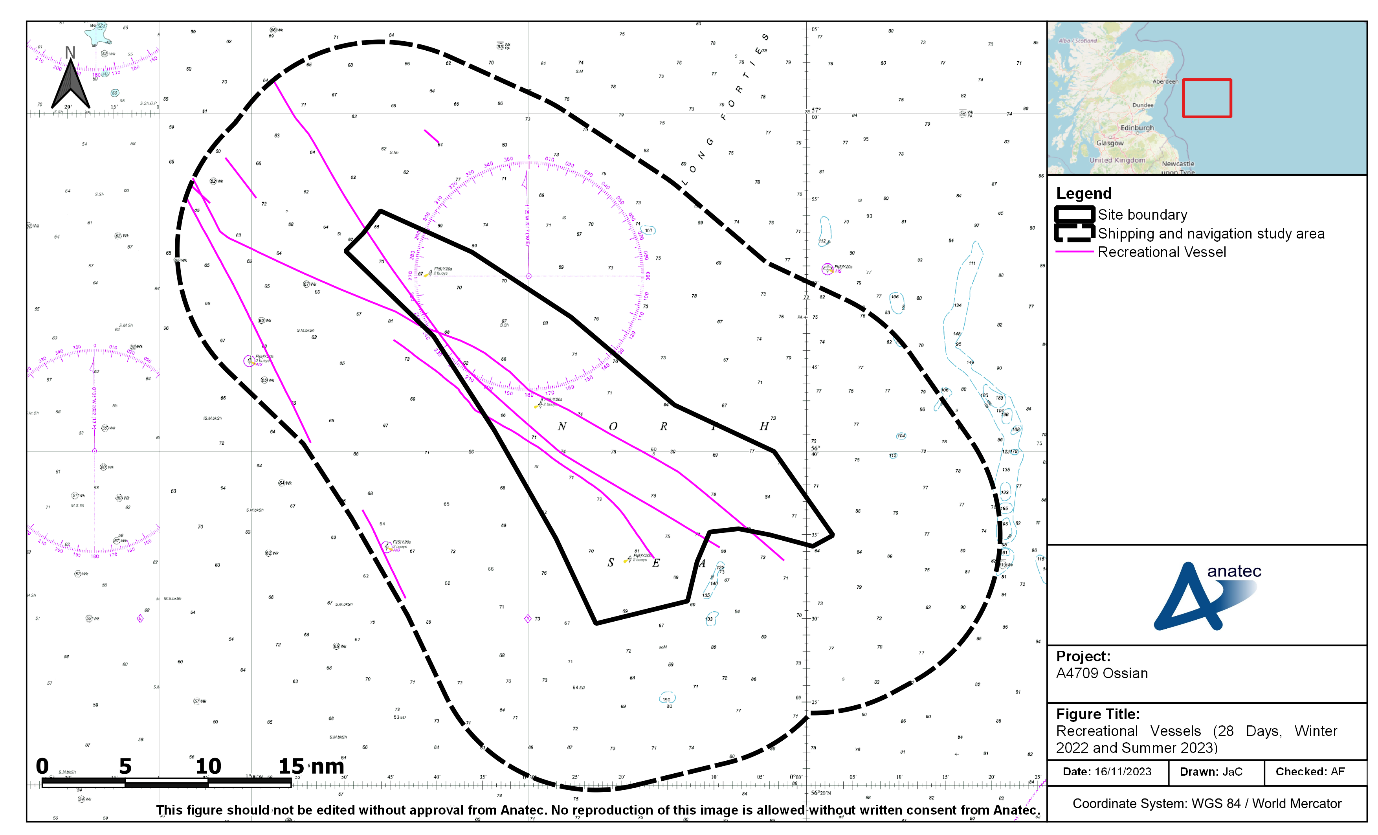
Figure 10.13: Recreational Vessels Recorded During the Combined 28-Day Vessel Traffic Survey Period (Winter 2022 and Summer 2023)
- Recreational vessels were generally recorded in north-west/south-east transit within the shipping and navigation study area.
- There were minimal levels of recreational vessels recorded, and all recreational vessels were recorded during the summer period, which aligns with input received during consultation (section 4). Also noted during consultation was that some recreational vessels transit across the North Sea to Denmark, Norway and Sweden; however, it was also noted that recreational vessels do not necessarily follow direct routes and their path can depend on wind direction.
- An average of one recreational vessel every three to four days was recorded within the shipping and navigation study area during the combined 28-day period. A total of three intersections through the site boundary was recorded, corresponding to an average of one intersection every nine to ten days.
10.3.5.1.1 Royal Yachting Association Coastal Atlas
- The RYA Coastal Atlas may be used to “help identify and protect areas of importance to recreational boaters, to advise on new development proposals and in discussions over navigational safety” (RYA, 2019). The RYA Coastal Atlas includes a heat map indicating the density of recreational activity around the UK coast. Findings of a review of this heat map aligns with both the vessel traffic survey data and consultation input in that it shows very limited recreational traffic within the shipping and navigation study area (only one cell of the heat map within the shipping and navigation study area registered a density).
10.4 Anchored Vessels
10.4 Anchored Vessels
- Vessels broadcast their navigation status including whether at anchor via AIS; no vessels were broadcasting ‘At Anchor’ as their navigation status within the shipping and navigation study area during the combined 28-day survey period. As an additional step, AIS tracks from vessels which transmitted a navigation status other than ‘At Anchor’ were used as input to Anatec’s Speed Analysis model. The program detects any tracks of vessels that were travelling with speeds of less than one knot for a minimum of 30 minutes. These tracks were then manually reviewed and none displayed anchoring behaviour. This is as would be expected given the distance offshore and the water depths.
10.5 Vessel Size
10.5 Vessel Size
10.5.1 Vessel Length
10.5.1 Vessel Length
- Figure 10.14 presents the vessels recorded within the shipping and navigation study area during the combined 28-day survey period, colour-coded by vessel length. Vessel length was available for over 99% of vessels recorded.
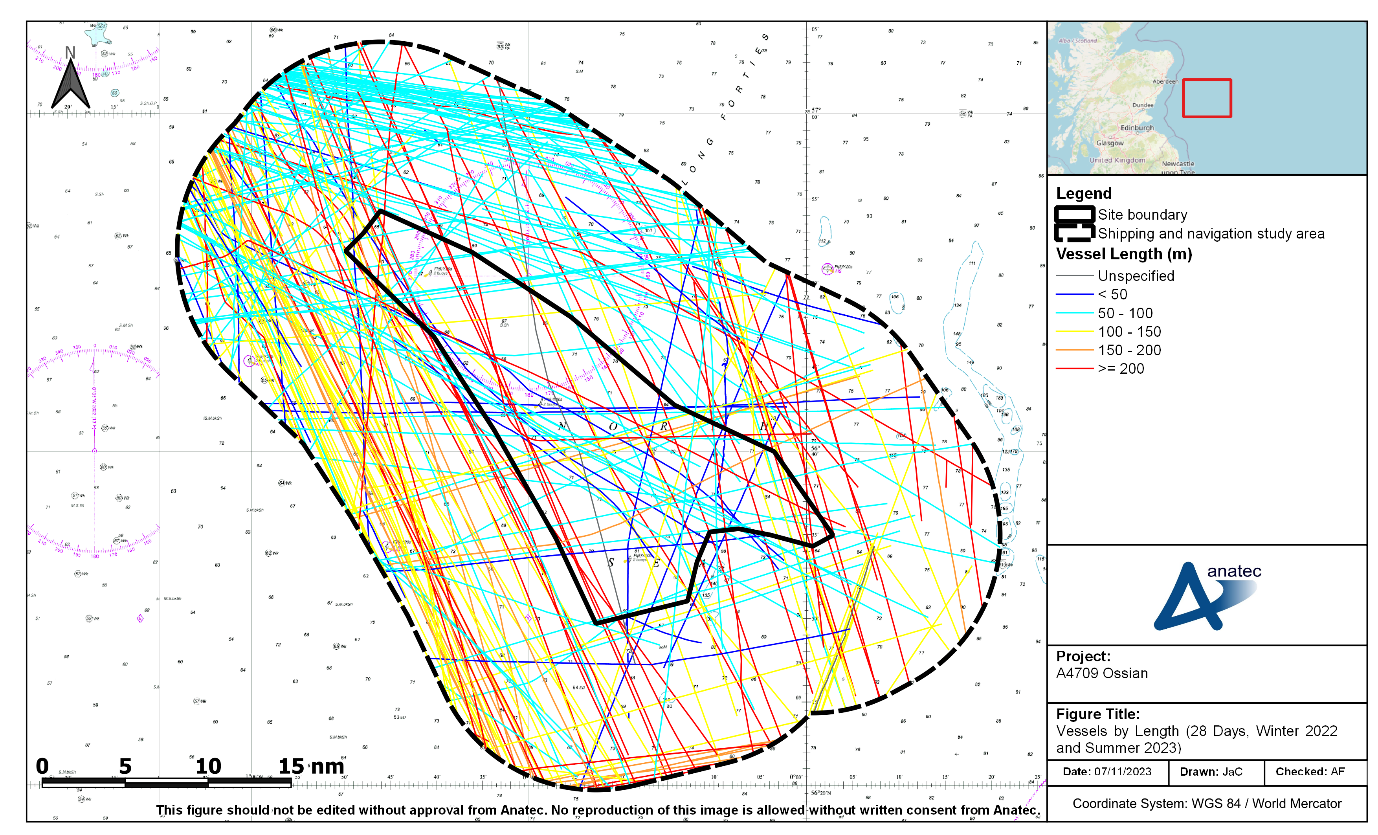
Figure 10.14: Length of Vessels Recorded During the Combined 28-Day Vessel Traffic Survey Period (Winter 2022 and Summer 2023)
- A broad range of vessel lengths was recorded throughout the shipping and navigation study area. Vessels between 50 m and 100 m in length were generally oil and gas vessels in south-east/north-west transit to the north of the site boundary. Vessels between 100 m and 200 m were generally cargo vessels in south-east/north-west transit inshore of the site boundary. The largest vessels (at least 200 m) were generally commercial vessels engaged in south-east/north-west transit throughout the shipping and navigation study area.
- Figure 10.15 presents the distributions of vessel lengths recorded within the shipping and navigation study area during each survey period (excluding less than 1% unspecified).
Figure 10.15: Distribution of Vessel Lengths Recorded During the Combined 28-Day Vessel Traffic Survey Period (Winter 2022 and Summer 2023)
- The most common range of vessel lengths during both survey periods was 50 m to 100 m, accounting for 58% and 38% of the data during the winter period and summer period respectively. The average vessel length was similar during each period; 120 m during the winter and 117 m during the summer. The maximum vessel lengths recorded were 296 m and 306 m during the winter and summer periods, respectively.
10.5.2 Vessel Draught
10.5.2 Vessel Draught
- Figure 10.16 presents the vessels recorded within the shipping and navigation study area during the combined 28-day survey period, colour-coded by vessel draught. Vessel draught was available for approximately 92% of vessel tracks recorded.
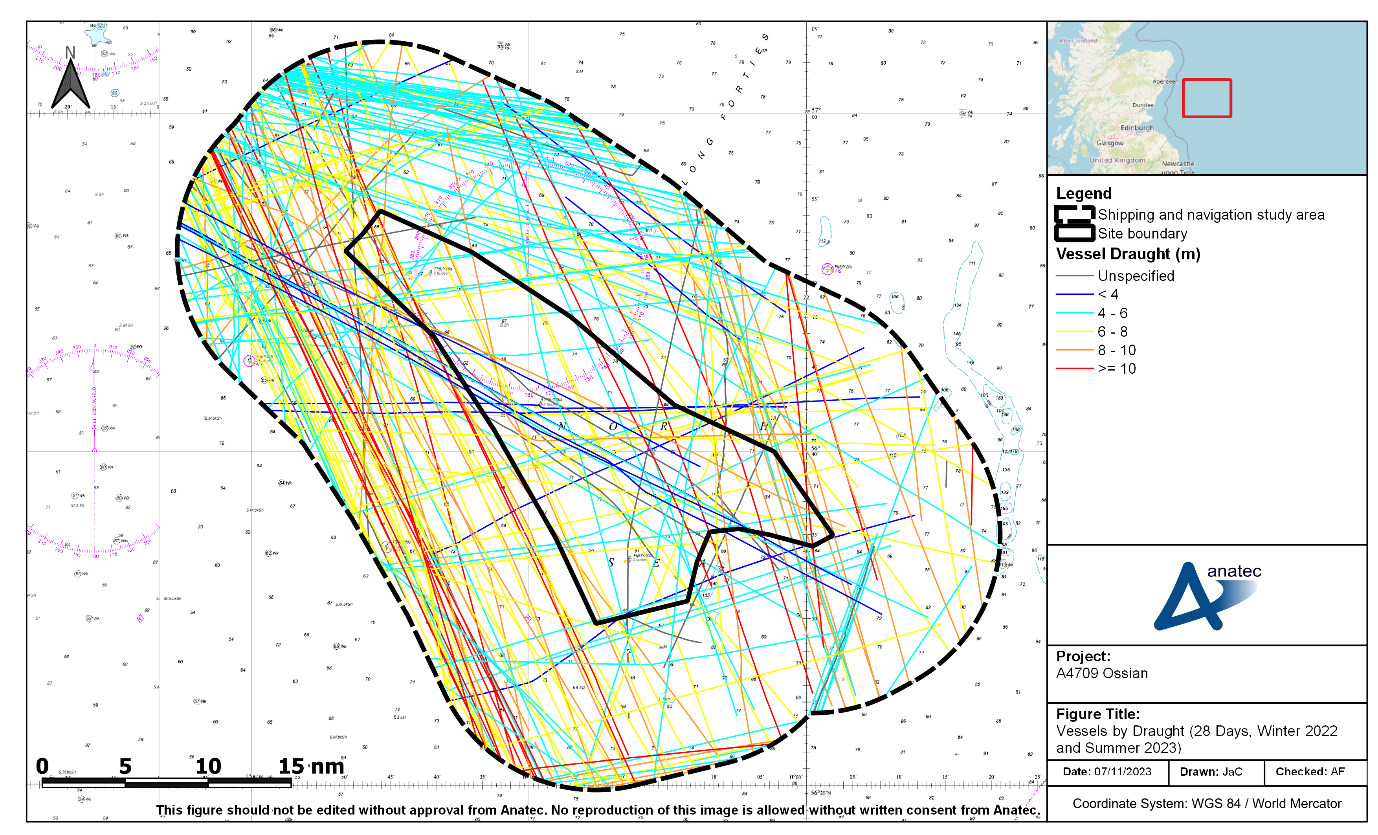
Figure 10.16: Draught of Vessels Recorded During the Combined 28-Day Vessel Traffic Survey Period (Winter 2022 and Summer 2023)
- Similar to vessel lengths, a broad range of draughts were recorded throughout the shipping and navigation study area. Shallower draughts (less than 6 m) were generally in east-south-east/west-north-west transit (to the north of the site boundary in particular) while deeper draughts (at least 6 m) were generally in south-south-east/north-north-west (inshore of the site boundary in particular).
- Figure 10.17 presents the distributions of vessel draughts recorded within the shipping and navigation study area during each survey period (excluding approximately 8% unspecified).
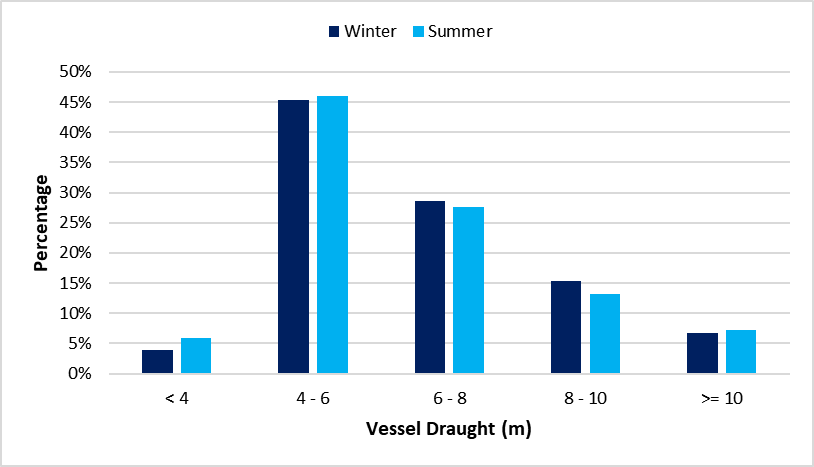
Figure 10.17: Distribution of Vessel Draughts Recorded During the Combined 28-Day Vessel Traffic Survey Period (Winter 2022 and Summer 2023)
- There was broad correlation between each survey period in terms of vessel draughts. The most common draught range was 4 m to 6 m, accounting for 45% and 46% during the winter and summer periods, respectively. The average vessel draught of all vessels recorded during both survey periods was 6.5 m. The deepest vessel draughts recorded were 16.3 m and 14.2 m during the winter and summer survey periods, respectively.
- Additional analysis of vessel draughts, including a breakdown of vessel draughts by vessel type, can be found in section 15.6.
11 Base Case Vessel Routeing
11 Base Case Vessel Routeing
11.1 Definition of a Main Commercial Route
11.1 Definition of a Main Commercial Route
- Main commercial routes within the shipping and navigation study area have been identified using the principles set out in MGN 654 (MCA, 2021). Vessel traffic data are assessed and vessels transiting at similar headings and locations are identified as a main route. To help identify main routes, vessel traffic data can also be interrogated to show vessels (by name and/or operator) that frequently transit those routes. The route width is then calculated using the 90th percentile rule from the median line of the potential shipping route as shown in Figure 11.1.
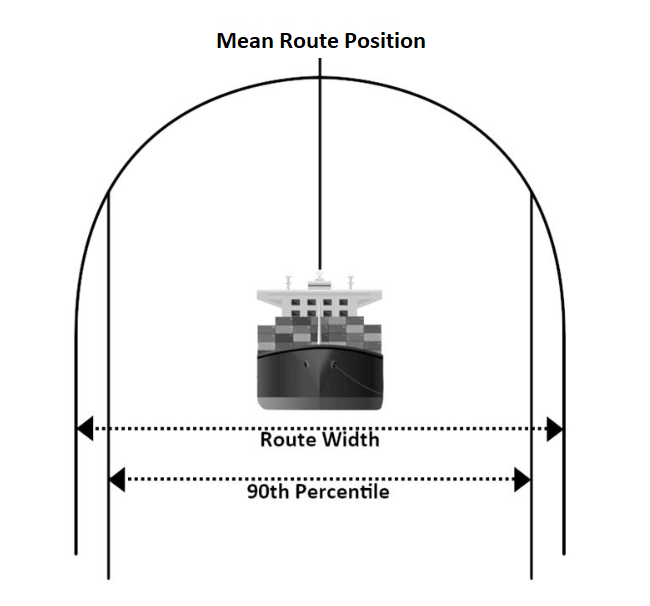
Figure 11.1: Illustration of Main Route Calculation
11.2 Pre Wind Farm Main Commercial Routes
11.2 Pre Wind Farm Main Commercial Routes
- A total of 11 main commercial routes were identified from 12 months of AIS data recorded during 2022 (see Appendix E) within the shipping and navigation study area. These main commercial routes and corresponding 90th percentiles within the shipping and navigation study area are shown relative to the site boundary in Figure 11.2. Following this, a description of each route is provided in Table 11.1, including the average number of vessels per day, start and end locations and main vessel types. It is noted that the start and end locations are based on the most common destinations transmitted via AIS by vessels on those routes.
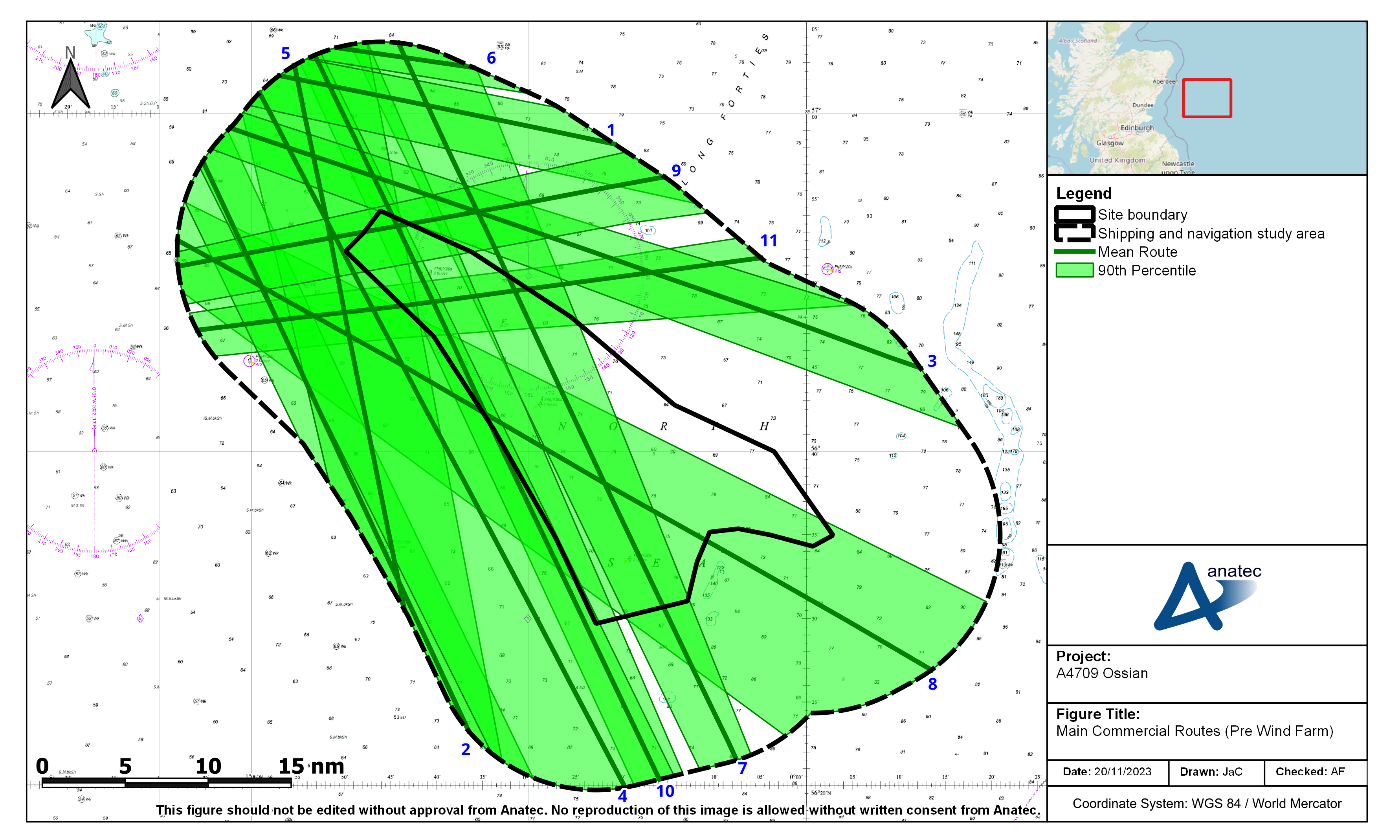
Figure 11.2: Main Commercial Routes Within the Shipping and Navigation Study Area (Pre Wind Farm)
Table 11.1 Descriptions of Main Commercial Routes Within the Shipping and Navigation Study Area
Route Number | Average Vessels per Week | Description |
|---|---|---|
1 | 16 - 17 | Aberdeen (UK) - various oil and gas infrastructure. Primarily undertaken by oil and gas vessels. |
2 | 10 | The Faroe Islands or Iceland – Rotterdam (Netherlands). Primarily undertaken by cargo vessels |
3 | 7 | Aberdeen - various oil and gas infrastructure. Primarily undertaken by oil and gas vessels. |
4 | 6 | Various Icelandic ports - Rotterdam. Primarily undertaken by cargo vessels. |
5 | 2 – 3 | Immingham (UK)/Rotterdam – Glensanda (UK). Primarily undertaken by cargo vessels with a notable proportion of tankers. |
6 | 2 | Aberdeen - various oil and gas infrastructure. Primarily undertaken by oil and gas vessels. |
7 | 1 – 2 | Rotterdam - various ports. Primarily undertaken by cargo vessels. |
8 | 1 – 2 | Aberdeen – various ports. Primarily undertaken by cargo vessels. |
9 | 1 – 2 | Montrose (UK) - various oil and gas infrastructure. Primarily undertaken by oil and gas vessels. |
10 | 1 | Amsterdam (Netherlands) – Glensanda. Primarily undertaken by cargo vessels. |
11 | < 1 | Montrose - various oil and gas infrastructure. Primarily undertaken by oil and gas vessels. |
11.3 Adverse Weather Routeing
11.3 Adverse Weather Routeing
- Some vessels and vessel operators may transit alternative routes during periods of adverse weather. Adverse weather includes wind, wave and tidal conditions as well as reduced visibility due to fog. Adverse weather can hinder a vessel’s standard route, its speed of navigation and/or its ability to enter the destination port. Adverse weather routes are assessed to be significant course adjustments to mitigate vessel motion in adverse weather conditions. When transiting in adverse weather conditions, a vessel is likely to encounter various types of weather and tidal phenomena, which may lead to severe roll motions, potentially causing damage to cargo, equipment and/or discomfort and danger to persons on board. The sensitivity of a vessel to these phenomena will depend on the actual stability parameters, hull geometry, vessel type, vessel size and speed.
11.4 Baseline Data
11.4 Baseline Data
- No specific adverse weather routeing was observed within the baseline data studied, however the long term 12 month AIS analysis (Appendix E) showed a minor weighting towards summer months for cargo vessels, tankers, and oil and gas vessels i.e., a minor increase in numbers was observed during summer. This may indicate that such vessels prefer to pass further inshore, i.e. outside of the shipping and navigation study area in adverse conditions (which may be more likely during winter months). However, a genuine reduction in transits in the shipping and navigation study area due to adverse conditions may also be a factor, as could AIS coverage.
- There is open sea area inshore of the Array (the closest operational wind farm is Seagreen 1 Offshore Wind Farm, located 27 nm inshore as per section 7.3), and therefore the Array is not considered as hindering any preference for inshore routeing in isolation. Cumulatively, if all screened in projects are considered, there will remain sea room available inshore, between Morven Offshore Wind Farm (pre-application) and projects closer to shore including Seagreen 1 Offshore Wind Farm (operational) and Berwick Bank (determination).
11.5 Consultation
11.5 Consultation
- The following key points of relevance to adverse weather were raised during consultation (see section 4):
- Smyril Line stated that vessels would likely not transit through offshore wind farms in adverse weather conditions.
- It was suggested at the Hazard Workshop that vessels would likely seek to make the most direct safe transit possible during adverse weather.
- Wilson Ship Management indicated transit choice through the area would depend on weather conditions, and stated preference for passing inshore.
- This input is considered as broadly aligning with the findings of section 11.4, i.e. vessels are more likely to transit in inshore locations during adverse weather rather than in the vicinity of the Array.
12 Navigation, Communication, and Position Fixing Equipment
12.1 Very High Frequency Communications (Including Digital Selective Calling)
- In 2004, trials were undertaken at the North Hoyle Offshore Wind Farm, located off the coast of North Wales (UK). As part of these trials, tests were undertaken to evaluate the operational use of typical small vessel VHF transceivers (including Digital Selective Calling (DSC)) when operated close to wind turbines.
- The wind turbines had no noticeable effect on voice communications within the North Hoyle array area or ashore. It was noted that if small craft vessel-to-vessel and vessel-to-shore communications were not affected significantly by the presence of wind turbines, then it is reasonable to assume that larger vessels with higher powered and more efficient systems would also be unaffected.
- During this trial, a number of telephone calls were made from ashore, both within and offshore of the North Hoyle array area. No effects on the telephone calls were recorded using any system provider (MCA and QinetiQ, 2004).
- Furthermore, as part of SAR trials carried out at the North Hoyle Offshore Wind Farm in 2005, radio checks were undertaken between the Sea King helicopter and both Holyhead and Liverpool Coastguards. The aircraft was positioned offshore of the North Hoyle array area and communications were reported as very clear, with no apparent degradation of performance. Communications with the service vessel located within the North Hoyle array area were also fully satisfactory throughout the trial (MCA, 2005).
- In addition to the North Hoyle Offshore Wind Farm trials, a desk-based study was undertaken for the Horns Rev 3 Offshore Wind Farm in Denmark in 2014 and it was concluded that there were not expected to be any conflicts between point-to-point radio communications networks and no interference upon VHF communications (Energinet, 2014).
- Following consideration of these reports and noting that since the trials detailed above there have been no significant issues with regards to VHF observed or reported, the presence of the Array is anticipated to have no significant impact upon VHF communications.
12.2 Very High Frequency Direction Finding
12.2 Very High Frequency Direction Finding
- During the North Hoyle Offshore Wind Farm trials in 2004, the VHF Direction Finding (DF) equipment carried in the trial boats did not function correctly when very close to wind turbines (within approximately 50 m). This is deemed to be a relatively small-scale impact due to the limited use of VHF direction finding equipment and will not impact operational or SAR activities (MCA and QinetiQ, 2004).
- Throughout the 2005 SAR trials carried out at the North Hoyle Offshore Wind Farm, the Sea King radio homer system was tested. The Sea King radio homer system utilises the lateral displacement of a vertical bar on an instrument to indicate the sense of a target relative to the aircraft heading. With the aircraft and the target vessel within the North Hoyle array area, at a range of approximately 1 nm, the homer system operated as expected with no apparent degradation.
- Since the trials detailed above, no significant issues with regards to VHF DF have been observed or reported, and therefore the presence of the Array is anticipated to have no significant impact upon VHF DF equipment.
12.3 Automatic Identification System
12.3 Automatic Identification System
- No significant issues with interference to AIS transmission from operational offshore wind farms have been observed or reported to date. Such interference was also absent in the trials carried out at the North Hoyle Offshore Wind Farm (MCA and QinetiQ, 2004).
- In theory there could be interference when there is a structure located between the transmitting and receiving antennas (i.e. blocking line of sight) of the AIS. However, given no issues have been reported to date at operational developments or during trials, no significant impact is anticipated due to the presence of the Array.
12.4 Navigational Telex System
12.5 Global Positioning System
- Global Positioning System (GPS) is a satellite based navigational system. GPS trials were also undertaken throughout the 2004 trials at North Hoyle Offshore Wind Farm and it was stated that “no problems with basic GPS reception or positional accuracy were reported during the trials” (MCA and QinetiQ, 2004).
- The additional tests showed that “even with a very close proximity of a wind turbine to the GPS antenna, there were always enough satellites elsewhere in the sky to cover for any that might be shadowed by the wind turbine tower” (MCA and QinetiQ, 2004).
- Therefore, there are not expected to be any significant impacts associated with the use of GPS systems within or in proximity to the Array, noting that there have been no reported issues relating to GPS within or in proximity to any operational offshore wind farms to date.
12.6 Electromagnetic Interference
12.6 Electromagnetic Interference
- A compass, magnetic compass or mariner's compass is a navigational instrument for determining direction relative to the Earth's magnetic poles. It consists of a magnetised pointer (usually marked on the north end) free to align itself with the Earth's magnetic field. A compass can be used to calculate heading, used with a sextant to calculate latitude, and with a marine chronometer to calculate longitude.
- Like any magnetic device, compasses are affected by nearby ferrous materials as well as by strong local electromagnetic forces, such as magnetic fields emitted from power cables. As the compass still serves as an essential means of navigation in the event of power loss or as a secondary source, it is important that potential impacts from EMF are reduced to ensure continued safe navigation.
- The vast majority of commercial traffic uses non-magnetic gyrocompasses as the primary means of navigation, which are unaffected by EMF. Therefore, it is considered highly unlikely that any interference from EMF as a result of the presence the Array will have a significant impact on vessel navigation. However, some smaller craft (fishing or leisure) may rely on it as their sole means of navigation (this is considered further in section 12.6.1).
12.6.1 Subsea Cables
12.6.1 Subsea Cables
- As per section 6.3, there will be inter-array cables and interconnector cables within the Array. The inter-array cables will be High Voltage (HV) Alternating Current (AC), while the interconnector cables will be HVAC and /or HV Direct Current (DC). Studies indicate that HVAC does not emit an EMF significant enough to impact marine magnetic compasses (Convention for the Protection of the Marine Environment of the North-East Atlantic (OSPAR), 2008).
- With regards to potential use of HVDC interconnector cables, the following key points are noted:
- Minimum water depths within the site boundary are in excess of 60 m, with vertical distance decreasing any EMF impacts.
- It is considered unlikely that vessels this far offshore would be relying purely on a magnetic compass.
- Input from the MCA during consultation confirmed that there is likely to be less concern with the HVDC interconnectors within the Array (see section 4) given water depths.
- On this basis, electromagnetic interference associated with shipping and navigation due to cables associated with the Array are not considered any further. Any associated effects from the Proposed offshore export cable(s) will be considered within a separate NRA.
12.6.2 Wind Turbine Generators
12.6.2 Wind Turbine Generators
- MGN 654 (MCA, 2021) notes that small vessels with simple magnetic steering and hand bearing compasses should be wary of using these close to wind turbines, as with any structure in which there is a large amount of ferrous material (MCA and QinetiQ, 2004). Potential effects are deemed to be within acceptable levels when considered alongside other mitigation such as the mariner being able to make visual observations (not wholly reliant on the magnetic compass), lighting, sound signals and identification marking in line with MGN 654 (MCA, 2021), noting lighting and marking will be agreed with NLB. As per section 12.6.1, it is considered very unlikely that vessels this far offshore would be relying purely on a magnetic compass.
12.6.3 Experience of Operational Wind Farms
12.6.3 Experience of Operational Wind Farms
- No issues with respect to magnetic compasses have been reported to date in any of the North Hoyle Offshore Wind Farm trials (MCA and QinetiQ, 2004) undertaken (inclusive of SAR helicopters) nor in any published reports from operational offshore wind farms in the UK.
12.7 Marine Radar
12.7 Marine Radar
- This section summarises the results of trials and studies undertaken in relation to Radar effects from offshore wind farms in the UK. It is important to note that since the time of the trials and studies discussed, wind turbine technology has advanced significantly, most notably in terms of the size of wind turbines available to be installed and utilised. The use of these larger wind turbines allows for a greater spacing between wind turbines than was achievable at the time of the studies being undertaken, which is beneficial in terms of Radar interference effects (and surface navigation in general) as detailed below.
12.7.1 Trials
12.7.1 Trials
- During the early years of offshore renewables within the UK, maritime regulators undertook a number of trials (both shore-based and vessel-based) into the effects of wind turbines on the use and effectiveness of marine Radar.
- In 2004 trials undertaken at the North Hoyle Offshore Wind Farm (MCA and QinetiQ, 2004) identified areas of concern regarding the potential impact on marine- and shore-based Radar systems due to the large vertical extents of the wind turbines (based on the technology at that time). This resulted in Radar responses strong enough to produce interfering side lobes and reflected echoes (often referred to as false targets or ghosts).
- Side lobe patterns are produced by small amounts of energy from the transmitted pulses that are radiated outside of the narrow main beam. The effects of side lobes are most noticeable within targets at short range (below 1.5 nm) and with large objects. Side lobe echoes form either an arc on the Radar screen similar to range rings, or a series of echoes forming a broken arc, as illustrated in Figure 12.1.
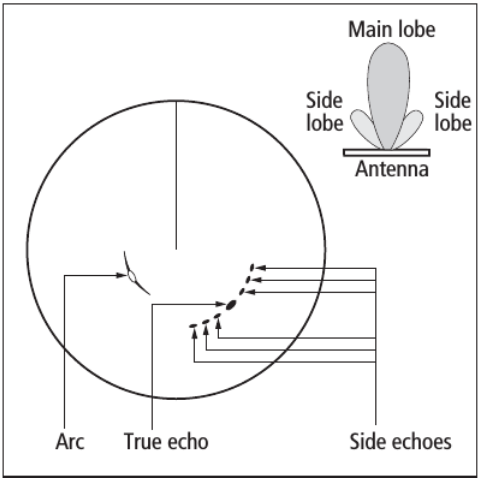
Figure 12.1: Illustration of Side Lobes on Radar Screen
- Multiple reflected echoes are returned from a real target by reflection from some object in the Radar beam. Indirect echoes or ‘ghost’ images have the appearance of true echoes but are usually intermittent or poorly defined; such echoes appear at a false bearing and false range, as illustrated in Figure 12.2.
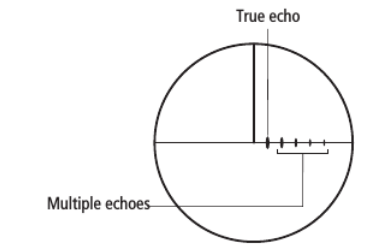
Figure 12.2: Illustration of Multiple Reflected Echoes on Radar Screen
- Based on the results of the North Hoyle Offshore Wind Farm trials, the MCA produced a Shipping Route Template designed to give guidance to mariners on the distances which should be established between shipping routes and offshore wind farms. However, as experience of effects associated with use of marine Radar in proximity to offshore wind farms grew, the MCA refined their guidance, offering more flexibility within the most recent Shipping Route Template contained within MGN 654 (MCA, 2021).
- A second set of trials conducted at Kentish Flats Offshore Wind Farm in 2006 on behalf of the British Wind Energy Association (BWEA) – now called RenewableUK (BWEA, 2007) – also found that Radar antennas which are sited unfavourably with respect to components of the vessel’s structure can exacerbate effects such as side lobes and reflected echoes. Careful adjustment of Radar controls suppressed these spurious Radar returns but mariners were warned that there is a consequent risk of losing targets with a small Radar cross section, which may include buoys or small craft, particularly yachts or Glass Reinforced Plastic (GRP) constructed craft; therefore, due care should be taken in making such adjustments.
- Theoretical modelling of the effects of the development of the proposed Atlantic Array Offshore Wind Farm, which was to be located off the south coast of Wales, on marine Radar systems was undertaken by the Atlantic Array project (Atlantic Array, 2012) and considered a wider spacing of wind turbines than that considered within the early trials[6]. The main outcomes of the modelling were the following:
- Multiple and indirect echoes were detected under all modelled parameters.
- The main effects noticed were stretching of targets in azimuth (horizontal) and appearance of ghost targets.
- There was a significant amount of clear space amongst the returns to ensure recognition of vessels moving amongst the wind turbines and safe navigation.
- Even in the worst case with Radar operator settings artificially set to be poor, there is significant clear space around each wind turbine that does not contain any multipath or side lobe ambiguities to ensure safe navigation and allow differentiation between false and real (both static and moving) targets.
- Overall it was concluded that the amount of shadowing observed was very little (noting that the model considered lattice-type foundations which are sufficiently sparse to allow Radar energy to pass through).
- The lower the density of wind turbines, the easier it is to interpret the Radar returns and fewer multipath ambiguities are present.
- In dense, target rich environments S-Band Radar scanners suffer more severely from multipath effects in comparison to X-Band Radar scanners.
- It is important for passing vessels to keep a reasonable separation distance between the wind turbines in order to minimise the effect of multipath and other ambiguities.
- The Atlantic Array study undertaken in 2012 noted that the potential for Radar interference was mainly a problem during periods of reduced visibility when mariners may not be able to visually confirm the presence of other vessels in proximity (those without AIS installed which are usually fishing and recreational craft). It is noted that this situation would arise with or without wind turbines in place.
- There is potential for the performance of a vessel’s ARPA to be affected when tracking targets in or near the array. Although greater vigilance is required, during the Kentish Flats Offshore Wind Farm trials it was shown that false targets were quickly identified as such by the mariners and then by the equipment itself.
- In summary, experience in UK waters has shown that mariners have become increasingly aware of any Radar effects as more offshore wind farms become operational. Based on this experience, the mariner can interpret the effects correctly, noting that effects are the same as those experienced by mariners in other environments such as in close proximity to other vessels or structures. Effects can be effectively mitigated by “careful adjustment of Radar controls” (MCA, 2022).
- The MCA has also produced guidance to mariners operating in proximity to OREIs in the UK which highlights Radar issues amongst others to be taken into account when planning and undertaking voyages in proximity to OREIs (MCA, 2022). The interference buffers presented in Table 12.1 are based on MGN 654 (MCA, 2021), MGN 371 (MCA, 2008a), MGN 543 (MCA, 2016), MGN 372 Amendment 1 (MCA, 2022) and MGN 372 (MCA, 2008b).
Table 12.1: Distances at Which Impacts on Marine Radar Occur
Distance at Which Effect Occurs (nm) | Identified Effects |
|---|---|
0.5 |
|
1.5 |
|
- As noted in Table 12.1, the onset range from the wind turbines of false returns is approximately 1.5 nm, with progressive deterioration in the Radar display as the range closes. If interfering echoes develop, the requirements of the Convention on International Regulations for Preventing Collisions at Sea (COLREGs) ‘Rule 6 Safe Speed’ are particularly applicable and must be observed with due regard to the prevailing circumstances (IMO, 1972/77). In restricted visibility, ‘Rule 19 Conduct of Vessels in Restricted Visibility’ applies and compliance with ‘Rule 6’ becomes especially relevant. In such conditions mariners are required, under ‘Rule 5 Look-out’ to take into account information from other sources which may include sound signals and VHF information, for example from a VTS or AIS (MCA, 2016)
12.7.2 Experience From Operational Offshore Wind Developments
12.7.2 Experience From Operational Offshore Wind Developments
- The evidence from mariners operating in proximity to existing operational offshore wind farms is that they quickly learn to adapt to any effects. Figure 12.3 presents the example of the Galloper and Greater Gabbard Offshore Wind Farms, which are located in proximity to IMO routeing measures. Despite this proximity to heavily trafficked Traffic Separation Scheme (TSS) lanes, there have been no reported incidents or issues raised by mariners who operate within the vicinity. The interference buffers presented in Figure 12.3 are as per Table 12.1.
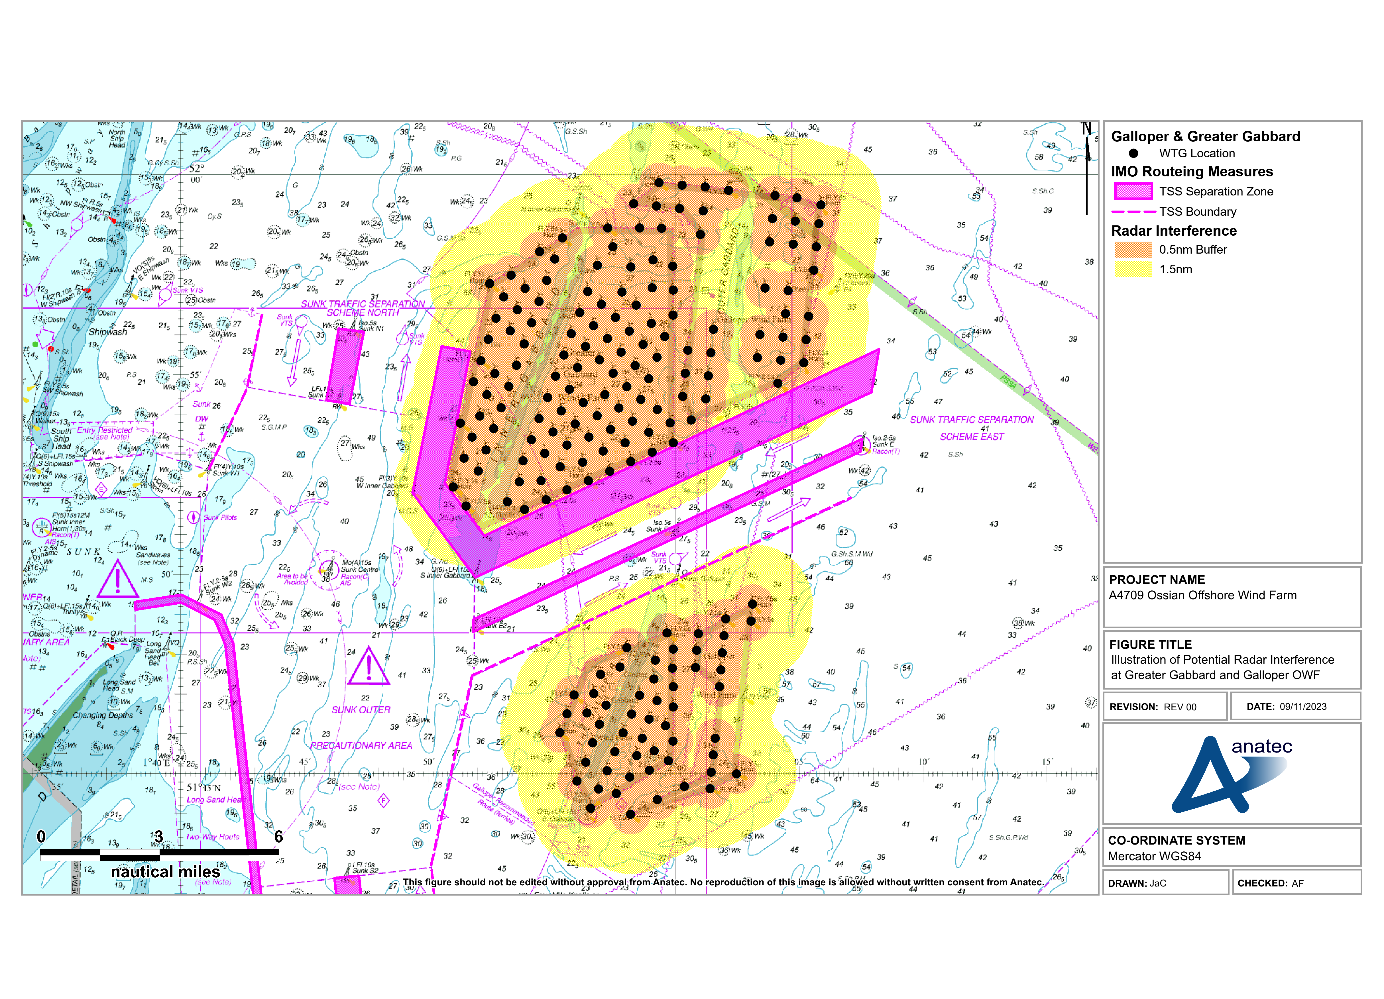
Figure 12.3: Illustration of Potential Radar Interference at Greater Gabbard and Galloper Offshore Wind Farms
- As indicated by Figure 12.3, vessels utilising these TSS lanes will experience some Radar interference based on the available guidance. Both developments are operational, and each of the lanes is used by a minimum of five vessels per day on average. However, to date, there have been no incidents recorded (including any related to Radar use) or concerns raised by the users.
- AIS information can also be used to verify the targets of larger vessels (generally vessels over 15 m LOA – the minimum threshold for fishing vessel AIS carriage requirements). Approximately 2% of the vessel traffic recorded within the shipping and navigation study area during the vessel traffic surveys was under 15 m LOA, with over 99% of recorded vessels being recorded on AIS.
- For any smaller vessels, particularly fishing vessels and recreational vessels, AIS Class B devices are becoming increasingly popular and allow the position of these small craft to be verified when in proximity to an offshore wind farm.
12.7.3 Increased Radar Returns
12.7.3 Increased Radar Returns
- Beam width is the angular width, horizontal or vertical, of the path taken by the Radar pulse. Horizontal beam width ranges from 0.75° to 5°, and vertical beam width from 20° to 25°. How well an object reflects energy back towards the Radar depends upon its size, shape and aspect angle.
- Larger wind turbines (either in height or width) will return greater target sizes and/or stronger false targets. However, there is a limit to which the vertical beam width would be affected (20° to 25°) dependent upon the distance from the target. Therefore, increased wind turbine height in the Array will likely not create any greater effects to those already identified from existing operational wind farms (i.e. interfering side lobes, multiple and reflected echoes).
- Again, when taking into consideration the potential options available to marine users (such as reducing gain to remove false returns) and feedback from operational experience, this shows that the effects of increased returns can be managed effectively, to within acceptable parameters.
12.7.4 Fixed Radar Antenna Use in Proximity to an Operational Wind Farm
12.7.4 Fixed Radar Antenna Use in Proximity to an Operational Wind Farm
- It is noted that there are multiple operational wind farms, including Galloper, that successfully operate fixed Radar antenna from locations on the periphery of the array. These antennas are able to provide accurate and useful information to onshore coordination centres.
12.7.5 Application to the Array
12.7.5 Application to the Array
- Upon development of the Array, some commercial vessels may pass within 1.5 nm of the wind farm structures and therefore may be subject to a minor level of Radar interference. Trials, modelling and experience from existing developments note that any impact can be mitigated by adjustment of Radar controls.
- Figure 12.4 presents an illustration of potential Radar interference due to the Array relative to the post wind farm routeing illustrated in section 13.4.2. The Radar effects have been applied to the indicative Array layout introduced in section 6.2.1.
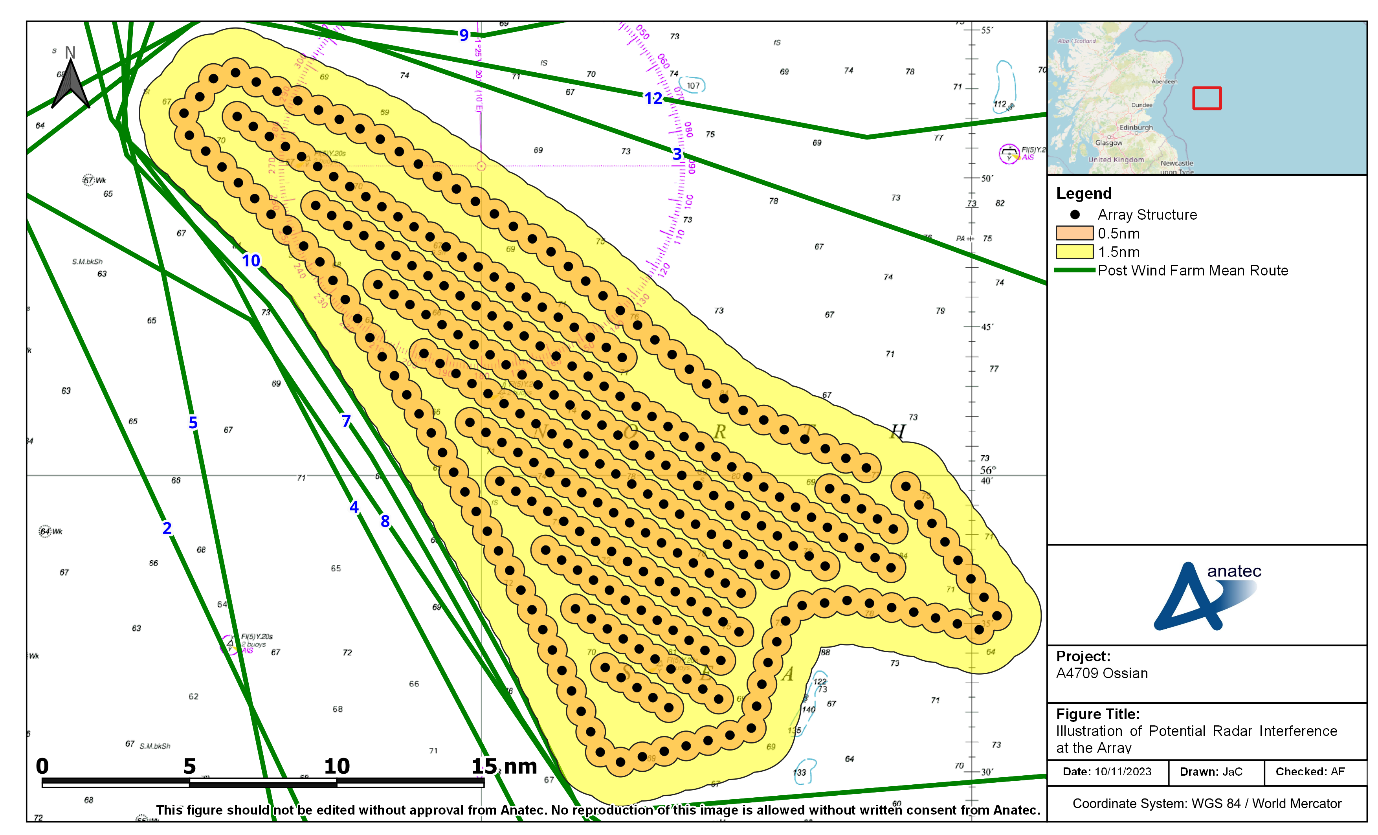
Figure 12.4 : Illustration of Potential Radar Interference at the Array
- Vessels passing within the Array will be subject to a greater level of interference with impacts becoming more substantial in close proximity to wind turbines. This will require additional mitigation by any vessels, including consideration of the navigational conditions (visibility) when passage planning and compliance with the COLREGs (IMO, 1972/77) will be essential.
- Overall, the impact on marine Radar is expected to be low based on operational experience of other wind farms and the available sea room around the Array, and no further impact upon navigational safety is anticipated outside the parameters which can be mitigated by operational controls.
12.8 Sound Navigation Ranging System
12.9 Noise
- No evidence has been found to date with regard to existing offshore wind farms to suggest that prescribed sound signals are in any way impacted by acoustic noise produced by the wind farm, and so no impact is anticipated from the presence of the Array.
12.10 Summary of Potential Effects on Use
12.10 Summary of Potential Effects on Use
- Based on the detailed technical assessment of the effects due to the presence of the Array on navigation, communication and position fixing equipment in the previous subsections, Table 12.2 summarises the assessment of frequency and consequence and the resulting risk for each component of this impact.
Table 12.2: Summary of Risk to Navigation, Communication and Position Fixing Equipment
Topic | Frequency | Consequence | Significance of Risk |
|---|---|---|---|
VHF | Negligible | Minor | Broadly Acceptable |
VHF direction finding | Extremely Unlikely | Minor | Broadly Acceptable |
AIS | Negligible | Minor | Broadly Acceptable |
NAVTEX | Negligible | Minor | Broadly Acceptable |
GPS | Negligible | Minor | Broadly Acceptable |
EMF | Extremely Unlikely | Negligible | Broadly Acceptable |
Marine Radar | Remote | Minor | Broadly Acceptable |
SONAR | Negligible | Minor | Broadly Acceptable |
Noise | Negligible | Minor | Broadly Acceptable |
- On the basis of these findings, associated risks are screened out of the risk assessment undertaken in section 16.
13 Future Case Vessel Traffic
13 Future Case Vessel Traffic
- The characterisation of vessel traffic established in the baseline is used as an input to the risk assessment (see section 14). However, it is also necessary to consider potential future case vessel traffic, in terms of general volume and size changes, port developments which may influence movements, and changes to movements associated with the presence of the Array (the ‘post wind farm’ scenario).
- The following subsections provide details of high-level future case scenarios which have been used to inform the risk assessment.
13.1 Increases in Commercial Vessel Activity
13.1 Increases in Commercial Vessel Activity
- There is uncertainty associated with long-term predictions of vessel traffic growth, including the potential for any other new developments in UK or transboundary ports and the long-term impacts of Brexit on shipping.
- Therefore, two independent scenarios of potential growth in commercial vessel movements of 10% and 20% have been estimated throughout the lifetime of the Array. These are standard values for similar assessments, and were presented to attendees at the Hazard Workshop.
13.2 Increases in Commercial Fishing Vessel and Recreational Vessel Activity
13.2 Increases in Commercial Fishing Vessel and Recreational Vessel Activity
- There is similar uncertainty associated with long-term predictions for commercial fishing vessel and recreational vessel transits given the limited reliable information on future trends upon which any firm assumption could be made. There are no known major developments which would increase commercial fishing or recreational vessel activity in the local region, i.e. in the vicinity of the shipping and navigation study area.
- Therefore, a conservative potential growth in commercial fishing vessel and recreational vessel movements of 10% and 20% has been estimated throughout the lifetime of the Array. These are standard values for other similar assessments and were presented to attendees at the Hazard Workshop.
13.3 Increase in Traffic Associated with Array Activities
13.3 Increase in Traffic Associated with Array Activities
- During the construction phase, up to 7,902 return trips will be made by vessels involved in the installation of the Array (see section 6.5.1) including site preparation. During the operation and maintenance phase, up to 508 return trips per year will be made by vessels involved in the operation and maintenance of the Array (see section 6.5.2).
13.4 Commercial Traffic Routeing (Array in Isolation)
13.4 Commercial Traffic Routeing (Array in Isolation)
13.4.1 Methodology
13.4.1 Methodology
- It is not possible to consider all potential alternative routeing options for commercial traffic and therefore worst-case alternatives have been considered where possible in consultation with operators. Assumptions for re-routeing include:
- all alternative routes maintain a minimum mean distance of 1 nm from offshore installations and existing offshore wind farm boundaries in line with industry experience. This distance is considered for shipping and navigation from a safety perspective as explained below; and
- all mean routes take into account sandbanks, aids to navigation and known routeing preferences.
- Additionally, some routes which pass at a mean distance greater than 1 nm are sufficiently wide that there may be some interaction with the offshore wind farm boundaries (within the 90th percentile range). In such instances, the width of the route has been reduced. This is a conservative approach as a narrower route leads to greater collision risk.
- Annex 2 of MGN 654 defines a methodology for assessing passing distance from offshore wind farm boundaries (the Shipping Route Template) but states that it is “not a prescriptive tool but needs intelligent application” (MCA, 2021).
- To date, internal and external studies undertaken by Anatec on behalf of the UK Government and individual clients (Anatec, 2016) show that vessels do pass consistently and safely within 1 nm of established offshore wind farms (including between distinct developments) and these distances vary depending upon the sea room available as well as the prevailing conditions. This evidence also demonstrates that the mariner defines their own safe passing distance based upon the conditions and nature of the traffic at the time, but they are shown to frequently pass 1 nm off established developments.
- Evidence also demonstrates that commercial vessels do not transit through offshore wind farm arrays. It is noted that during consultation (see section 4), Regular Operators stated that they may consider passing through the Array; however, it was also stated that this would depend on factors including the spacing between structures, the depths and positions of structures, weather conditions, currents and traffic density. On this basis, it has still been assumed for the purposes of the NRA modelling that all commercial vessels on the main routes identified will deviate.
- The NRA also aims to establish the MDS based on navigational safety parameters, and when considering this the most conservative realistic scenario for vessel routeing is considered to be when main commercial routes pass 1 nm off developments. Evidence collected during numerous assessments at an industry level (e.g. Anatec, 2016) confirms that it is a safe and reasonable distance for vessels to pass; however, it is likely that a large number of vessels would instead choose to pass at a greater distance depending upon their own passage plan and the current conditions.
13.4.2 Main Commercial Route Deviations
13.4.2 Main Commercial Route Deviations
- An illustration of the anticipated worst-case shift in the mean positions of the main commercial routes within the shipping and navigation study area following the development of the Array is presented in Figure 13.1. These deviations are based on Anatec’s assessment of the MDS including the indicative array layout presented in section 6.2.1.
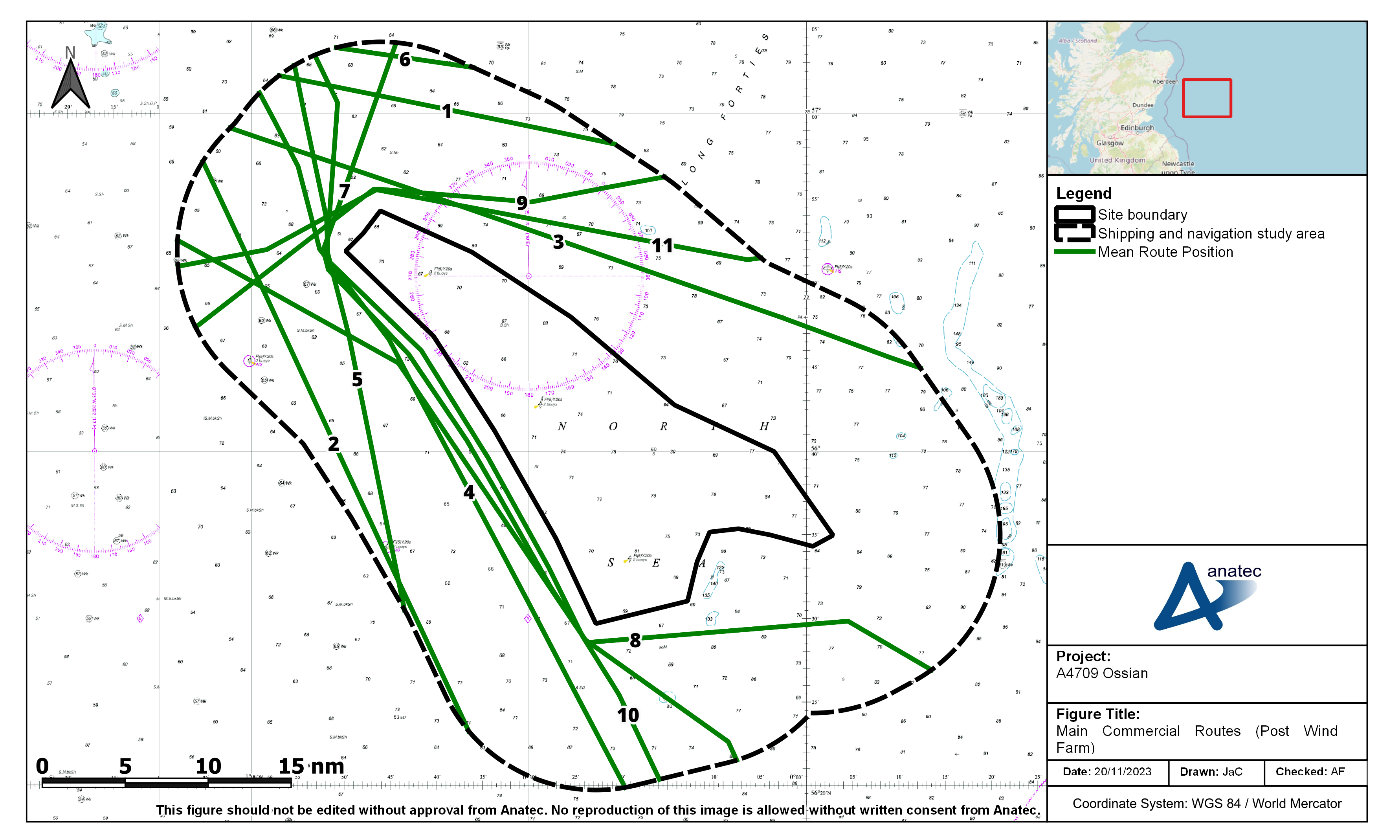
Figure 13.1: Anticipated Deviations of Main Commercial Routes (Post Wind Farm)
- Deviations from the pre wind farm scenario (current baseline) would be required for seven out of the 11 main commercial routes identified, with the level of deviation varying between an increase of 5.7 nm for Route 7 and an increase of less than 0.1 nm for Route 5. For the displaced routes, the increase in distance from the pre wind farm scenario (current baseline) is presented in Table 13.1.
Table 13.1: Summary of Main Commercial Route Deviations Post Wind Farm
Route Number | Average Vessels per Week | Change in Route Length (nm) |
|---|---|---|
4 | 6 | 0.2 |
5 | 2 – 3 | < 0.1 |
7 | 1 – 2 | 5.7 |
8 | 1 – 2 | 4.9 |
9 | 1 – 2 | 0.7 |
10 | 1 | 1.8 |
11 | < 1 | 3.0 |
14 Cumulative and Transboundary Overview
14 Cumulative and Transboundary Overview
14.1 Cumulative Tiering
14.1 Cumulative Tiering
- The methodology set out in section 3.3 has been used to allocate each cumulative development within 50 nm into a cumulative tier. A summary of this process is provided in Table 14.1.
Table 14.1: Cumulative Tiering Summary
Offshore Wind Farm Development | Distance to Array (nm) | Status | Tier | Data Confidence | Rationale |
|---|---|---|---|---|---|
Morven | 3.1 | Scoped | 1 | Medium | Raised during consultation and potential interaction with routes impacted by the Array |
Bellrock | 4.7 | Pre-Scoping | 1 | Low | Raised during consultation and potential interaction with routes impacted by the Array |
Bowdun | 13.7 | Pre-Scoping | 1 | Low | Raised during consultation and potential interaction with routes impacted by the Array |
Campion | 23.8 | Pre-Scoping | 3 | Low | Low data confidence |
Seagreen 1 | 27.3 | Under construction | Baseline | High | Baseline |
Muir Mhor | 27.7 | Scoped | 2 | Medium | No interaction with routes impacted by Ossian |
Cedar (INTOG) | 27.8 | Pre-Scoping | 3 | Low | Low data confidence |
Berwick Bank | 30.6 | Application Submitted | 2 | Medium | No interaction with routes impacted by Ossian |
Kincardine | 33.2 | Operational | Baseline | High | Baseline |
Seagreen 1A Project | 35.7 | Consented | 2 | High | No interaction with routes impacted by Ossian |
Flora Floating Offshore Wind Farm (INTOG) | 36.9 | Pre-Scoping | 3 | Low | Low data confidence |
Hywind | 38.8 | Operational | Baseline | High | Baseline |
European Offshore Wind Deployment Centre | 42.7 | Operational | Baseline | High | Baseline |
Salamander (INTOG) | 42.8 | Scoped | 1 | Medium | Potential interaction with routes impacted by the Array |
Aspen (INTOG) | 46.1 | Pre-Scoping | 3 | Low | Low data confidence |
Inch Cape | 46.8 | Consented | 2 | High | No interaction with routes impacted by Ossian |
Cenos (INTOG) | 49.3 | Scoped | 2 | Medium | No interaction with routes impacted by Ossian |
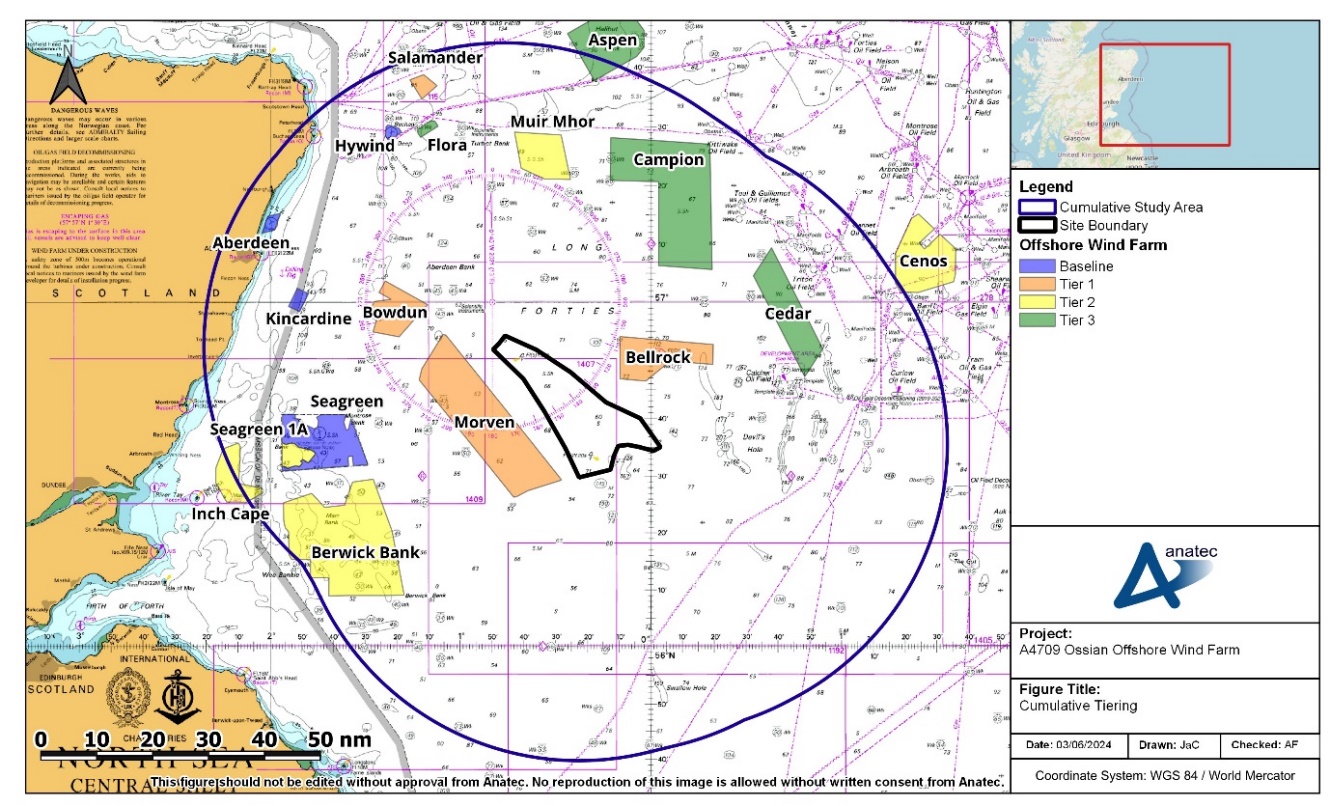
Figure 14.1: Cumulative Developments by Tier Within the Shipping and Navigation Cumulative Study Area
14.2 Cumulative Routeing
14.2 Cumulative Routeing
- Consideration has been given to vessel routeing on a cumulative basis. Anatec’s ShipRoutes database and the baseline data have been used to estimate which main routes (as defined and detailed in section 11.2) may need to deviate to avoid screened‑in cumulative developments. Table 14.2 presents a breakdown of which of these routes intersect 1 nm buffers of these developments (developments not shown did not have any route intersections).
Table 14.2: Cumulative Routeing Interactions (only includes developments with routeing interactions)
Route ID | Ossian | Morven | Bellrock | Bowdun | Salamander | Cedar | Flora |
|---|---|---|---|---|---|---|---|
1 |
|
|
|
|
| |
|
2 |
| |
|
|
|
|
|
3 |
|
| | |
|
|
|
4 | | |
|
|
|
|
|
5 | | |
|
| |
| |
6 |
|
|
|
|
| |
|
7 | |
|
|
| |
| |
8 | | |
| |
|
|
|
9 | | |
|
|
| |
|
10 | |
|
|
|
|
|
|
11 | | | |
|
| |
|
- The following subsections provide a broad indication of the routeing options available to vessels in the area and the deviations that may be undertaken by each of the main routes previously defined, noting consideration has been given to the input received from key stakeholders and vessel operators (full details are provided in Section 4).
- There would be no restrictions on entry into the Array or the sea areas between the Array and other nearby developments and certain vessels may therefore choose to transit through such areas or the Array. However, the NRA process and consultation has indicated that the most likely routeing options between developments are as follows:
- Between Seagreen 1 and Morven Offshore Wind Farms: in excess of 10 nm of sea room is available, and therefore north / south traffic may use this area, noting it is considered the most likely routeing option for north/south traffic based on consultation.
- Between Ossian and Bellrock Offshore Wind Farms: the minimum width between these developments is 4.7 nm, which exceeds the minimum distance that would be required under the MGN 654 (MCA, 2021) corridor guidance[7]. General consensus at the hazard workshop was that the available space was sufficient to safely accommodate likely vessel users.
- Between Bellrock and Campion Offshore Wind Farms: in excess of 12 nm of sea room is available, and therefore east / west traffic including associated with Aberdeen may use this area. Tidewater (who operate oil and gas vessels from Aberdeen) indicated they may use this area during consultation.
14.2.1 North/South Routeing
14.2.1 North/South Routeing
- For the purposes of cumulative routeing consideration, Figure 14.2 presents the base case north/south routes extended to 50 nm of the Array alongside the cumulative developments. Also labelled on Figure 14.2 are potential entry/exit points within this 50 nm buffer for each of the routes (marked as “A”, “B”, and “C” in Figure 14.2).

Figure 14.2: North/South Routeing (50 nm Buffer)
14.2.1.1 Inshore Routeing
- Vessels that choose to pass inshore of the Array are considered likely to enter the 50 nm buffer at point A (Figure 14.2), passing inshore of Salamander, Flora, Hywind, Bowdun and Morven Offshore Wind Farms, noting that this routeing option provides large open areas of sea room in between cumulative project arrays within the cumulative study area.
- It is considered likely that the majority of vessels on broadly north/south transits will choose this passage on the basis that:
- Consultation input including at the Hazard Workshop indicates that commercial vessels are likely to prefer to pass in open sea room rather than between or in proximity to wind farm arrays. This aligns with specific cumulative consultation undertaken with the MCA and NLB (see Section 4).
- The open sea room means that vessels will be able to passage plan with minimal waypoints on their transits.
- Overall percentage increases in deviations are low when compared to the route lengths as a whole (the busiest route [Route 2] is approximately 700 nm in total length, with the inshore deviation leading to an estimated increase of less than 1%).
14.2.1.2 Offshore Routeing
- Vessels that choose to pass offshore of the Array are considered likely to enter at point B, passing offshore of Salamander Offshore Wind Farm, but inshore of Muir Mhor Offshore Wind Farm. These vessels are then likely to choose to pass between Bellrock Offshore Wind Farm and the Array, or between Campion and Bellrock Offshore Wind Farms. It is considered likely that most vessels will pass inshore (section 14.2.1.1), however, these offshore options will remain viable routes albeit with a larger deviation than for vessels passing inshore.
14.2.2 East/West Routeing
14.2.2 East/West Routeing
- Six of the main commercial routes are broadly east/west in direction, with four starting/ending at Aberdeen and two starting/ending at Montrose. These routes are illustrated in Figure 14.3. The majority of vessels on these routes are oil and gas vessels, and as such overall frequency of use on an individual vessel basis is generally low.
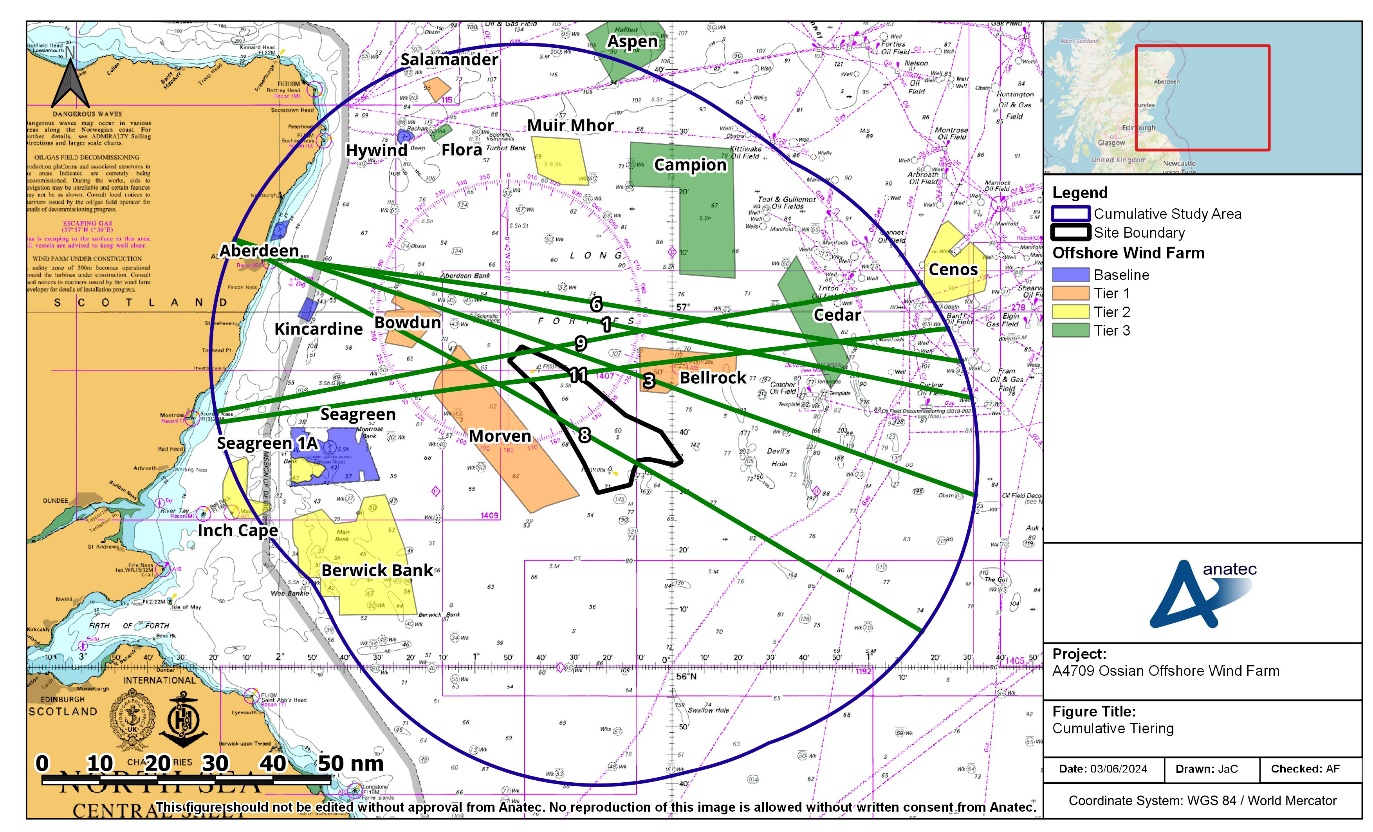
Figure 14.3: East/West Routeing (50 nm Buffer)
14.2.2.1 To/From Aberdeen
- Vessels transiting east/west from/to Aberdeen may choose to use the gap between Bellrock and Campion Offshore Wind Farms. During the regular operator outreach (section 4.2), Tidewater indicated that they would likely choose to transit between Bellrock and Campion Offshore Wind Farms, or inshore of Morven Offshore Wind Farm.
- However, vessels may also choose to use the gap between Bellrock Offshore Wind Farm and the Array, noting that during the Hazard Workshop (see Table 4.2), the general consensus was that the gap between Bellrock Offshore Wind Farm and the Array was likely to be used by oil and gas vessels depending on their terminus destinations and that it was of sufficient width to accommodate likely volumes and users.
14.2.2.2 To/From Montrose
- The two routes transiting to/from Montrose displayed low vessel numbers, with one (Route 9) displaying an average of one to two vessels per week and the other (Route 11) displaying an average of less than one vessel per week.
- These vessels could choose to pass between Morven and Bowdun Offshore Wind Farms and north of the Array, or pass south of Morven Offshore Wind Farm and the Array. This would lead to a deviation to the limited traffic volumes identified on these routes.
15 Allision and Collision Risk Modelling
15 Allision and Collision Risk Modelling
- To inform the risk assessment, a quantitative assessment of the major hazards deemed of relevance associated with the Array has been undertaken. The following subsections outline the inputs and methodology used for the collision and allision risk modelling.
15.1 Hazards Under Consideration
15.1 Hazards Under Consideration
- Hazards considered in the quantitative assessment are as follows:
- increased vessel to vessel collision risk;
- increased powered vessel to structure allision risk;
- increased drifting vessel to structure allision risk; and
- increased fishing vessel to structure allision risk.
- The pre wind farm assessment has been informed by the vessel traffic survey data (see section 10) in combination with the outputs of consultation (see section 4) and other baseline data sources (such as Anatec’s ShipRoutes database (Anatec, 2023)). Conservative assumptions have been made with regards to route deviations and future shipping growth over the lifetime of the Array.
15.2 Scenarios Under Consideration
15.2 Scenarios Under Consideration
- For each element of the quantitative assessment both a pre- and post wind farm scenario with base and future case vessel traffic levels have been considered. As a result, six distinct scenarios have been modelled (see section 13.4.1 for further details of future case traffic increase assumptions):
- Pre wind farm with the base case vessel traffic level.
- Pre wind farm with future case vessel traffic level defined by:
- A 10% increase in traffic; and
- A 20% increase in traffic.
- Post wind farm with the base case vessel traffic level.
- Post wind farm with future case vessel traffic levels defined by:
- A 10% increase in traffic; and
- A 20% increase in traffic.
- The results of the base case scenarios are detailed in full in the following subsections with the equivalent results for the future case scenarios provided in section 15.5.
15.3 Pre Wind Farm
15.3 Pre Wind Farm
15.3.1 Vessel to Vessel Encounters
15.3.1 Vessel to Vessel Encounters
- An assessment of current vessel-to-vessel encounters has been undertaken using the vessel traffic data collected as part of the vessel traffic surveys (see section 10). The model defines an encounter as two vessels passing within 1 nm of each other within the same minute. This helps to illustrate where existing shipping congestion is highest and therefore where offshore developments, such as an offshore wind farm, could potentially increase congestion and therefore also increase the risk of encounters and collisions. No account of whether encounters are head-on or stern‑to‑head are given; only close proximity is accounted for, noting this allows baseline frequency of encounters to be established.
- Figure 15.1 presents a heat map based upon the geographical distribution of vessel encounter tracks within a 500 m by 500 m density grid.
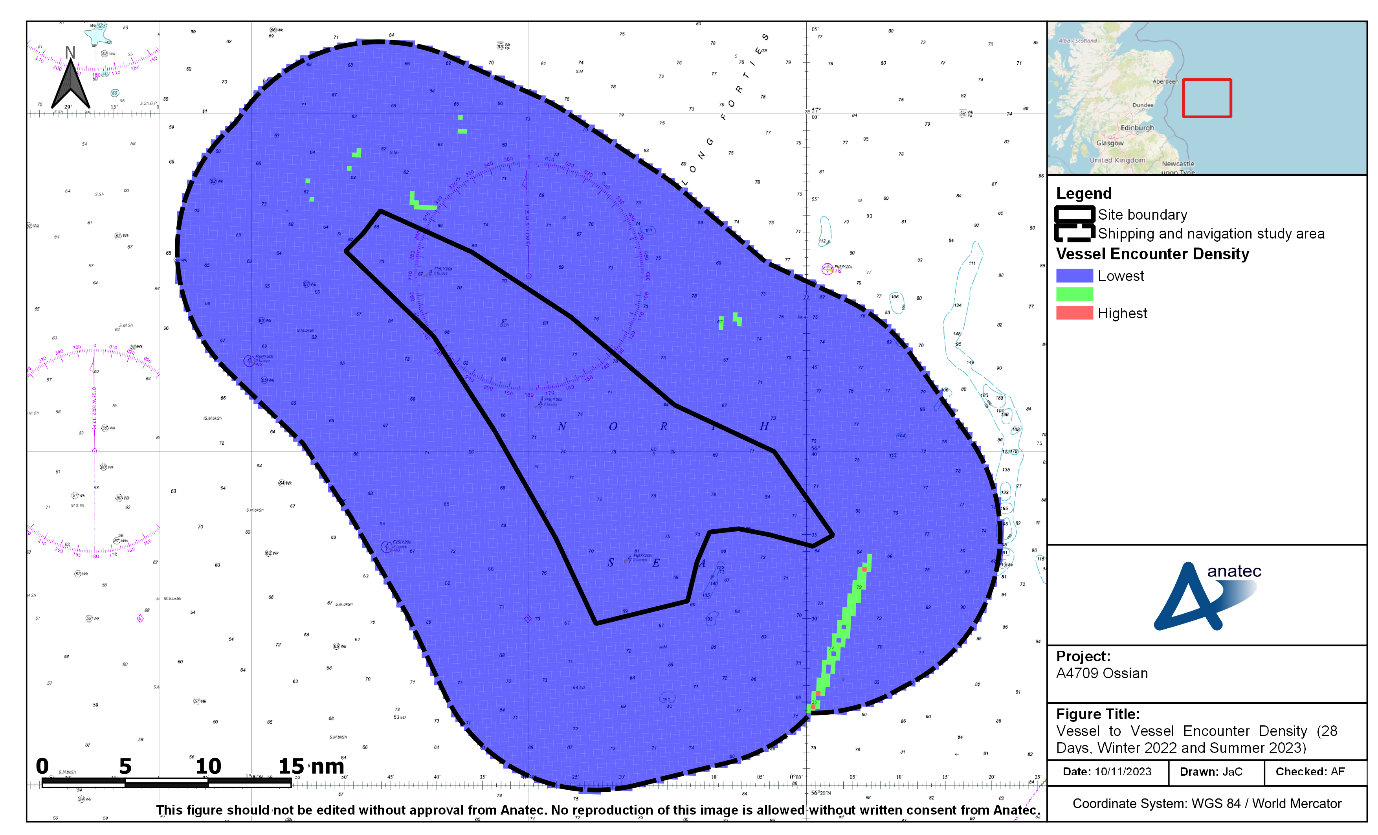
Figure 15.1: Density of Vessel to Vessel Encounters Recorded During the Combined 28-Day Vessel Traffic Survey Period (Winter 2022 and Summer 2023)
- Encounters within the shipping and navigation study area were minimal, reflecting the low traffic volume within the shipping and navigation study area generally, with a total of six encounters throughout the combined 28-day survey period.
- Four of the encounters occurred within the northern portion of the shipping and navigation study area; these encounters involved cargo vessels, oil and gas vessels and a single fishing vessel. In addition, an encounter occurred to the east of the site boundary involving a tanker and a fishing vessel and an encounter occurred to the south-east of the site boundary involving a cargo vessel and an unknown vessel recorded on Radar.
15.3.2 Vessel to Vessel Collisions
15.3.2 Vessel to Vessel Collisions
- The pre wind farm vessel routeing (which was based on the vessel traffic survey data) was used as input to Anatec’s COLLRISK model, which has been run to estimate the existing vessel-to-vessel collision risk in proximity to the site boundary.
- A heat map based upon the geographical distribution of collision risk within a 0.5 nm by 0.5 nm grid for the base case is presented in Figure 15.2.
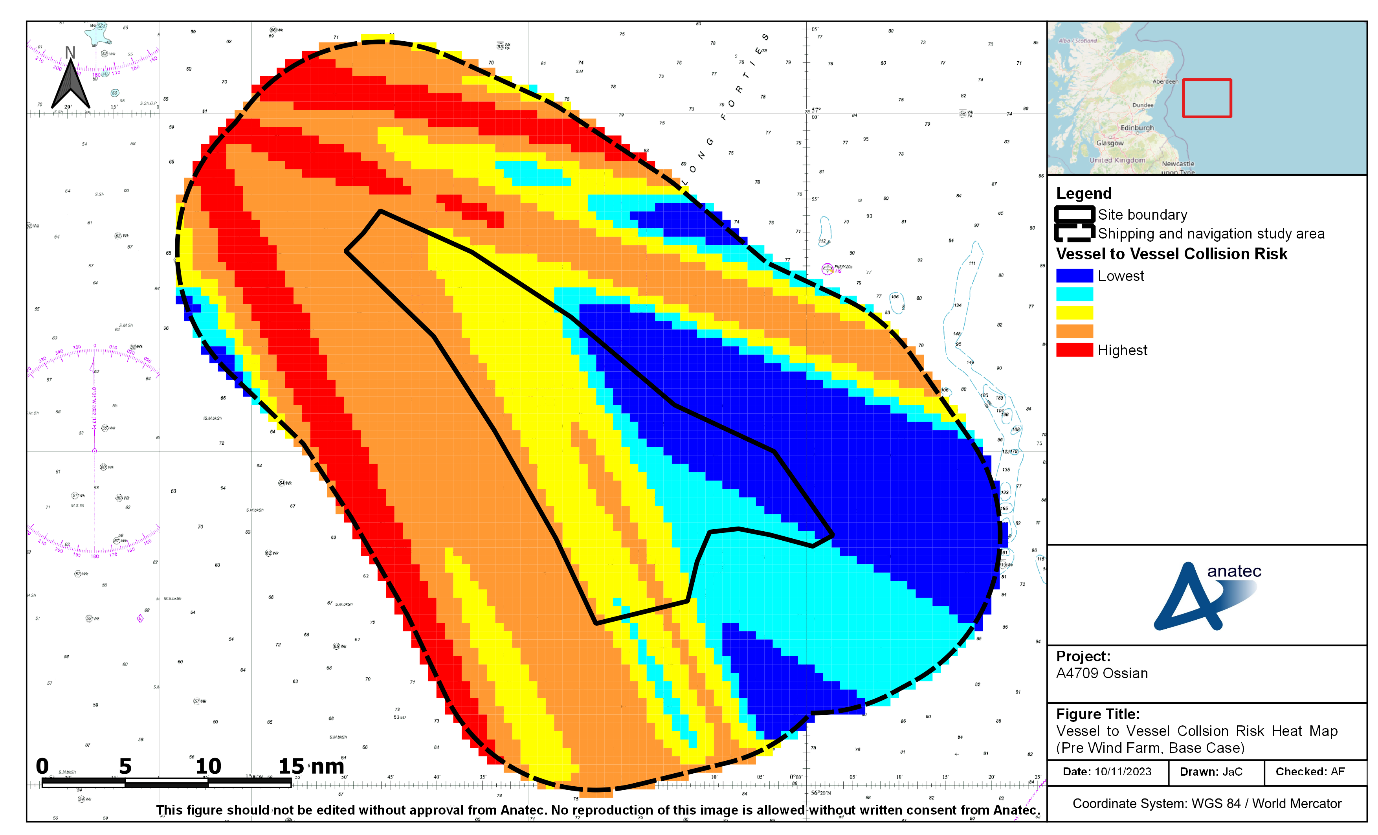
Figure 15.2: Vessel to Vessel Collision Risk Heat Map (Pre Wind Farm, Base Case)
- Assuming base case vessel traffic levels, the annual collision frequency pre wind farm was estimated to be 4.14×10⁻⁴, corresponding to a return period of approximately one in 2,418 years. This is comparable to other UK offshore wind farms with similar levels of traffic (e.g. the Seagreen 1 Offshore Wind Farm NRA Addendum (Anatec, 2018) estimated a baseline collision risk of 2,679 years).
- It is noted that the model is calibrated based upon major incident data at sea which allows for benchmarking but does not cover all incidents, such as minor impacts. Other incident data, which includes minor incidents, is presented in section 9. Full consideration of impacts of both worst case and most likely consequences is provided in section 16.
15.4 Post Wind Farm
15.4 Post Wind Farm
15.4.1 Simulated Automatic Identification System
15.4.1 Simulated Automatic Identification System
- Anatec’s AIS Simulator software was used to gain an insight into the potential re-routed commercial traffic following the installation of the Array structures. The AIS Simulator uses the mean positions of identified commercial main routes within the shipping and navigation study area and the anticipated shift post wind farm, together with the standard deviations and average number of vessels on each commercial main route to simulate tracks.
- A plot of 28 days of simulated AIS (to match the total duration of the vessel traffic surveys) within the shipping and navigation study area based on the deviated main commercial routes (see section 13.4.2) is presented in Figure 15.3.
- It is noted that the simulated AIS represents an MDS based on a mean 1 nm passing distance from the site boundary for routes.
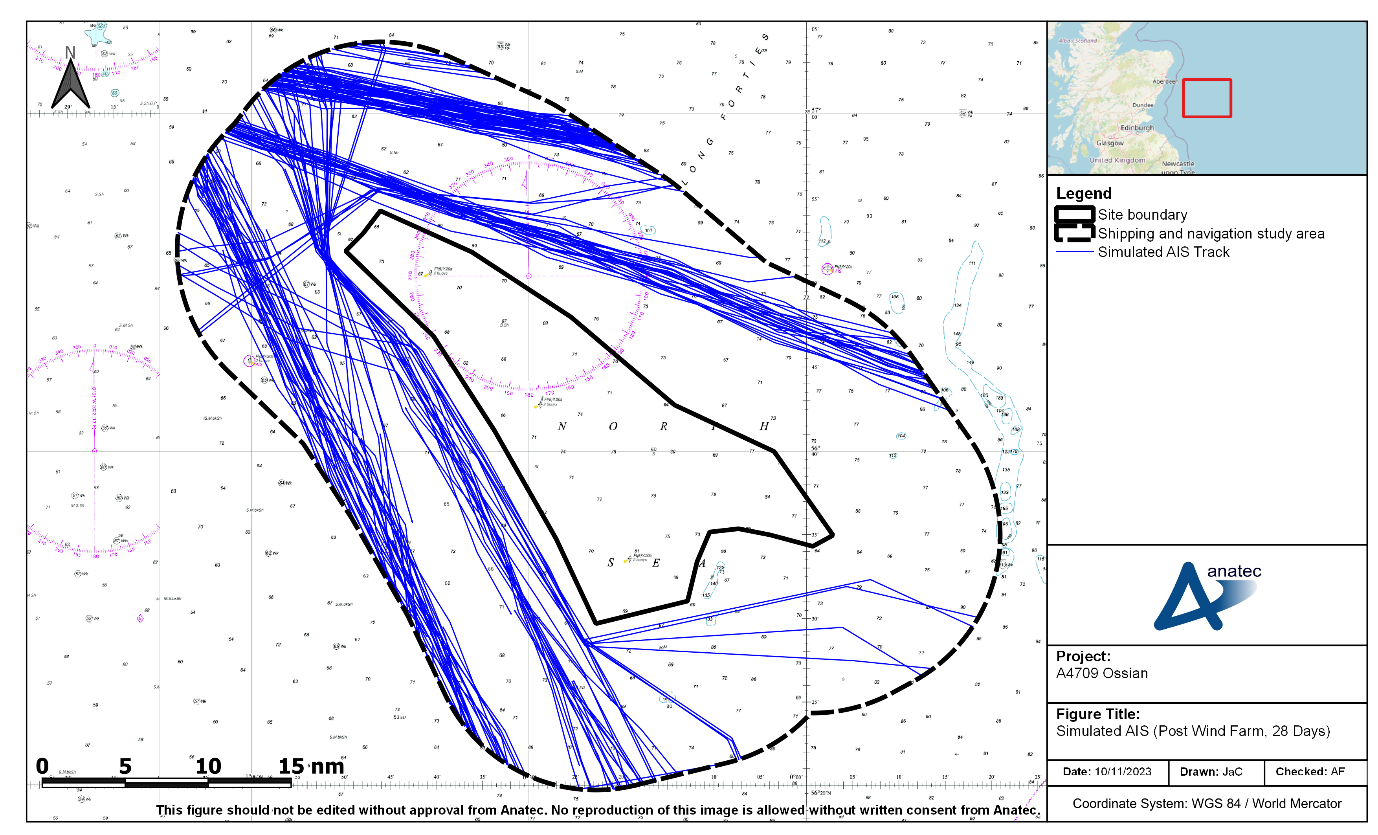
Figure 15.3: Simulated AIS Within the Shipping and Navigation Study Area (Post Wind Farm, 28 Days)
15.4.2 Vessel to Vessel Collisions
15.4.2 Vessel to Vessel Collisions
- Using the post wind farm routeing as input, Anatec’s COLLRISK model has been run to estimate the anticipated vessel to vessel collision risk in proximity to the site boundary.
- A heat map based upon the geographical distribution of collision risk within a 0.5 nm by 0.5 nm grid for the post wind farm base case is presented in Figure 15.4.
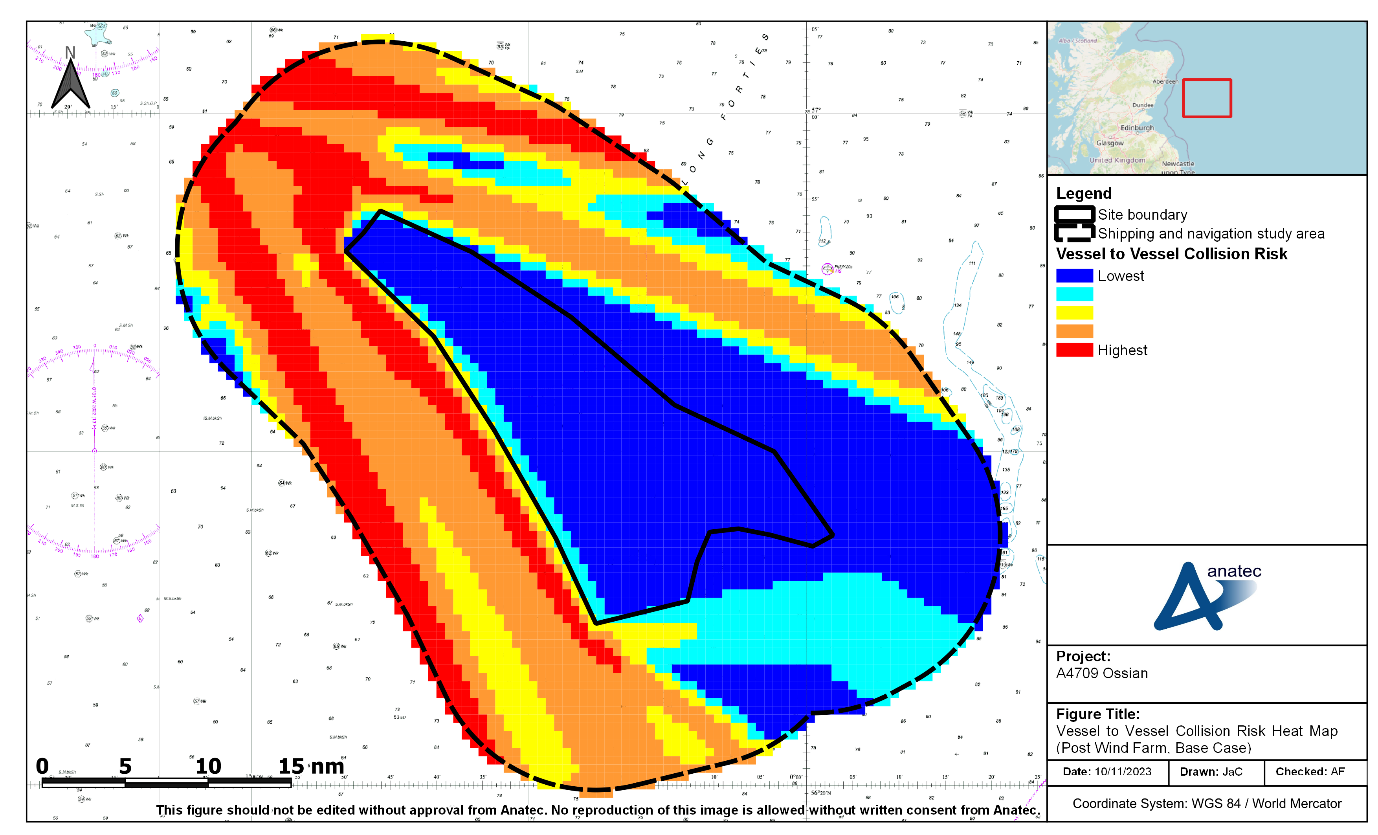
Figure 15.4: Vessel to Vessel Collision Risk Heat Map (Post Wind Farm, Base Case)
- Assuming base case vessel traffic levels, the annual collision frequency post wind farm was estimated to be 5.42×10⁻⁴, corresponding to a return period of approximately one in 1,845 years. This represents a 31% increase in collision frequency compared to the pre wind farm base case result.
- The largest increase in vessel-to-vessel collision risk from the pre wind farm to post wind farm scenarios corresponds to the region immediately inshore of the site boundary where multiple deviated routes are assumed to pass 1 nm from the western edge of the site boundary as a worst-case assumption; see section 13.4.2 for further details on these routes.
15.4.3 Powered Vessel to Structure Allision
15.4.3 Powered Vessel to Structure Allision
- Based upon the vessel routeing identified in the shipping and navigation study area, the anticipated re-routeing as a result of the presence of the Array, and assumptions that relevant embedded mitigation measures are in place (see section 18.1), the frequency of an errant vessel under power deviating from its route to the extent that it came into proximity with a wind farm structure associated with the Array is considered to be low.
- From consultation with the shipping industry, it is also assumed that commercial vessels would be highly unlikely to navigate between wind farm structures due to the restricted sea room and will instead be directed by the aids to navigation located in the region and those present at the Array. During the construction and decommissioning phases this will primarily consist of the buoyed construction area whilst during the operation and maintenance phase this will primarily consist of the lighting and marking of the wind farm structures themselves.
- Using the post wind farm routeing as input, together with the MDS and local meteorological ocean data, Anatec’s COLLRISK model was run to estimate the likelihood of a commercial vessel alliding with one of the wind farm structures within the site boundary whilst under power. In order to maintain a MDS, the model did not consider one structure shielding another.
- A plot of the annual powered allision frequency per structure for the base case is presented in Figure 15.5.
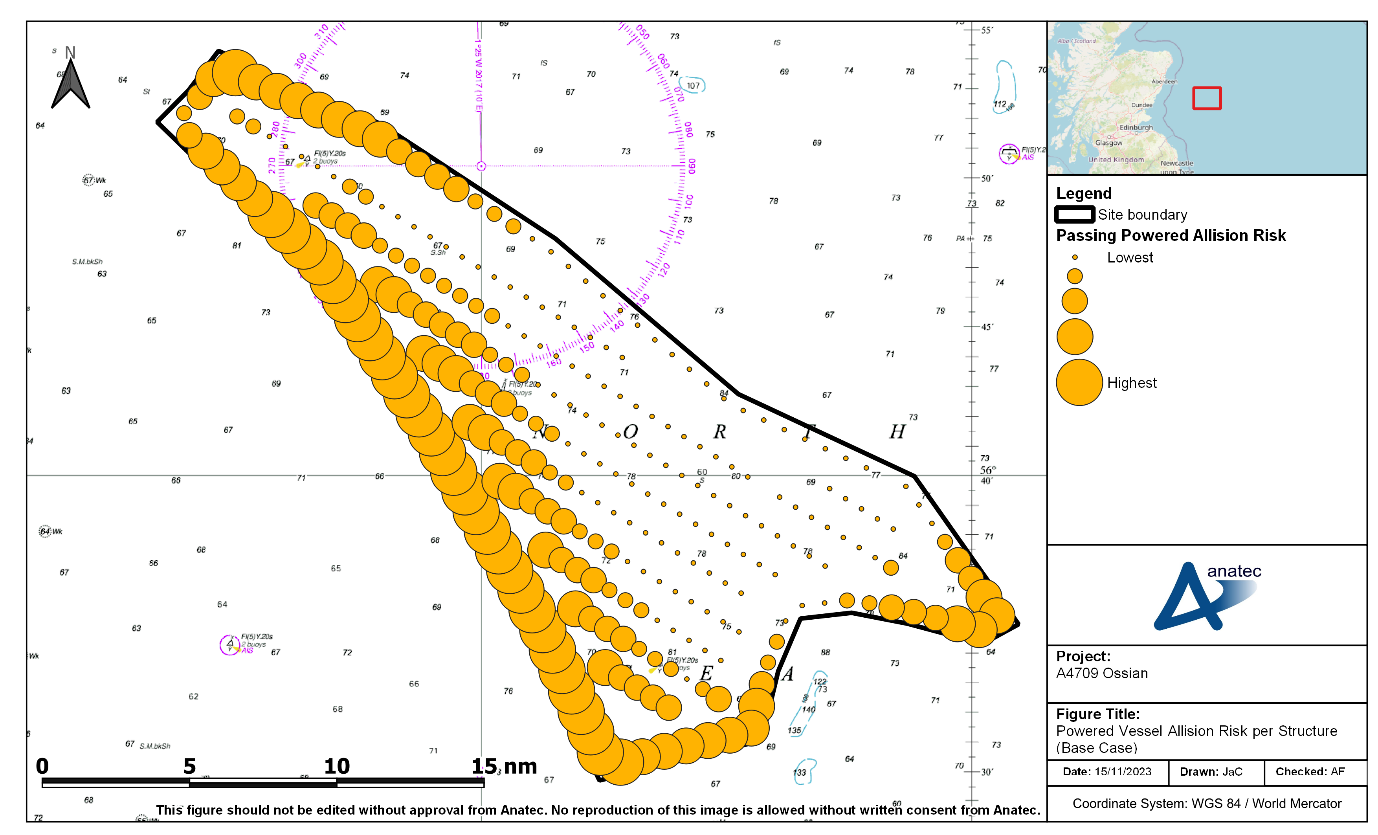
Figure 15.5: Powered Vessel Allision Risk per Structure (Base Case)
- Assuming base case vessel traffic levels, the annual powered vessel allision frequency was estimated to be 6.91×10⁻³, corresponding to a return period of one in 145 years.
- The greatest powered vessel to structure allision risk was associated with structures on the western periphery (where multiple deviated routes pass at a minimum mean distance of 1 nm from the site boundary, as seen in section 13.4.2); the 30 highest risk values were all associated with the western periphery. The greatest individual allision risk was 2.86×10⁻⁴, corresponding to one allision in 3,493 years; this illustrates that the overall allision risk is largely spread over a large number of peripheral structures.
15.4.4 Drifting Vessel to Structure Allision
15.4.4 Drifting Vessel to Structure Allision
- Using the post wind farm routeing as input, together with the worst-case indicative array layout and local meteorological ocean data, Anatec’s COLLRISK model was run to estimate the likelihood of a commercial vessel alliding with one of the wind farm structures within the Array. The model is based on the premise that propulsion on a vessel must fail before drifting will occur. The model takes account of the type and size of the vessel, the number of engines and the average time required to repair but does not consider navigational errors caused by human actions.
- The exposure times for a drifting scenario are based upon the vessel hours spent within 10 nm of the site boundary. These have been estimated based on the vessel traffic levels, speeds and revised routeing patterns. The exposure is divided by vessel type and size to ensure that these specific factors (which, based upon analysis of historical incident data, have been shown to influence incident rates) are taken into account for the modelling.
- Using this information, the overall rate of mechanical failure in proximity to the site boundary was estimated. The probability of a vessel drifting towards a wind farm structure and the drift speed are dependent on the prevailing wind, wave, and tidal conditions at the time of the incident. Therefore, three drift scenarios were modelled, each using the meteorological ocean data provided in section 8:
- wind;
- peak spring flood tide; and
- peak spring ebb tide.
- The probability of vessel recovery from drift is estimated based upon the speed of the drift and hence the time available before arriving at a wind farm structure. Vessels which do not recover within this time are assumed to allide. Conservatively, no account is made for another vessel (including a project vessel) rendering assistance.
- After modelling the three drifting scenarios, it was established that the flood tide dominated scenario produced the worst-case results. A plot of the annual drifting vessel allision frequency per structure for the base case is presented in Figure 15.6.
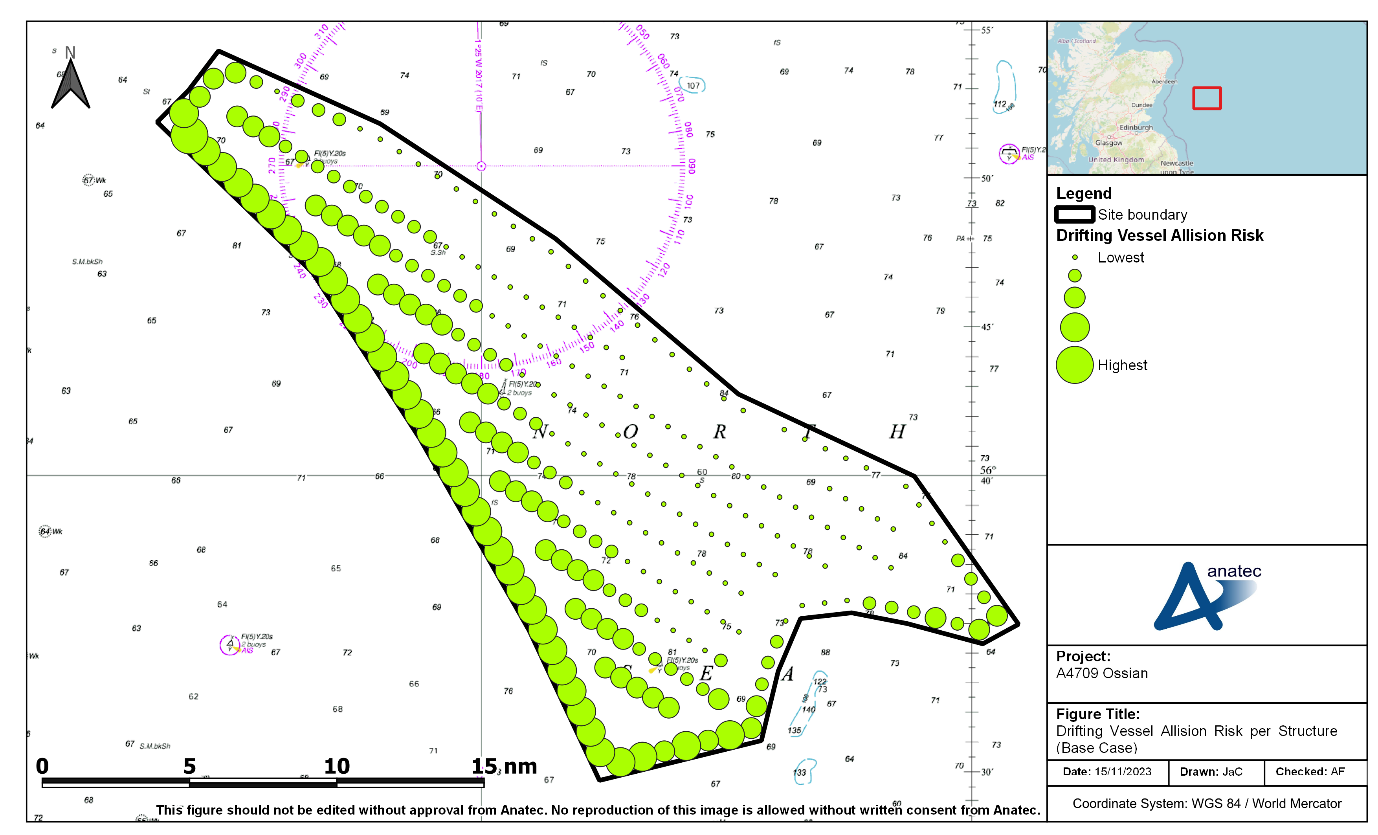
Figure 15.6: Drifting Vessel Allision Risk per Structure (Base Case)
- Assuming base case vessel traffic levels, the annual drifting allision frequency was estimated to be 2.16×10⁻⁴, corresponding to one allision in 4,619 years.
- Similar to the powered vessel allision risk results (as seen in section 15.4.3), the greatest drifting vessel to structure allision risks were associated with structures on the western periphery (where multiple deviated routes pass at a minimum mean distance of 1 nm from the site boundary, as seen in section 13.4.2). The greatest individual allision risk was associated with the northernmost structure on the western periphery, which had an allision risk of 1.33×10⁻⁵, corresponding to one allision in 74,999 years; this illustrates that the overall allision risk is largely spread over a large number of peripheral structures.
- Whilst drifting vessels do occur every year in UK waters, in most cases the vessel has been recovered prior to any allision incident occurring (such as by anchoring, restarting engines, or being taken in tow); see Table 9.1.
15.4.5 Fishing Vessel to Structure Allision
15.4.5 Fishing Vessel to Structure Allision
- Anatec’s COLLRISK model was run to estimate the likelihood of a fishing vessel alliding with one of the wind farm structures within the site boundary, with the vessel traffic data studied used as input[8].
- A fishing vessel allision is classified separately from other allisions since, unlike in the case of the commercial traffic characterised using the main commercial routes, fishing vessels may be either in transit or actively fishing within the shipping and navigation study area. Moreover, fishing vessels could be observed internally within the site boundary in addition to externally. Anatec’s COLLRISK model uses vessel numbers, sizes (length and beam), array layout and structure dimensions. The likelihood of a major allision incident has been calibrated against historical maritime incident data and historical AIS vessel traffic data within operational offshore wind farm arrays.
- It should be noted that the fishing vessel allision model is extremely conservative. It assumes that the volume and geographic distribution of fishing vessels will not change after installation of all Array structures while, as was noted during consultation (see section 4), it is considered likely that a notable proportion of fishing vessels will avoid the site boundary. In particular, it is considered that active fishing is unlikely to occur within the site boundary, with any fishing vessels choosing to pass through doing so for transit purposes only.
- A plot of the annual fishing vessel allision frequency per structure for the base case is presented in Figure 15.7.
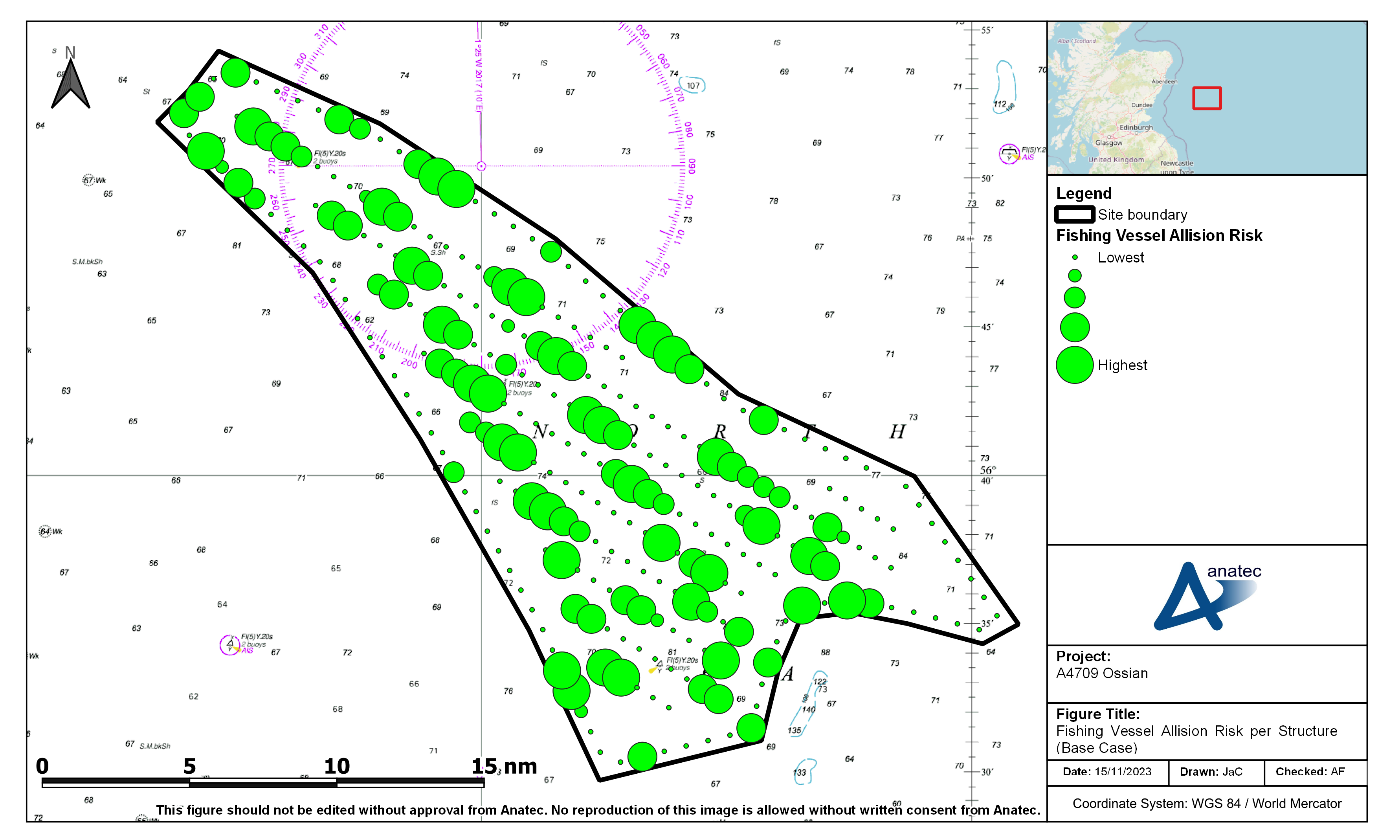
Figure 15.7: Fishing Vessel Allision Risk per Structure (Base Case)
- Assuming base case vessel traffic levels, the annual fishing vessel to structure allision frequency was estimated to be 4.08×10⁻², corresponding to one allision every 24 years.
- The structure with the greatest allision risk was in the central region of the site boundary and had an allision risk of 1.07×10⁻³, corresponding to one allision in 933 years.
15.5 Risk Results Summary
15.5 Risk Results Summary
- The previous sections modelled two scenarios, namely the pre and post wind farm scenarios with base case traffic levels. In order to incorporate the potential for future traffic growth, these scenarios have also each been modelled with two future case traffic levels. Table 15.1 summarises the results of all six scenarios.
Table 15.1: Risk Results Summary
Risk | Scenario | Annual Frequency | ||
|---|---|---|---|---|
Pre Wind Farm | Post Wind Farm | Increase | ||
Vessel to vessel collision | Base case | 4.14×10⁻⁴ (1 in 2,418 years) | 5.42×10⁻⁴ (1 in 1,845 years) | 1.28×10⁻⁴ |
Future case (10%) | 5.45×10⁻⁴ (1 in 1,835 years) | 7.28×10⁻⁴ (1 in 1,374 years) | 1.83×10⁻⁴ | |
Future case (20%) | 6.33×10⁻⁴ (1 in 1,580 years) | 8.41×10⁻⁴ (1 in 1,188 years) | 2.09×10⁻⁴ | |
Powered vessel to structure allision | Base case | - | 6.91×10⁻³ (1 in 145 years) | - |
Future case (10%) | - | 7.60×10⁻³ (1 in 132 years) | - | |
Future case (20%) | - | 8.29×10⁻³ (1 in 121 years) | - | |
Drifting vessel to structure allision | Base case | - | 2.16×10⁻⁴ (1 in 4,619 years) | - |
Future case (10%) | - | 2.38×10⁻⁴ (1 in 4,199 years) | - | |
Future case (20%) | - | 2.60×10⁻⁴ (1 in 3,849 years) | - | |
Fishing vessel to structure allision | Base case | - | 4.08×10⁻² (1 in 24 years) | - |
Future case (10%) | - | 4.49×10⁻² (1 in 22 years) | - | |
Future case (20%) | - | 4.90×10⁻² (1 in 20 years) | - | |
Total | Base case | 4.14×10⁻⁴ (1 in 2,418 years) | 4.85×10⁻² (1 in 21 years) | 4.81×10⁻² |
Future case (10%) | 5.45×10⁻⁴ (1 in 1,835 years) | 5.35×10⁻² (1 in 19 years) | 5.30×10⁻² | |
Future case (20%) | 6.33×10⁻⁴ (1 in 1,580 years) | 5.84×10⁻² (1 in 17 years) | 5.78×10⁻² | |
15.6 Subsea Interaction
15.6 Subsea Interaction
15.6.1 Vessel Draughts
15.6.1 Vessel Draughts
- There is the potential that vessels could interact with the subsea infrastructure associated with the Array. To assess this, vessel draughts recorded per vessel type during the vessel traffic surveys has been assessed.
- Table 15.2 and Table 15.3 present the average and maximum vessel draughts recorded during the combined 28-day survey period, broken down by vessel type, within the shipping and navigation study area and site boundary respectively.
Table 15.2: Average and Maximum Draught per Vessel Type Recorded During the 28-Day Combined Vessel Traffic Survey Within the Shipping and Navigation Study Area
Vessel Type | Average Draught (m) | Maximum Draught (m) |
|---|---|---|
Oil and Gas | 5.4 | 8.2 |
Fishing | 2.7 | 7.2 |
Cargo | 6.6 | 13.8 |
Tankers | 8.9 | 16.3 |
Passenger | 7.3 | 8.2 |
Table 15.3: Average and Maximum Draught per Vessel Type Recorded During the 28-Day Combined Vessel Traffic Survey Within the Site Boundary
Vessel Type | Average Draught (m) | Maximum Draught (m) |
|---|---|---|
Fishing | 3.7 | 7.2 |
Oil and Gas | 5.9 | 7.3 |
Cargo | 6.3 | 13.8 |
Passenger | 8.2 | 8.2 |
Tanker | 9.2 | 14.2 |
- Commercial vessels are considered likely to deviate to avoid the site boundary based on operational experience of existing wind farms and consultation undertaken for the Array (see section 4). Any vessels that do choose to pass through the Array are more likely to be small fishing vessels and recreational vessels compared to commercial vessels.
- It was noted during the Hazard Workshop that fishing vessels up to 24 m would keep a clearance of around 250 - 300 m and that larger fishing vessels, such as 70 - 90 m pelagic vessels, would likely keep a 500 m clearance and would be unlikely to transit through the Array. It was also noted that recreational vessels would likely keep a minimum of 50 m from wind turbines and that even this distance would be unusual.
- Fishing vessels will typically have larger draughts than recreational vessels, and are slightly more prevalent in the area in and around the Array. The distribution of fishing vessel draughts recorded within the site boundary during the 12 months of fishing vessel AIS (see section E.4.2.4) is presented in Figure 15.8.
Figure 15.8: Distribution of Fishing Vessel Draughts Within the Site Boundary (12 months, 2022)
- As shown, the large majority (78%) of fishing vessels within the site boundary had a draught between 6 m and 8 m. The maximum fishing vessel draught recorded during the 12 months of AIS was 8.6 m.
- It is noted that recreational vessels were recorded in limited numbers within the vessel traffic data (see section 10.3.5) and that those that do choose to transit within the site boundary would likely be experienced given the distance offshore. It should also be noted that recreational vessels tend to have shallower draughts compared to fishing vessels.
- The final design of the floating foundation, mooring line arrangements and dynamic cable arrangement is not known at the stage. Ossian OWFL are currently considering a number of floating foundation concepts. A realistic worst case mooring arrangement has been derived following engagement with suppliers to understand current approaches to mooring of floating foundations. For the purposes of the NRA, section 15.6.2 provides an illustration of an example mooring line arrangement based on worst-case parameters. As the final mooring line and dynamic cable design has not been confirmed, consultation on the design will be discussed and agreed with MCA and NLB post consent as part of the DSLP process. The principles of the design will ensure appropriate underkeel clearances.
15.6.2 Mooring Lines
15.6.2 Mooring Lines
- Figure 15.9 presents an illustration of an indicative mooring line arrangement based on worst-case parameters, noting that this is subject to final design and selection of floater concept. This illustration presents the distance of the mooring line below the sea level at each distance within 300 m of the foundation. Also included is the maximum draught value recorded within the shipping and navigation study area during the combined 28-day period.
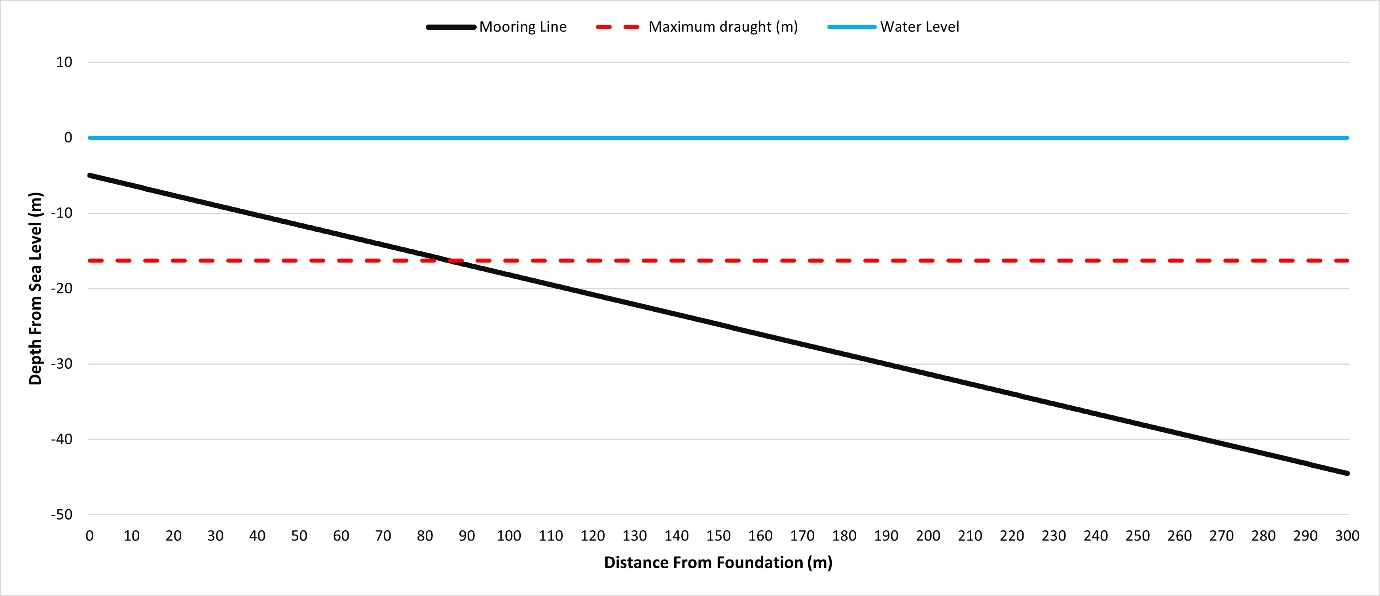
Figure 15.9: Mooring Line Illustration
16 Risk Assessment
16 Risk Assessment
- This section provides a qualitative and quantitative risk assessment (using FSA) for the hazards identified, based on baseline data, expert opinion, outputs of the Hazard Workshop, stakeholder concerns and lessons learnt from existing offshore developments.
- At the end of the assessment of each hazard, these frequency of occurrence and severity of consequence rankings are summarised with the resulting significance of risk given in highlighted bold text.
- The risk control log (see section 18) summarises the risk assessment and a concluding risk statement is provided (see section 20.5).
16.1 Increased Vessel to Vessel Collision Risk Resulting from Displacement (Third-Party to Third-Party)
16.1 Increased Vessel to Vessel Collision Risk Resulting from Displacement (Third-Party to Third-Party)
16.1.1 Construction Phase
16.1.1 Construction Phase
- There will be no restrictions on entry to the Array other than through any active safety zones. However, it is considered likely that commercial vessels will deviate to avoid the Array during the construction phase, which will be marked as a buoyed construction area as directed by NLB. This aligns with input received in the Hazard Workshop including from commercial vessel representation, and operational experience of other UK wind farms including the nearby Seagreen 1 Offshore Wind Farm and Neart na Gaoithe Offshore Wind Farm.
- Anticipated deviations for the main commercial routes identified from the vessel traffic data have been defined. The full methodology for main route deviations is provided in section 13.4.1 with reasonable worst case deviation assumptions established in line with industry experience and consultation feedback.
- Deviations from the pre wind farm scenario (current baseline) would be required for seven out of the 11 main commercial routes identified (Routes 4, 5, 7, 8, 9, 10 and 11). However, it should be noted that the busiest routes (Routes 4 and 5 in Figure 13.1, which have six vessels per week and two to three vessels per week, respectively) would have very low deviation (no more than 0.2 nm) while the routes with larger deviation (Routes 7 and 8 in Figure 13.1, which would have a deviation of 5.7 nm and 4.9 nm, respectively) are quieter routes (with only one to two vessels per week each). Further, worst case assumptions have been made in terms of deviations as set out in section 13.4.1.
- It is noted that one regular commercial ferry operator was identified in the area, namely Smyril Line, who run a service between the Faroe Islands, Iceland and Rotterdam.
- With the main commercial route deviations in place, the base case annual vessel to vessel collision frequency for commercial vessels is estimated to be 5.42×10⁻⁴, corresponding to a return period of approximately one in 1,845 years. This represents a 31% increase in collision frequency compared to the pre wind farm base case scenario. The return period of one in 1,845 years is reflective of the low volume of vessel traffic in the area.
- Smaller vessel types (e.g. fishing, recreation) may still choose to transit through the Array during the construction phase, noting this would be at the discretion of individual vessels. In this regard it should be considered that there is limited experience of deployment of large scale floating offshore wind projects, and as such vessels may be less likely to transit through floating structures than those on fixed foundations (this assumption aligns with consultation input, see section 4). However, there is considered to be sufficient sea room to accommodate any vessels that chose to avoid the Array without notably increasing vessel density around the site boundary given that the nearest baseline offshore wind farm (Seagreen 1 Offshore Wind Farm) is in excess of 25 nm away from the Array.
- The impact will be present throughout the construction phase which will last for up to eight years. Given that third-party vessels are expected to be compliant with relevant Flag State regulations including the COLREGs, the likes of collision avoidance action seek to ensure that the likelihood of an encounter developing into a collision incident is low. This is furthered by the promulgation of information and charting of the buoyed construction area which will increase awareness of ongoing construction activities, thus allowing third-party vessels to passage plan in advance (see section 18.1).
- The most likely consequences in the event of a collision incident between third-party vessels are minor contact between the vessels resulting in minor damage to property and minor reputational effects on business but no perceptible effect on people. Although considered less likely, collision between third party vessels could involve one of the vessels foundering resulting in Potential Loss of Life (PLL) and the environmental consequence of pollution. Such a scenario would be more likely if one of the vessels involved was a small craft which may have weaker structural integrity than a commercial vessel. The Applicant’s Marine Pollution Contingency Plan (MPCP) will be implemented to reduce the environmental impacts should pollution occur.
16.1.1.1 Frequency of Occurrence
- The frequency of occurrence is considered to be extremely unlikely based on the available sea room, the outputs of the modelling, and consideration of historical incident data.
16.1.1.2 Severity of Consequence
- The severity of consequence is considered to be serious.
16.1.1.3 Significance of Risk
- Overall, the frequency of occurrence is considered to be extremely unlikely and severity of consequence is deemed to be serious. The risk will, therefore, be of tolerable significance.
16.1.1.4 Additional Mitigation and Residual Risk
- No additional shipping and navigation mitigation is considered necessary because the likely risk, in the absence of mitigation beyond the embedded mitigation measures outlined in section 18.1, is ALARP and not significant in EIA terms.
16.1.2 Operation and Maintenance Phase
16.1.2 Operation and Maintenance Phase
- Based on experience at existing operational offshore wind farms and consultation undertaken, it is anticipated that commercial vessels will generally choose not to navigate internally within the Array. Therefore, the anticipated deviations discussed for the construction phase are directly applicable to the operation and maintenance phase, and it is likely that the deviations already established during the construction phase will continue into the operation and maintenance phase. On this basis, the risk of third-party to third-party vessel collision for commercial vessels is considered analogous during the operation and maintenance phase as during the construction phase.
- It is anticipated that commercial fishing vessels and recreational vessels may choose to navigate internally within the Array (and this may be more likely during the operation and maintenance phase than in the construction phase given there will be no construction buoys or construction activities) based on experience at existing operational offshore wind farms, particularly in favourable weather conditions. Such navigation may result in an additional encounter and collision risk associated with these small craft exiting the Array. However, with the application of good seamanship and given the high minimum spacing between wind turbines (1,000 m), there is not expected to be a visual obstruction to vessels passing at the edge of the Array. It is also noted that most small vessels this far offshore would be expected to be broadcasting on AIS. This assumption aligns with both consultation input (section 4), and the vessel traffic survey data collected (section 10).
- The impact will be present throughout the operation and maintenance phase which will last for up to 35 years. Given that third-party vessels are expected to be compliant with Flag State regulations including the COLREGs, the likes of collision avoidance action will seek to ensure that the likelihood of an encounter developing into a collision incident is low. This is furthered by the promulgation of information and charting of infrastructure associated with the Array which will increase awareness of the Array and any ongoing major maintenance activities, thus allowing third-party vessels to passage plan in advance (see section 18.1).
- The most likely consequences of the impact are as per the equivalent construction phase impact, namely minor contact and damage to property and minor reputational effects on business, but no perceptible impact on people. Although considered less likely, collision between third party vessels could involve one of the vessels foundering resulting in PLL and the environmental consequence of pollution. Such a scenario would be more likely if one of the third party vessels involved was a small craft and the other a commercial vessel since the small craft may have a weaker structural integrity than the commercial vessel. The Applicant’s MPCP will be implemented to reduce the environmental impacts should pollution occur.
16.1.2.1 Frequency of Occurrence
- The frequency of occurrence is considered to be extremely unlikely based on the available sea room, the outputs of the modelling, and consideration of historical incident data.
16.1.2.2 Severity of Consequence
- The severity of consequence is considered to be serious.
16.1.2.3 Significance of the Risk
- Overall, the frequency of occurrence is considered to be extremely unlikely and the severity of consequence is deemed to be serious. The risk will therefore be of tolerable significance.
16.1.2.4 Additional Mitigation and Residual Risk
- No additional shipping and navigation mitigation is considered necessary because the likely risk, in the absence of mitigation beyond the embedded mitigation measures outlined in section 18.1, is ALARP and not significant in EIA terms.
16.1.3 Decommissioning Phase
16.1.3 Decommissioning Phase
- Since the methods used to remove infrastructure are expected to be similar to those used for installation, this impact is expected to be similar in nature to the equivalent construction phase impact. In particular, a buoyed decommissioning area analogous to the buoyed construction area will be in place resulting in the anticipated deviations for the main commercial routes defined for the construction phase being directly applicable for the decommissioning phase. On this basis, the risk of third-party to third-party vessel collision for commercial vessels is considered the same during the decommissioning phase as during the construction phase. However, it is noted that the deviations will be well established by the decommissioning phase, and that vessels will likely be more familiar with the Array than during the construction phase.
- The impact will be present throughout the decommissioning phase which is expected to be of similar duration to the construction phase (i.e. maximum of 8 years). Given that third-party vessels are expected to be compliant with Flag State regulations including the COLREGs, the likes of collision avoidance action seek to ensure that the likelihood of an encounter developing into a collision incident is low. This is furthered by the promulgation of information and charting of the buoyed decommissioning area which will increase awareness of ongoing decommissioning activities, thus allowing third-party vessels to passage plan in advance.
- The most likely consequences associated with the MDS are as per the equivalent construction phase and operation and maintenance phase impacts.
16.1.3.1 Frequency of Occurrence
- The frequency of occurrence is considered to be extremely unlikely based on the available sea room, the outputs of the modelling, and consideration of historical incident data.
16.1.3.2 Severity of Consequence
- The severity of consequence is considered to be serious.
16.1.3.3 Significance of the Risk
- Overall, the severity of consequence is deemed to be serious and the frequency of occurrence is considered to be extremely unlikely. The risk will therefore be of tolerable significance.
16.1.3.4 Additional Mitigation and Residual Risk
- No additional shipping and navigation mitigation is considered necessary because the likely risk, in the absence of mitigation beyond the embedded mitigation measures outlined in section 18.1, is ALARP and not significant in EIA terms.
16.2 Displacement From Adverse Weather Routeing
16.2 Displacement From Adverse Weather Routeing
- Some vessels and vessel operators may wish to transit alternative routes during periods of adverse weather. Adverse weather includes wind, wave and tidal conditions as well as reduced visibility due to fog.
16.2.1 Construction Phase
16.2.1 Construction Phase
- No specific adverse weather routeing was observed within the baseline vessel traffic data studied, however the long‑term 12 month AIS analysis (see Appendix E) showed a minor weighting towards summer months for cargo vessels, tankers, and oil and gas vessels in terms of traffic volumes. This may indicate that such vessels prefer to pass further inshore of the shipping and navigation study area in adverse conditions (which may be more likely during winter months).
- Adverse weather can hinder a vessel’s standard route, its speed of navigation, and/or its ability to enter the destination port. Adverse weather routes are assessed to be significant course adjustments to mitigate vessel motion in adverse weather conditions. When transiting in adverse weather conditions, a vessel is likely to encounter various types of weather and tidal phenomena, which may lead to severe roll motions, potentially causing damage to cargo and equipment, and/or discomfort and danger to persons on board. The sensitivity of a vessel to these phenomena will depend on the actual stability parameters, hull geometry, vessel type, vessel size and speed.
- The following key points of relevance to adverse weather were raised during consultation (see section 4):
- Smyril Line stated that vessels would likely not transit through offshore wind farms in adverse weather conditions.
- It was suggested at the Hazard Workshop that vessels would likely seek to make the most direct safe transit possible during adverse weather.
- Wilson Ship Management indicated transit choice through the area would depend on weather conditions, and stated preference for passing inshore.
- There is open sea area inshore of the site boundary (the closest baseline wind farm is Seagreen 1 Offshore Wind Farm, located 27 nm inshore) and therefore the buoyed construction area is not considered as hindering any preference for inshore routeing.
- Details would be promulgated to facilitate advanced passage planning including in adverse conditions. Under COLREGS (IMO, 1972/77), vessels are also required to take appropriate measures with regards to determining a safe speed, taking into account various factors including the state of visibility, the state of the wind, sea, and current as well as the proximity of navigational hazards. In particular, vessels would be able to account for forecast for adverse conditions within their passage planning.
- Most likely consequences are minor alterations to existing adverse weather routeing noting the data indicates a preference for inshore routeing in such conditions. As a worst case vessels may be required to pass further offshore than preferred leading to large deviations in adverse conditions and safety concerns.
16.2.1.1 Frequency of Occurrence
- The frequency of occurrence is considered to be extremely unlikely based on the available sea room, the outputs of the modelling, and consideration of historical incident data.
16.2.1.2 Severity of Consequence
- The severity of consequence is considered to be serious.
16.2.1.3 Significance of the Risk
- Overall, the frequency of occurrence is considered to be extremely unlikely and the severity of consequence is deemed to be serious. The risk will therefore be of tolerable significance.
16.2.1.4 Additional Mitigation and Residual Risk
- No additional shipping and navigation mitigation is considered necessary because the likely risk, in the absence of mitigation beyond the embedded mitigation measures outlined in section 18.1, is ALARP and not significant in EIA terms.
16.2.2 Operation and Maintenance Phase
16.2.2 Operation and Maintenance Phase
- As noted in the equivalent construction phase discussion, no specific adverse weather routeing was observed within the baseline vessel traffic data studied, however the long‑term 12 month AIS analysis showed a minor weighting towards summer months for cargo vessels, tankers, and oil and gas vessels in terms of volume.
- There is open sea area inshore of the site boundary (the closest operational wind farm is Seagreen 1 Offshore Wind Farm, located 27 nm inshore) and therefore the Array is not considered as hindering any preference for inshore routeing. During the operation and maintenance phase, vessels may be more likely to pass through the Array than during the construction phase, however based on consultation input (see section 4) it is unlikely that vessels would choose to transit through the Array during adverse weather conditions.
- All infrastructure will be shown on appropriate Admiralty Charts ensuring vessels can passage plan to account for the Array. In particular, vessels would be able to account for forecast for adverse conditions within their passage planning. Under COLREGS (IMO, 1972/77), vessels are also required to take appropriate measures with regards to determining a safe speed, taking into account various factors including the state of visibility, the state of the wind, sea, and current as well as the proximity of navigational hazards.
- Most likely consequences are minor alterations to existing adverse weather routeing noting the data indicates a preference for inshore routeing in such conditions. As a worst case vessels may be required to pass further offshore than preferred leading to large deviations in adverse conditions and safety concerns.
16.2.2.1 Frequency of Occurrence
- The frequency of occurrence is considered to be extremely unlikely based on the available sea room, the outputs of the modelling, and consideration of historical incident data.
16.2.2.2 Severity of Consequence
- The severity of consequence is therefore considered to be serious.
16.2.2.3 Significance of the Risk
- Overall, the frequency of occurrence is considered to be extremely unlikely and the severity of consequence is deemed to be serious. The risk will therefore be of tolerable significance.
16.2.2.4 Additional Mitigation and Residual Risk
- No additional shipping and navigation mitigation is considered necessary because the likely risk, in the absence of mitigation beyond the embedded mitigation measures outlined in section 18.1, is ALARP and not significant in EIA terms.
16.2.3 Decommissioning Phase
16.2.3 Decommissioning Phase
- Since the methods used to remove infrastructure are expected to be similar to those used for installation, this impact is expected to be similar in nature to the equivalent construction phase impact. In particular, a buoyed decommissioning area analogous to the buoyed construction area will be in place. However, it is noted that the deviations will be well established by the decommissioning phase, and that vessels will likely be more familiar with the Array than during the construction phase.
- Details would be promulgated to facilitate advanced passage planning including in adverse conditions. In particular, vessels would be able to account for forecast for adverse conditions within their passage planning. Under COLREGS (IMO, 1972/77), vessels are also required to take appropriate measures with regards to determining a safe speed, taking into account various factors including the state of visibility, the state of the wind, sea, and current as well as the proximity of navigational hazards.
- Most likely consequences are minor alterations to existing adverse weather routeing noting the data indicates a preference for inshore routeing in such conditions. As a worst case vessels may be required to pass further offshore than preferred leading to large deviations in adverse conditions and safety concerns.
16.2.3.1 Frequency of Occurrence
- The frequency of occurrence is considered to be extremely unlikely based on the available sea room, the outputs of the modelling, and consideration of historical incident data.
16.2.3.2 Severity of Consequence
- The severity of consequence is considered to be serious.
16.2.3.3 Significance of the Risk
- Overall, the frequency of occurrence is considered to be extremely unlikely and the severity of consequence is deemed to be serious. The risk will therefore be of tolerable significance.
16.2.3.4 Additional Mitigation and Residual Risk
- No additional shipping and navigation mitigation is considered necessary because the likely risk, in the absence of mitigation beyond the embedded mitigation measures outlined in section 18.1, is ALARP and not significant in EIA terms.
16.3 Increased Vessel to Vessel Collision Risk (Third-Party To Project Vessels)
16.3 Increased Vessel to Vessel Collision Risk (Third-Party To Project Vessels)
16.3.1 Construction Phase
16.3.1 Construction Phase
- Up to 7,902 return trips by construction vessels (and site preparation vessels) may be made throughout the construction phase and will include vessels which are Restricted in their Ability to Manoeuvre (RAM). Project vessels will be managed by marine coordination, including the use of traffic management procedures such as the designation of entry and exit points to and from the buoyed construction area. Project vessels will also carry AIS and be compliant with relevant Flag State regulations, including the COLREGs, and comply with the procedures set out in the VMP (which will be a condition of consent).
- Safety zones will be applied for including up to 500 m around structures where vessels are undertaking construction work and 50 m around partially completed or completed surface piercing structures prior to commissioning of the wind farm. Such safety zones will protect project vessels involved in construction which may be RAM. If on-site as deemed necessary via risk assessment, guard vessels will also assist with monitoring safety zones and alerting third party traffic to their presence.
- Details of construction activities, including the presence of safety zones and any use of advisory safe passing distances, as defined by risk assessment, will be suitably promulgated to increase awareness of ongoing construction activities.
- Additionally, the use of IALA G1162 (IALA, 2021b) compliant lighting and marking including lights, marks, sounds, signals and other aids to navigation as required by the NLB and the MCA will further increase awareness, both in day and night conditions including in restricted visibility. This includes the buoyed construction area which will be agreed with the NLB and within which project vessels undertaking construction activities will most likely be located during construction activities. As per the impact on vessel displacement, it is anticipated that third-party vessels are unlikely to frequently enter the buoyed construction area and therefore the level of exposure for project vessels located on-site will be very low.
- In restricted visibility, there is an increased risk of visual impediment to third-party vessels in relation to identifying project vessels entering and exiting the buoyed construction area. However, the COLREGs regulate vessel movements in adverse weather conditions including the requirement for all vessels operating in reduced visibility to maintain a safe speed which will allow more time for reacting to encounters. COLREGs also covers the movement of project vessels and manages any encounters, and the carriage of AIS by such vessels will also assist with identifying their movements.
- It is noted that there will be a need to tow floating substructures out of port during the construction phase. Feedback received at the Hazard Workshop (see section 4.3.3) was that good seamanship and watchkeeping in compliance with COLREGS were key mitigations. Procedures for vessels towing substructures will also be considered in the VMP. All vessels involved in towing procedures will be lit and marked as required under COLREGS. Precise plans for fabrication and wet storage locations are unknown at this stage. Where enabling works are required within port limits to facilitate fabrication and storage these will be subject to the relevant assessment and licensing for the port works. Wet storage within the site boundary will be limited.
- The impact will be present throughout the construction phase which may last for up to eight years. With the embedded mitigation measures noted in section 18.1 implemented, it is considered unlikely that a close encounter between a third-party vessel and a project vessel will occur. In the event that such an encounter does occur, collision avoidance action would be implemented by the vessels as per the COLREGs, thus seeking to ensure that the likelihood of the encounter developing into a collision incident is very low.
- From historical incident data, there has been only one collision incident involving a third-party vessel and project vessel in the UK, occurring in a harbour in 2011 and resulting in moderate vessel damage but no harm to any People On Board (POB). No collision incidents have occurred in the period since (in excess of ten years), reflecting the increasing awareness of offshore wind farm developments and improved application of the various measures outlined above.
- The most likely consequences in the event of a collision incident between a project vessel and third‑party vessel are minor contact between the vessels resulting in minor damage to property and minor reputational effects on business but no perceptible effect on people. Although considered less likely collision between third party vessels could involve one of the vessels foundering resulting in PLL and the environmental consequence of pollution. Such a scenario would be more likely if the third-party vessel involved was a small craft which may have weaker structural integrity than a commercial vessel. The Applicant’s MPCP will be implemented to reduce the environmental effects should pollution occur.
16.3.1.1 Frequency of Occurrence
- The frequency of occurrence is considered to be extremely unlikely based on the available sea room, consideration of historical incident data, and the embedded mitigation in place to manage project vessel movements and activities.
16.3.1.2 Severity of Consequence
- The severity of consequence is considered to be serious.
16.3.1.3 Significance of Risk
- Overall, the frequency of occurrence is considered to be extremely unlikely and the severity of consequence is deemed to be serious. The risk will therefore be of tolerable significance.
16.3.1.4 Additional Mitigation and Residual Risk
- No additional shipping and navigation mitigation is considered necessary because the likely risk, in the absence of mitigation beyond the embedded mitigation measures outlined in section 18.1, is ALARP and not significant in EIA terms.
16.3.2 Operation and Maintenance Phase
16.3.2 Operation and Maintenance Phase
- Up to 508 return trips annually from vessels may be made throughout the operation and maintenance phase and will include vessels which are RAM. As per the construction phase, project vessels will be managed by marine coordination, carry AIS and be compliant with relevant Flag State regulations.
- Also, safety zones will be applied for including up to 500 m around structures where vessels are undertaking major maintenance work. Such safety zones will protect project vessels involved in major maintenance which may be RAM. If on-site (determined via risk assessment of major maintenance activities), guard vessels will assist with monitoring safety zones and alerting third‑party traffic to their presence.
- Similarly to the construction phase, details of major maintenance activities including the presence of safety zones and any advisory safe passing distances, as defined by risk assessment, will be suitably promulgated (e.g. via Notice to Mariners, Kingfisher) to increase awareness of ongoing major maintenance activities.
- Additionally, the use of lighting and marking (IALA G1162 compliant (IALA, 2021b)) as required by the NLB and the MCA will further increase awareness, both in day and night conditions including in restricted visibility. In restricted visibility there is an increased risk of visual obstruction to third-party vessels in relation to identifying project vessels entering and exiting the project. However, the COLREGs regulate vessel movements in adverse weather conditions, allowing more time to react to encounters. The carriage of AIS by project vessels will also assist with third‑party vessels identifying their movements.
- As per the equivalent construction phase impact, there has been only one collision incident involving a third-party vessel and project vessel in the UK, occurring in a harbour in 2011 and resulting in moderate vessel damage but no harm to any POB. No collision incidents have occurred in the period since (in excess of ten years), reflecting the increasing awareness of offshore wind farm developments and improved application of the various measures previously outlined.
- It is noted that there may be a need to tow floating substructures to/from port during the operation and maintenance phase for maintenance purposes (noting this is only likely to be needed for major component replacement). Feedback received at the Hazard Workshop (see section 4.3.3) was that good seamanship and watchkeeping in compliance with COLREGS were key mitigations. Procedures for vessels towing substructures will also be considered in the VMP. All vessels involved in towing procedures will be lit and marked as required under COLREGS.
- The impact will be present throughout the operation and maintenance phase which may last for up to 35 years. With the embedded mitigation measures noted in section 18.1 implemented, it is considered unlikely that an encounter between a third-party vessel and a project vessel will occur. In the event that such an encounter does occur, collision avoidance action would be implemented by the vessels as per COLREGs, thus ensuring that the likelihood of the encounter developing into a collision incident is very low.
- The likelihood of an encounter is decreased compared to in the construction phase given that fewer project vessels will generally be on-site at any time.
- The most likely consequences in the event of a collision incident between a project vessel and third-party vessel are as per the equivalent construction phase impact, namely minor contact and damage to property and minor reputational effects on business, but no perceptible effect on people. Although considered less likely collision between third party vessels could involve one of the vessels foundering resulting in PLL and the environmental consequence of pollution. Such a scenario would be more likely if the third-party vessel involved was a small craft which may have weaker structural integrity than a commercial vessel. The Array’s MPCP will be implemented to reduce the environmental effects should pollution occur.
16.3.2.1 Frequency of Occurrence
- The frequency of occurrence is considered to be extremely unlikely based on the available sea room, consideration of historical incident data, and the embedded mitigation in place to manage project vessel movements and activities.
16.3.2.2 Severity of Consequence
- The severity of consequence is considered to be serious.
16.3.2.3 Significance of the Risk
- Overall, the frequency of occurrence is considered to be extremely unlikely and the severity of consequence is deemed to be serious. The risk will therefore be of tolerable significance.
16.3.2.4 Additional Mitigation and Residual Risk
- No additional shipping and navigation mitigation is considered necessary because the likely risk, in the absence of mitigation beyond the embedded mitigation measures outlined in section 18.1, is ALARP and not significant in EIA terms.
16.3.3 Decommissioning Phase
16.3.3 Decommissioning Phase
- Since the numbers and types of vessel used to remove infrastructure are expected to be similar to those used for installation, this impact is expected to be similar in nature to the equivalent construction phase impact. In particular, project vessels will be managed by marine coordination, applications will be made for statutory safety zones, and decommissioning activities will generally be located within the buoyed decommissioning area.
- The impact will be present throughout the decommissioning phase which is expected to be of similar duration to the construction phase (i.e. maximum of 8 years). With the embedded mitigation measures noted in section 18.1 implemented, it is considered unlikely that an encounter between a third-party vessel and a project vessel will occur. As per the equivalent construction phase impact, in the event that such an encounter does occur, collision avoidance action would be implemented by the vessels as per the COLREGs, thus ensuring that the likelihood of the encounter developing into a collision incident is very low.
16.3.3.1 Frequency of Occurrence
- The frequency of occurrence is considered to be extremely unlikely based on the available sea room, consideration of historical incident data, and the embedded mitigation in place to manage project vessel movements and activities.
16.3.3.2 Severity of Consequence
- The severity of consequence is considered to be serious.
16.3.3.3 Significance of Risk
- Overall, the frequency of occurrence is considered to be extremely unlikely and the severity of consequence is deemed to be serious. The risk will therefore be of tolerable significance.
16.3.3.4 Additional Mitigation and Residual Risk
- No additional shipping and navigation mitigation is considered necessary because the likely risk, in the absence of mitigation beyond the embedded mitigation measures outlined in section 18.1, is ALARP and not significant in EIA terms.
16.4 Vessel To Structure Allision Risk
16.4 Vessel To Structure Allision Risk
- The spatial extent of the impact is considered small given that a vessel must be in close proximity to a structure in the Array during construction for an allision incident to occur. The forms of allision considered are:
- powered allision;
- drifting allision; and
- internal allision.
- These are discussed separately for each phase, with a combined impact significance ranking provided.
16.4.1 Construction Phase
16.4.1 Construction Phase
16.4.1.1 Powered Allision
- Powered allision risk may be caused by human/navigational error, unfamiliarity with the Array and/or a failure of an aid to navigation.
- Experience from previous under construction offshore wind farms indicates that Masters regularly choose to transit greater than 1 nm from construction works. In doing so, vessels are unlikely to navigate close enough to a structure to create an allision risk. There is a distance of 27 nm between the Array and Seagreen 1 Offshore Wind Farm, the closest baseline offshore wind farm, which provides notable sea room for safe navigation.
- Based on the modelling (see section 15.4.3), with the main commercial route deviations in place and assuming all structures are installed, the base case annual powered vessel to structure allision frequency is estimated to be 6.91×10⁻³, corresponding to a return period of approximately one in 145 years.
- The impact will be present throughout the construction phase which may last for up to eight years and will cover a greater spatial extent as more structures are installed. Safety zones of up to 50 m around partially completed or completed but not yet fully commissioned surface piercing structures will be in place and assist with ensuring that vessels are aware of the presence of structures. Where identified as necessary via risk assessment undertaken in advance of any given activity (which will include consideration of the other mitigation measures in place), a guard vessel may also be used, which will alert passing vessels to the presence of the ongoing construction. Furthermore, the use of lighting and marking as required by the NLB and the MCA (including for partially completed structures), charting of the buoyed construction area and promulgation of information will allow vessels to passage plan a safe route in advance. It should also be noted that commercial vessels are expected to comply with international and Flag State regulations (including the COLREGs and SOLAS). Consultation with the NLB to establish agreement on lighting and marking will be undertaken post-consent. With these embedded mitigation measures in place, it is considered unlikely that a powered allision incident will occur.
- From historical incident data, there have been no reported instances of a powered allision involving a third-party vessel with a pre-commissioned wind farm structure in the UK.
- The most likely consequences in the event of a powered allision incident are minor damage to property with the vessel able to resume passage and undertake a full inspection at the next port. However, this will depend on multiple factors including the energy of the impact, structural integrity of the vessel and the sea state at the time. Given the potential for a non-steel construction, commercial fishing vessels and recreational vessels are considered more vulnerable. Although considered less likely allision could involve the vessel foundering resulting in PLL and the environmental consequence of pollution. The Applicant’s MPCP will be implemented to reduce the environmental effects should pollution occur.
16.4.1.2 Drifting Allision
- Drifting allision risk may be caused by mechanical or technical failure, adverse weather and/or a navigational system error. A vessel adrift may only develop into an allision situation if in proximity to a pre-commissioned structure. This is only the case where the adrift vessel is located in proximity to the buoyed construction area and the wind and/or tide directs the vessel towards a structure.
- As discussed in relation to powered allision risk, it is likely that commercial vessels will deviate to avoid the buoyed construction area. As such, it is likely that associated allision risk would be highest to pre-commissioned structures on the periphery of the Array. Smaller vessels may still choose to transit through, and as such may come in proximity to internal structures.
- Based on the modelling (see section 15.4.4), with the main commercial route deviations in place, the base case annual drifting vessel to structure allision frequency is estimated to be 2.16×10⁻⁴, corresponding to a return period of approximately one in 4,619 years.
- For drifting allision incidents, the adrift vessel would initiate its emergency response procedures to avoid a Closest Point of Approach (CPA) with a structure resulting in an allision. This may include emergency anchoring following a check of the relevant nautical charts (thus ensuring that the anchor deployment does not lead to other impacts such as anchor snagging on a subsea cable), noting this would depend on the vessel and water depths. These measures may also include the use of thrusters (depending on availability and power supply). Moreover, under SOLAS obligations (IMO, 1974), other nearby vessels including project vessels (via marine coordination) may be able to render assistance, depending on the type and size of vessel.
- From historical incident data, there have been no reported instances of a drifting allision involving a third-party vessel with a pre-commissioned wind farm structure in the UK.
- Should a drifting allision occur, the consequences will be similar to those noted for the case of a powered allision including the unlikely worst case of foundering and pollution. In the highly unlikely scenario of a drifting allision incident resulting in pollution, the implementation of the MPCP will reduce the environmental risk. Additionally, a drifting vessel is likely to be moving at a reduced speed compared to a powered vessel dependent on conditions, thus reducing the energy of the impact, including in the case of a recreational vessel under sail.
16.4.1.3 Internal Allision
- As noted in the discussion on third-party vessel to third-party vessel collision risk, it is likely that only smaller vessels (e.g. fishing, recreation) may choose to transit through the Array during the construction phase. On this basis it is considered very unlikely that a commercial vessel would be involved in an internal allision.
- Minimum spacing between structures of 1,000 m is considered sufficient for safe internal navigation, i.e. keeping clear of the structures in the Array. The final layout will be agreed with both NLB and MCA, noting these discussions will include consideration of ensuring safe internal navigation.
- As with any passage, any vessel navigating in or near the Array is expected to passage plan in accordance with SOLAS Chapter V (IMO, 1974), and promulgation of information will ensure that such vessels have good awareness of the works being undertaken. Charting of the buoyed construction area will further increase mariner awareness.
- The Applicant will apply for safety zones of radius 500 m around structures where construction is underway, with 50 m pre-commissioning safety zones applied for around structures where work is not underway during the construction phase. These safety zones would make clear to passing mariners the areas which should be avoided to reduce allision risk.
- Should an internal allision occur, the consequences will be similar to those noted in the discussion for the case of a powered allision, including the unlikely worst case of foundering and pollution. In the highly unlikely scenario of an internal allision incident resulting in pollution, the implementation of the MPCP will reduce the environmental risk.
16.4.1.4 Frequency of Occurrence
- The frequency of occurrence is considered to be extremely unlikely based on the available sea room, outputs of the modelling, and consideration of historical incident data.
16.4.1.5 Severity of Consequence
- The severity of consequence is considered to be serious.
16.4.1.6 Significance of Risk
- Overall, the frequency of occurrence is considered to be extremely unlikely and the severity of consequence is deemed to be serious. The risk will therefore be of tolerable significance.
16.4.1.7 Additional Mitigation and Residual Risk
- No additional shipping and navigation mitigation is considered necessary because the likely risk, in the absence of mitigation beyond the embedded mitigation measures outlined in section 18.1, is ALARP and not significant in EIA terms.
16.4.2 Operation and Maintenance Phase
16.4.2 Operation and Maintenance Phase
16.4.2.1 Powered Allision
- Powered allision risk may be caused by human/navigational error, unfamiliarity with the Array and/or a failure of an aid to navigation.
- Experience from previous operational offshore wind farms indicates that Masters regularly choose to transit greater than 1 nm from an array, with it being likely that the deviations established during construction will remain in place during the operation and maintenance phase. In doing so, vessels are unlikely to navigate close enough to a structure to create an allision risk. There is a distance of 27 nm between the Array and the Seagreen 1 Offshore Wind Farm, the closest baseline offshore wind farm, which provides notable sea room for safe navigation.
- Based on the modelling (see section 15.4.3), with the main commercial route deviations in place, the base case annual powered vessel to structure allision frequency is estimated to be 6.91×10⁻³, corresponding to a return period of approximately one in 145 years.
- The structures will be lit and marked as directed by the MCA and NLB and in compliance with IALA G1162 (IALA, 2021b) to ensure passing mariner awareness (e.g. lights, sound signals, AIS AtoN). Additionally, commercial vessels are expected to comply with international and Flag State regulations (including the COLREGs and SOLAS) and will be able to passage plan in advance given the promulgation of information relating to the Array, including display of the structure locations on appropriate nautical charts.
- NLB raised during consultation (section 4) that contingency of overall lighting and marking would need to be considered, in particular in a scenario where a wind turbine with a key AtoN was towed from the Array for maintenance. Appropriate measures for this scenario will be agreed as part of the LMP process.
- RYA Scotland raised during consultation that outage of marine lights should be rectified in a timely manner (section 4). Associated measures and procedures will be detailed in the outline Aids to Navigation Management Plan, provided in volume 4, appendix 26, annex A, noting that IALA Availability targets will be set out in the LMP (outline LMP provided in volume 4, appendix 26).
- Based on historical incident data (see section 9.6.1), there have been two reported instances of a third-party vessel alliding with an operational wind farm structure in the UK (one in the Irish Sea and one in the Southern North Sea). Both of these incidents involved a fishing vessel, with a RNLI lifeboat attending on both occasions and a helicopter deployed in one case.
- The most likely consequences in the event of a powered allision incident are as per the equivalent construction phase impact, namely minor damage to property. Although considered less likely allision could involve the vessel foundering resulting in PLL and the environmental consequence of pollution. The Applicant’s MPCP will be implemented to reduce the environmental effects should pollution occur.
16.4.2.2 Drifting Allision
- Drifting allision risk may be caused by mechanical or technical failure, adverse weather and/or a navigational system error. A vessel adrift may only develop into an allision situation if in proximity to a structure and this is only the case where the adrift vessel is located in proximity to the Array and the wind and/or tide directs the vessel towards a structure.
- Based on the modelling (see section 15.4.4), with the main commercial route deviations in place, the base case annual drifting vessel to structure allision frequency is estimated to be 2.16×10⁻⁴, corresponding to a return period of approximately one in 4,619 years.
- For drifting allision incidents, the adrift vessel would initiate its emergency response procedures to avoid a CPA with a structure resulting in an allision. This may include emergency anchoring following a check of the relevant nautical charts (thus ensuring that the anchor deployment does not lead to other impacts such as anchor snagging on a subsea cable), noting this would depend on the vessel and water depths. These measures may also include the use of thrusters (depending on availability and power supply). Moreover, under SOLAS obligations (IMO, 1974), other nearby vessels including project vessels associated with operation and maintenance (via marine coordination) may be able to render assistance, depending on the type and size of vessel.
- Based on historical incident data (see section 9.6.1), there have been no instances of a third-party vessel alliding with a UK operational wind farm structure whilst Not Under Command (drifting).
- The most likely consequences in the event of a drifting allision incident are as per the equivalent construction phase impact, namely minor damage to property. Although considered less likely allision could involve the vessel foundering resulting in PLL and the environmental consequence of pollution. The Applicant’s MPCP will be implemented to reduce the environmental effects should pollution occur. The consequences are less likely to be severe for a drifting allision incident given that the speed at which the impact occurs (and subsequent energy of the impact) will generally be dictated by the wind and/or tidal speeds.
16.4.2.3 Internal Allision
- As per the impact on vessel displacement, it is anticipated that commercial fishing vessels and recreational vessels may choose to navigate internally within the Array, particularly in favourable weather conditions. However, consultation input indicated this may be less likely than within a fixed foundation project. Therefore, an internal allision risk exists for such smaller craft. However, due to the distance offshore of the Array, fishing and recreational vessel traffic volume is expected to be low and this was reflected in the vessel traffic data and input from consultees.
- From historical incident data, there has been two reported instances of a third-party vessel alliding with an operational wind farm structure in the UK. Both of these incidents involved a fishing vessel, with a RNLI lifeboat attending on both occasions and a helicopter deployed in one case. Given that the size of the Array and the promulgation of information, there is likely to be a reasonable level of awareness of the Array meaning that such an incident is unlikely to occur at the Array.
- The base case annual fishing vessel to structure allision frequency is estimated to be 4.08×10⁻², corresponding to a return period of approximately one in 24 years. This is high compared to that estimated for other UK offshore wind farm developments and is reflective of the conservatism of the model, which assumes that fishing vessel activity and volume will not change after installation of the structures. However, it was noted during consultation (see section 4) that fishing vessels may be more likely avoid the Array than a fixed foundation offshore wind farm.
- Comfort with internal navigation will likely increase throughout the lifetime of the Array and appropriate lighting and marking (agreed with the NLB and MCA, in compliance with IALA G1162 (IALA, 2021b)) will be in place to increase awareness of the structure locations including internally. The final Array layout will be agreed through the DSLP via consultation with the MCA and NLB, and this will include agreement of a clear identification (ID) marking system on the structures, with each structure clearly displaying its ID visible in all directions, facilitating safe internal navigation. The structure locations will also be displayed on appropriate nautical charts.
- The most likely consequences in the event of an allision incident are as per the equivalent construction phase impact, namely minor damage to property. Although considered less likely allision could involve the vessel foundering resulting in PLL and the environmental consequence of pollution. The Applicant’s MPCP will be implemented to reduce the environmental effects should pollution occur. The consequences are less likely to be severe for an internal allision incident given that the vessel will be likely transiting at lower speeds whilst in the Array, reducing the severity of impact.
16.4.2.4 Frequency of Occurrence
- The frequency of occurrence is therefore considered to be extremely unlikely based on the available sea room, outputs of the modelling, and consideration of historical incident data.
16.4.2.5 Severity of Consequence
- The severity of consequence is therefore considered to be serious.
16.4.2.6 Significance of Risk
- Overall, the severity of consequence is deemed to be serious and the frequency of occurrence is considered to be remote. The risk will therefore be of tolerable significance.
16.4.2.7 Additional Mitigation and Residual Risk
- No additional shipping and navigation mitigation is considered necessary because the likely risk, in the absence of mitigation beyond the embedded mitigation measures outlined in section 18.1, is ALARP and not significant in EIA terms.
16.4.3 Decommissioning Phase
16.4.3 Decommissioning Phase
- Since the methods used to remove infrastructure are expected to be similar to those used for installation, this impact is expected to be similar in nature to the equivalent construction phase impact. In particular, a buoyed decommissioning area analogous to the buoyed construction area will be in place and it is anticipated that third-party vessels will be unlikely to enter. Pre-decommissioning or partially removed structures will be similar in nature to pre-commissioning or partially completed structures, and the movement of third-party vessels within and around the buoyed decommissioning area is anticipated to be similar to that within and around the buoyed construction area.
16.4.3.1 Frequency of Occurrence
- The frequency of occurrence is considered to be extremely unlikely based on the available sea room, outputs of the modelling, and consideration of historical incident data.
16.4.3.2 Severity of Consequence
- The severity of consequence is considered to be serious.
16.4.3.3 Significance of Risk
- Overall, the frequency of occurrence is considered to be extremely unlikely and the severity of consequence is deemed to be serious. The risk will therefore be of tolerable significance.
16.4.3.4 Additional Mitigation and Residual Risk
- No additional shipping and navigation mitigation is considered necessary because the likely risk in the absence of further mitigation (beyond the embedded mitigation measures outlined in section 18.1) is ALARP and not significant in EIA terms.
16.5 Reduced Access to Local Ports and Harbours
16.5 Reduced Access to Local Ports and Harbours
16.5.1 Construction Phase
16.5.1 Construction Phase
- The closest port or harbour to the Array is the Port of Aberdeen, located approximately 44 nm to the north‑west, on the east coast of Scotland. Given the distance offshore of the Array and the anticipated deviations for the main commercial routes, it is not anticipated that there will be any notable impact on vessel approaches to and from local ports above and beyond the deviations outlined for the vessel displacement impacts associated with the buoyed construction area or the construction activities therein. Regardless, details of construction activities including the presence of safety zones and any advisory safe passing distances, as defined by risk assessment, will be suitably promulgated to increase awareness of ongoing construction activities.
- It should be noted that there are also no pilot boarding stations, port authority limits or VTS areas in proximity to the Array given its distance offshore and as such these services will not be impacted.
- Up to 7,902 return trips by construction vessels (including site preparation activities) may be made throughout the construction phase and will include vessels which are RAM, noting this will include towing operations. It is not yet known which ports will be used for construction, however, regardless of ports used, all project vessels will be managed by marine coordination, including the use of traffic management procedures. Project vessels will also carry AIS and be compliant with Flag State regulations including the COLREGs. These measures will ensure any impacts on access to ports used are reduced.
- The most likely consequences of the impact are increased journey times and distances due to the presence of the buoyed construction area and project vessels, as per the vessel displacement impact. The MDS may include disruption to schedules, but this is considered highly unlikely given the international nature of routeing in the area and the ability to passage plan to reduce timing impacts. No effect is anticipated on port related services such as pilotage.
16.5.1.1 Frequency of Occurrence
- The frequency of occurrence is considered to be remote based on the embedded mitigation in place to manage project vessel movements.
16.5.1.2 Severity of Consequence
- The severity of consequence is considered to be minor.
16.5.1.3 Significance of Risk
- Overall, the severity of consequence is deemed to be remote and the frequency of occurrence is considered to be minor. The risk will, therefore, be of broadly acceptable significance.
16.5.1.4 Additional Mitigation and Residual Risk
- No additional shipping and navigation mitigation is considered necessary because the likely risk in the absence of further mitigation (beyond the embedded mitigation measures outlined in section 18.1) is ALARP and not significant in EIA terms.
16.5.2 Operation and Maintenance Phase
16.5.2 Operation and Maintenance Phase
- As noted for the equivalent construction phase impact, the closest port or harbour to the Array is the Port of Aberdeen. Again, given the distance offshore of the Array and the anticipated deviations for the main commercial routes, it is not anticipated that there will be any notable impact on vessel approaches to and from local ports above and beyond the deviations outlined for the vessel displacement impact. Given the distance offshore, there are also no pilot boarding stations, port authority limits or VTS areas in proximity to the Array. Details of major maintenance activities including the presence of safety zones and any advisory safe passing distances, as defined by risk assessment, will be suitably promulgated to increase awareness of ongoing operation and maintenance activities.
- Up to 508 return trips annually from vessels may be made throughout the operation and maintenance phase and will include vessels which are RAM. It is not yet known which ports will be used; regardless as per the construction phase, project vessels will be managed by marine coordination, carry AIS and be compliant with relevant Flag State regulations. These measures will ensure any impacts on access to ports used are reduced as far as is practicable.
- The most likely consequences of the impact are as per the equivalent construction phase impact, namely increased journey times and distances. The MDS may include disruption to schedules, but this is considered highly unlikely given the international nature of routeing in the area and the ability to passage plan to reduce timing impacts. No effect is anticipated on port related services such as pilotage.
16.5.2.1 Frequency of Occurrence
- The frequency of occurrence is considered to be remote based on the embedded mitigation in place to manage project vessel movements.
16.5.2.2 Severity of Consequence
- The severity of consequence is considered to be minor.
16.5.2.3 Significance of Risk
- Overall, the severity of consequence is deemed to be minor and the frequency of occurrence is considered to be remote. The effect will, therefore, be of broadly acceptable significance.
16.5.2.4 Additional Mitigation and Residual Risk
- No additional shipping and navigation mitigation is considered necessary because the likely risk in the absence of further mitigation (beyond the embedded mitigation measures outlined in section 18.1) is ALARP and not significant in EIA terms.
16.5.3 Decommissioning Phase
16.5.3 Decommissioning Phase
- Since the methods used to remove infrastructure are expected to be similar to those used for installation, this impact is expected to be similar in nature to the equivalent construction phase impact. In particular, the number of return trips per year by decommissioning vessels will be similar and a buoyed decommissioning area analogous to the buoyed construction area will be in place.
- The impact will be present throughout the decommissioning phase which is expected to be of similar duration to the construction phase (i.e. maximum of 8 years). Since the anticipated deviations associated with the main commercial routes accessing a local port and the volumes of vessel traffic on such routes are the same as for the equivalent construction phase impact, similar impact is likely.
16.5.3.1 Frequency of Occurrence
- The frequency of occurrence is considered to be remote based on the embedded mitigation in place to manage project vessel movements.
16.5.3.2 Severity of Consequence
- The severity of consequence is considered to be minor.
16.5.3.3 Significance of Risk
- Overall, the severity of consequence is deemed to be minor and the frequency of occurrence is considered to be remote. The risk will, therefore, be of broadly acceptable significance.
16.5.3.4 Additional Mitigation and Residual Risk
- No additional shipping and navigation mitigation is considered necessary because the likely risk in the absence of further mitigation (beyond the embedded mitigation measures outlined in section 18.1) is ALARP and not significant in EIA terms.
16.6 Loss of Station
16.6 Loss of Station
16.6.1 Construction phase
16.6.1 Construction phase
- The MCA require under their Regulatory Expectations on Moorings for Floating Wind and Marine Devices (MCA and HSE, 2017) that developers arrange TPV of the mooring systems by an independent and competent person/body. The Regulatory Expectations state that TPV is a “continuous activity”, and that if any modifications to a system occur or if new information becomes available with regard to its reliability, additional TPV would be required. This TPV will facilitate management of any risk of failure of the mooring lines.
- On this basis, the potential for loss of station is considered unlikely, noting that for a total loss of station, all moorings would be required to fail (based on the MDS there may be up to six mooring lines per foundation). There have been no reports to date of loss of stations from floating UK offshore wind farms.
- The Regulatory Expectations (MCA and HSE, 2017) also require the provision of continuous monitoring either by GPS or other suitable means. The Applicant will put such a system in place, with each wind turbine continuously monitored to ensure any failure is quickly identified, and with capability of being tracked in the event of a loss of station as detailed in MGN 654.
- The most likely consequences are failure of a single mooring line leading to a larger excursion zone than typical. As a worst case, total mooring line failure could lead to a drifting platform leading to a collision.
16.6.1.1 Frequency of Occurrence
- The frequency of occurrence is considered to be negligible based on the embedded mitigation in place in terms of TPV, monitoring and tracking.
16.6.1.2 Severity of Consequence
- The severity of consequence is considered to be serious.
16.6.1.3 Significance of Risk
- Overall, the severity of consequence is deemed to be serious and the frequency of occurrence is considered to be negligible. The risk will, therefore, be of broadly acceptable significance.
16.6.1.4 Additional Mitigation and Residual Risk
- No additional shipping and navigation mitigation is considered necessary because the likely risk in the absence of further mitigation (beyond the embedded mitigation measures outlined in section 18.1) is ALARP and not significant in EIA terms.
16.6.2 Operation and Maintenance Phase
16.6.2 Operation and Maintenance Phase
- The same mitigations in terms of TPV and monitoring details for the construction phase will apply during the operation and maintenance phase, based on the requirements of the Regulatory Expectations on Moorings for Floating Wind and Marine Devices (MCA and HSE, 2017) and MGN 654 (MCA, 2021).
- On this basis, the potential for loss of station is considered unlikely, noting that for a total loss of station, all moorings would be required to fail (based on the MDS there may be up to six mooring lines per foundation), and in the event that mooring lines did fail, monitoring and tracking procedures will be in place.
- The most likely consequences are failure of a single mooring line leading to a larger excursion zone than typical. As a worst case, total mooring line failure could lead to a drifting platform leading to a collision.
16.6.2.1 Frequency of Occurrence
- The frequency of occurrence is considered to be negligible based on the embedded mitigation in place such as TPV of project infrastructure, and implementation of a continuous discrete monitoring system.
16.6.2.2 Severity of Consequence
- The severity of consequence is considered to be serious.
16.6.2.3 Significance of Risk
- Overall, the severity of consequence is deemed to be serious and the frequency of occurrence is considered to be negligible. The risk will, therefore, be of broadly acceptable significance.
16.6.2.4 Additional Mitigation and Residual Risk
- No additional shipping and navigation mitigation is considered necessary because the likely risk in the absence of further mitigation (beyond the embedded mitigation measures outlined in section 18.1) is ALARP and not significant in EIA terms.
16.6.3 Decommissioning Phase
16.6.3 Decommissioning Phase
- The decommissioning phase is considered to be generally analogous to the construction phase in reverse and therefore the likelihood of loss of station during the decommissioning phase is considered to be the same as for the construction phase.
16.6.3.1 Frequency of Occurrence
- The frequency of occurrence is considered to be negligible based on the embedded mitigation in place such as TPV of project infrastructure, and implementation of a continuous discrete monitoring system.
16.6.3.2 Severity of Consequence
- The severity of consequence is considered to be serious.
16.6.3.3 Significance of Risk
- Overall, the severity of consequence is deemed to be serious and the frequency of occurrence is considered to be negligible. The risk will, therefore, be of broadly acceptable significance.
16.6.3.4 Additional Mitigation and Residual Risk
- No additional shipping and navigation mitigation is considered necessary because the likely risk in the absence of further mitigation (beyond the embedded mitigation measures outlined in section 18.1) is ALARP and not significant in EIA terms.
16.7 Reduction of Underkeel Clearance as a Result of Subsea Infrastructure
16.7 Reduction of Underkeel Clearance as a Result of Subsea Infrastructure
16.7.1 Construction Phase
16.7.1 Construction Phase
- During the construction phase, there may be a need to wet store subsea components including the mooring lines and subsea cables within the Array. During this time, the components would be left on or tethered to the seabed. It is not expected that any components will be an underkeel risk during this period given it is likely that they will be close to the seabed. However, final plans will be confirmed via the Construction Management Statement (CMS) which will be approved by MD-LOT in consultation with the MCA and NLB (i.e. it will be confirmed via the CMS that suitable underkeel clearance will be available during the construction phase).
- It is noted that the buoyed construction area in place during the construction phase means it is anticipated that third-party vessels will be unlikely to enter on a regular basis based on consultation input and experience of other UK offshore wind farms. This includes the physical marking of the buoys themselves, and the display of the buoyed construction area on appropriate nautical charts.
- Should an underwater allision occur, the most likely consequences are minor damage to property and minor reputational effects on business but no perceptible effect on people. Although considered less likely, a more serious interaction could involve the vessel foundering resulting in PLL and the environmental consequence of pollution. The Applicant’s MPCP will be implemented to reduce the environmental impacts should pollution occur.
16.7.1.1 Frequency of Occurrence
- The frequency of occurrence is considered to be extremely unlikely based on deep water depths within the site boundary.
16.7.1.2 Severity of Consequence
- The severity of consequence is considered to be serious.
16.7.1.3 Significance of Risk
- Overall, the severity of consequence is deemed to be serious and the frequency of occurrence is considered to be extremely unlikely. The risk will, therefore, be of tolerable significance and ALARP.
16.7.1.4 Additional Mitigation and Residual Risk
- No secondary shipping and navigation mitigation is considered necessary because the likely risk in the absence of further mitigation (beyond the embedded mitigation) is of tolerable significance and ALARP which is not significant in EIA terms.
16.7.2 Operation and Maintenance Phase
16.7.2 Operation and Maintenance Phase
- During the operational phase, vessels navigating in proximity to the floating substructures associated with the Array may be at risk of interaction with either the mooring lines, or any underwater elements of the floating substructures not visible from the surface including the subsea cables. The level of risk will depend on the clearance available above the subsea elements of the substructures (in particular the mooring lines and buoyant sections of dynamic cables).
- Up to 681 nm (1,261 km) of inter-array cables and 127 nm (236 km) of interconnector cables may be in place during the operation and maintenance phase. For both the static portion of the inter-array cables and the interconnector cables, the minimum burial depth anticipated to be 0.4 m, subject to CBRA confirmation. Where cable burial is not possible, alternative cable protection methods may be deployed which will again be determined within the CBRA. Charted water depths within the site boundary range from 62 m to 84 m below CD and are therefore sufficiently deep that the reduction of underkeel clearance resulting from the presence of cables on the seabed is not of concern to vessel keels.
- The inter-array cables may utilise buoyancy modules, which can be used to maintain the lazy-S configuration of the dynamic portion of the inter-array cable to allow extension of the cables in response to the floating foundation movements (see volume 1, chapter 3). The requirement for these buoyancy modules and their final design, including their depth below the waterline, are yet to be confirmed. Final design will be confirmed via the DSLP which will be approved by MD-LOT in consultation with the MCA and NLB (i.e. the DSLP will confirm that the final design of the dynamic cables will maintain suitable underkeel clearances).
- Each foundation may utilise up to six mooring lines. There are two substructure types under consideration, namely semi-submersible and Tension Leg Platform (TLP). For semi-submersible substructures, there are three types of mooring configurations: taut, semi-taut and catenary. Section 15.6 has considered an example mooring line arrangement based on worst case parameters. On the basis of the example considered, the vessel with the largest draught recorded within the vessel traffic datasets (16.3 m) would need to transit closer than 100 m to the floating wind turbines to risk interaction with the mooring lines. Based on consultation such a passing distance is very unlikely for any third party vessel, particularly for larger vessels. Final design of the mooring lines will be confirmed via the DSLP which will be approved by MD-LOT in consultation with the MCA and NLB (i.e. the DSLP will confirm that the final design of the mooring lines will maintain suitable underkeel clearances).
- General consultation input has been that commercial vessels are likely to avoid the Array. This aligns with operational experience of other UK wind farms. Any commercial vessels that does access the Array would be unlikely to transit within close proximity to the floating foundations. Smaller vessels may be more comfortable transiting through the Array, however these will have smaller draughts. It was noted during the Hazard Workshop that fishing vessels up to 24 m would likely keep a clearance of around 250 to 300 m and that larger fishing vessels, such as 70 to 90 m pelagic vessels, would likely keep a 500 m clearance and would be unlikely to transit through the Array. It was also noted that recreational vessels would likely keep a minimum of 50 m from wind turbines and that even this distance would be unusual.
- Details of the infrastructure including the floating foundations, mooring lines and subsea cables will be promulgated to increase awareness of the Array and any potential underkeel interaction risk. The locations of the floating foundations would be clearly shown on appropriate nautical charts, and the locations of the anchors and mooring lines will also be provided to the UKHO for charting purposes.
- Should an underwater allision occur, the most likely consequences are minor damage to property and minor reputational effects on business but no perceptible effect on people. Although considered less likely, a more serious interaction could involve the vessel foundering resulting in PLL and the environmental consequence of pollution. The Applicant’s MPCP will be implemented to reduce the environmental effects should pollution occur.
16.7.2.1 Frequency of Occurrence
- The frequency of occurrence is considered to be extremely unlikely based on deep water depths within the site boundary and the consultation input indicating vessels will not pass in close proximity to the structures.
16.7.2.2 Severity of Consequence
- The severity of consequence is considered to be serious.
16.7.2.3 Significance of Risk
- Overall, the severity of consequence is deemed to be extremely unlikely and the frequency of occurrence is considered to be serious. The risk will, therefore, be of tolerable significance.
16.7.2.4 Additional Mitigation and Residual Risk
- No secondary shipping and navigation mitigation is considered necessary because the likely risk in the absence of further mitigation (beyond the embedded mitigation) is of tolerable significance and ALARP which is not significant in EIA terms.
16.7.3 Decommissioning Phase
16.7.3 Decommissioning Phase
- Since the methods used to remove infrastructure are expected to be similar to those used for installation, this impact is expected to be similar in nature to the equivalent construction phase impact. In particular, a buoyed decommissioning area analogous to the buoyed construction area will be in place and it is anticipated that third-party vessels are unlikely to enter on a regular basis.
16.7.3.1 Frequency of Occurrence
- The frequency of occurrence is considered to be extremely unlikely based on deep water depths within the site boundary and the consultation input indicating vessels will not pass in close proximity to the structures.
16.7.3.2 Severity of Consequence
- The severity of consequence is considered to be serious.
16.7.3.3 Significance of Risk
- Overall, the severity of consequence is deemed to be serious and the frequency of occurrence is considered to be extremely unlikely. The risk will, therefore, be of tolerable significance.
16.7.3.4 Additional Mitigation and Residual Risk
- No secondary shipping and navigation mitigation is considered necessary because the likely risk in the absence of further mitigation (beyond the embedded mitigation) is of tolerable significance and ALARP which is not significant in EIA terms.
16.8 Anchor Interaction with Subsea Cables (Including Dynamic Cabling)
16.8 Anchor Interaction with Subsea Cables (Including Dynamic Cabling)
16.8.1 Construction Phase
16.8.1 Construction Phase
- As all cables associated with the Array will be located within the site boundary, anchor interaction with a subsea cables only applies to vessels within the site boundary. However, a buoyed construction area will be in place during the construction phase and it is anticipated that third-party vessels will be unlikely to enter on a regular basis.
- It is also considered unlikely that a vessel would drop anchor in the Array unless it was an emergency (e.g. a drifting incident), given water depths are in excess of 60 m. This aligned with the long-term vessel traffic data (see Appendix E), with no vessels identified as being at anchor over the 12 months assessed in proximity to the Array based on navigational status information broadcast via AIS. In addition, no designated anchorage areas or preferred anchorage locations in proximity to the Array were identified.
- Should an anchor interaction incident occur with the cables, the most likely consequences will be low based on historical anchor interaction incidents, with no damage incurred to the cable or the vessel. As an unlikely worst case, a snagging incident could occur and/or the vessel’s anchor and the cable could be damaged. However, with the embedded mitigation measures in place including charting and cable burial/protection, this risk will be reduced. For commercial fishing vessels or recreational vessels the consequences may also include compromised stability of the vessel, however, water depths are such that small vessels are very unlikely to attempt dropping anchor.
- As for vessel anchors, there is a risk that fishing gear may interact with any cables. It is the responsibility of the fishers to dynamically risk assess whether it is safe to undertake fishing activities within the Array and to make a decision as to whether or not to fish. This decision will be informed by a number of factors, which will include the charted locations of infrastructure within the Array.
16.8.1.1 Frequency of Occurrence
- The frequency of occurrence is considered to be extremely unlikely given very low frequency of baseline anchoring and the use of cable burial/protection and charting.
16.8.1.2 Severity of Consequence
- The severity of consequence is considered to be moderate.
16.8.1.3 Significance of Risk
- Overall, the severity of consequence is deemed to be moderate and the frequency of occurrence is considered to be extremely unlikely. The risk will, therefore, be of broadly acceptable significance.
16.8.1.4 Additional Mitigation and Residual Risk
- No additional shipping and navigation mitigation is considered necessary because the likely risk in the absence of further mitigation (beyond the embedded mitigation measures outlined in section 18.1) is ALARP and not significant in EIA terms.
16.8.2 Operation and Maintenance Phase
16.8.2 Operation and Maintenance Phase
- During the operation and maintenance phase, vessels may be more likely to enter into the Array following removal of the buoyed construction area, however, consultation input indicated entry may be less frequent than at fixed foundation offshore wind farm developments given the presence of subsea components including mooring lines and dynamic cables may dissuade vessel entry.
- Scenarios which may lead to a vessel dropping anchor include the following (noting that water depths in the Array are in excess of 60 m, meaning the latter two scenarios are considered particularly unlikely):
- vessel anchoring in an emergency over cable (e.g. to avoid drifting into a structure, of into an area of busy traffic);
- vessel dropping anchor inadvertently (e.g. mechanical failure);
- planned anchoring where vessel is unaware of presence of infrastructure; and
- vessel dragging anchor over subsea cable following anchor failure.
- Due to the distance offshore of the Array and local water depths, anchoring activity is expected to be very limited. This aligned with the vessel traffic assessment, with no vessels identified as being at anchor over the 12 months assessed in proximity to the Array based on navigational status information broadcast via AIS. In addition, no designated anchorage areas or preferred anchorage locations in proximity to the Array were identified.
- In line with Regulation 34 of SOLAS (IMO, 1974), the charted location of any hazards should be taken into consideration as part of the decision making process of where to anchor. The locations of cables, structure locations and mooring lines will be provided to the UKHO for charting purposes, and as such mariners will be able to include the infrastructure within their decision making processes.
- Cable protection will primarily be by seabed burial where practicable. The extent and method by which the static portion of the inter-array cables and the interconnector cables will be buried will depend on the results of a detailed seabed survey of the final inter-array and interconnector cable routes and associated CBRA. Where cable burial is not practicable, alternative cable protection methods may be deployed which will again be determined within the CBRA.
- It is noted that there will be sections of cables between the seabed and the floating substructures. Interaction with these sections is considered an unlikely event given water depths and the presence of infrastructure means anchoring is unlikely to be attempted in the vicinity of the foundations (outside of an emergency).
- Should an anchor interaction incident occur with the cables, the most likely consequences will be low based on historical anchor interaction incidents, with no damage incurred to the cable or the vessel. As an unlikely worst case, a snagging incident could occur and/or the vessel’s anchor and the cable could be damaged. However, with the embedded mitigation measures in place, this risk will be reduced. For commercial fishing vessels or recreational vessels the consequences may also include compromised stability of the vessel, however, water depths are such that small vessels are very unlikely to attempt dropping anchor.
- As for vessel anchors, there is a risk that fishing gear may interact with any cables. It is the responsibility of the fishers to dynamically risk assess whether it is safe to undertake fishing activities within the Array and to make a decision as to whether or not to fish. This decision will be informed by a number of factors, which will include the charted locations of infrastructure within the Array e.g., on UKHO charts, and other electronic charts as appropriate. Further assessment of impacts associated with fishing gear is provided in volume 2, chapter 12.
16.8.2.1 Frequency of Occurrence
- The frequency of occurrence is considered to be extremely unlikely given very low frequency of baseline anchoring and the use of cable burial/protection and charting.
16.8.2.2 Severity of Consequence
- The severity of consequence is considered to be moderate.
16.8.2.3 Significance of Risk
- Overall, the severity of consequence is deemed to be moderate and the frequency of occurrence is considered to be extremely unlikely. The risk will, therefore, be of broadly acceptable significance.
16.8.2.4 Additional Mitigation and Residual Risk
- No additional shipping and navigation mitigation is considered necessary because the likely risk in the absence of further mitigation (beyond the embedded mitigation measures outlined in section 18.1) is ALARP and not significant in EIA terms.
16.8.3 Decommissioning Phase
16.8.3 Decommissioning Phase
- Since the methods used to remove infrastructure are expected to be similar to those used for installation, this impact is expected to be similar in nature to the equivalent construction phase impact. In particular, a buoyed decommissioning area analogous to the buoyed construction area will be in place and it is anticipated that third-party vessels will be unlikely to enter on a regular basis.
- Static cable sections may be left in situ, noting dynamic cable sections will be removed. Cables left in situ will remain charted and will be located in the site boundary where water depths mean that deliberate anchoring is unlikely.
16.8.3.1 Frequency of Occurrence
- The frequency of occurrence is considered to be negligible given very low frequency of baseline anchoring, the use of cable burial/protection and charting, and increased familiarity with the project post construction.
16.8.3.2 Severity of Consequence
- The severity of consequence is considered to be moderate.
16.8.3.3 Significance of Risk
- Overall, the severity of consequence is deemed to be moderate and the frequency of occurrence is considered to be negligible. The risk will, therefore, be of broadly acceptable significance.
16.8.3.4 Additional Mitigation and Residual Risk
- No additional shipping and navigation mitigation is considered necessary because the likely risk in the absence of further mitigation (beyond the embedded mitigation measures outlined in section 18.1) is ALARP and not significant in EIA terms.
16.9 Anchor Interaction with Mooring Lines
16.9 Anchor Interaction with Mooring Lines
16.9.1 Construction Phase
16.9.1 Construction Phase
- Noting water depths in the vicinity of the site boundary, the visible presence and display on charts of the buoyed construction area and promulgation of information, it is considered unlikely that vessels would attempt to anchor in the vicinity of the mooring lines (which may be wet stored during the construction phase). It is noted that this aligns with the baseline anchoring assessment undertaken on the 12 months of vessel traffic data (see Appendix E) which did not identify any anchoring activity based on the information broadcast via AIS.
- As for vessel anchors, there is a risk that fishing gear may interact with any mooring lines. It is the responsibility of the fishers to dynamically risk assess whether it is safe to undertake fishing activities within the Array and to make a decision as to whether or not to fish. This decision will be informed by a number of factors, which will include the charted locations of infrastructure within the Array, e.g. on UKHO charts, and other electronic charts as appropriate. Further assessment of impacts associated with fishing gear is provided in volume 2, chapter 12.
- There is limited data available with regard to anchor and gear interaction with mooring lines and floating substructures due to lack of precedent of large scale floating wind farms, however, consequences are likely to be similar to that of the cables.
16.9.1.1 Frequency of Occurrence
- The frequency of occurrence is considered to be negligible given very low frequency of baseline anchoring and charting of infrastructure.
16.9.1.2 Severity of Consequence
- The severity of consequence is considered to be moderate.
16.9.1.3 Significance of Risk
- Overall, the severity of consequence is deemed to be moderate and the frequency of occurrence is considered to be negligible. The risk will, therefore, be of broadly acceptable significance.
16.9.1.4 Additional Mitigation and Residual Risk
- No additional shipping and navigation mitigation is considered necessary because the likely risk in the absence of further mitigation (beyond the embedded mitigation measures outlined in section 18.1) is ALARP and not significant in EIA terms.
16.9.2 Operation and Maintenance Phase
16.9.2 Operation and Maintenance Phase
- During the operation and maintenance phase, vessels may be more likely to enter into the Array following removal of the buoyed construction area, however consultation input indicates entry may be less frequent than at fixed foundation offshore wind farm developments (see section 4).
- Noting water depths in the vicinity of the Array, the visible presence of the surface aspects of the floating substructures and display on charts of the infrastructure, it is considered unlikely that vessels would attempt to anchor in the vicinity of the mooring lines.
- As for vessel anchors, there is a risk that fishing gear may interact with any mooring lines. It is the responsibility of the fishers to dynamically risk assess whether it is safe to undertake fishing activities within the Array and to make a decision as to whether or not to fish. This decision will be informed by a number of factors, which will include the charted locations of infrastructure within the Array, e.g. on UKHO charts, and other electronic charts as appropriate.
- As noted during the equivalent construction phase impact, there are limited data available with regards to anchor interaction with mooring lines and floating substructures, however, consequences are likely to be similar to that of the cables.
16.9.2.1 Frequency of Occurrence
- The frequency of occurrence is considered to be negligible given very low frequency of baseline anchoring and charting of infrastructure.
16.9.2.2 Severity of Consequence
- The severity of consequence is considered to be moderate.
16.9.2.3 Significance of Risk
- Overall, the severity of consequence is deemed to be moderate and the frequency of occurrence is considered to be negligible. The risk will, therefore, be of broadly acceptable significance.
16.9.2.4 Additional Mitigation and Residual Risk
- No additional shipping and navigation mitigation is considered necessary because the likely risk in the absence of further mitigation (beyond the embedded mitigation measures outlined in section 18.1) is ALARP and not significant in EIA terms.
16.9.3 Decommissioning Phase
16.9.3 Decommissioning Phase
- Since the methods used to remove infrastructure are expected to be similar to those used for installation, this impact is expected to be similar in nature to the equivalent construction phase impact. In particular, a buoyed decommissioning area analogous to the buoyed construction area will be in place and it is anticipated that third-party vessels will not enter. It is also noted that it is intended that all mooring lines will be removed as part of the decommissioning process.
16.9.3.1 Frequency of Occurrence
- The frequency of occurrence is considered to be negligible given very low frequency of baseline anchoring and charting of infrastructure.
16.9.3.2 Severity of Consequence
- The severity of consequence is considered to be moderate.
16.9.3.3 Significance of Risk
- Overall, the severity of consequence is deemed to be moderate and the frequency of occurrence is considered to be negligible. The risk will, therefore, be of broadly acceptable significance.
16.9.3.4 Additional Mitigation and Residual Risk
- No additional shipping and navigation mitigation is considered necessary because the likely risk in the absence of further mitigation (beyond the embedded mitigation measures outlined in section 18.1) is ALARP and not significant in EIA terms.
16.10 Reduction in Search and Rescue Capability
16.10 Reduction in Search and Rescue Capability
16.10.1 Construction Phase
16.10.1 Construction Phase
- The construction phase will lead to an increased level of vessels and personnel in the area over baseline levels. On this basis there may be an increase in the number of incidents requiring emergency response over baseline rates.
- Up to 7,902 return trips from construction vessels (including site preparation) may be made throughout the construction phase and will include vessels which are RAM. The presence of project vessels will increase the likelihood of an incident, with the potential to diminish emergency response capability.
- Baseline incident rates are considered low in the area based on the data studied, with an average of less than one incident per year indicated within the MAIB, RNLI and helicopter taskings datasets. It is also noted that to date, there have only been 13 reported allision or collision incidents associated with offshore wind farms in the UK (see section 9.6.1). While it should be considered that this only covers allisions and collisions, it is still not anticipated that the construction phase would notably increase the observed baseline incident rates.
- Any on-site project vessels and resources associated with the construction phase will form additional resource to respond to any incidents in the area in liaison with the MCA, both in terms of incidents associated with construction (i.e. self-help resources), but also incidents occurring outside of the Array to third‑party vessels.
- As required under MGN 654, the Applicant will produce and submit an ERCoP to the MCA detailing how they would cooperate and assist in the event of an incident including consideration of additional project resources that will be available (e.g. project vessels associated with construction). The initial ERCoP will specifically cover the construction phase.
- The most likely consequence is a delay caused emergency response request but without notable impact on the operation. As a worst case the delay could lead to PLL
16.10.1.1 Frequency of Occurrence
- The frequency of occurrence is considered to be remote based on consideration of the historical incident data and the embedded mitigation in place including compliance with MGN 654.
16.10.1.2 Severity of Consequence
- The severity of consequence is considered to be serious.
16.10.1.3 Significance of Risk
- Overall, the severity of consequence is deemed to be serious and the frequency of occurrence is considered to be remote. The risk will therefore be of tolerable significance.
16.10.1.4 Additional Mitigation and Residual Risk
- No additional shipping and navigation mitigation is considered necessary because the likely risk in the absence of further mitigation (beyond the embedded mitigation measures outlined in section 18.1) is ALARP and not significant in EIA terms.
16.10.2 Operation and Maintenance Phase
16.10.2 Operation and Maintenance Phase
- The operation and maintenance phase will lead to an increased level of vessels and personnel in the area over baseline levels, however it is likely to be less than during the construction phase (when more vessels will be present and more activity being undertaken). On this basis there may be an increase in the number of incidents requiring emergency response over baseline rates, albeit likely at lower rates than during the construction phase.
- As per the equivalent construction phase discussion, baseline incident rates are considered low in the area, and it is considered unlikely that incident rates will rise notably based on the study of allision and collision incidents that have occurred at other UK offshore wind farms (see section 9.6.1).
- Any on-site project vessels and resources associated with the operation and maintenance phase will form additional resource to respond to any incidents in the area in liaison with the MCA, both in terms of incidents associated with the ongoing operation and maintenance (i.e. self help resources), but also incidents occurring outside of the Array to third‑party vessels.
- As required under MGN 654 (MCA, 2021), the Applicant will produce and submit an ERCoP to the MCA for approval detailing how they would cooperate and assist in the event of an incident including consideration of additional project resources that will be available (e.g. project vessels associated with operation and maintenance). The ERCoP will be updated on a regular basis as required by the MCA, and this will include the transfer of the construction phase ERCoP into the operation and maintenance phase ERCoP in advance of the completion of construction. The Applicant will also agree a SAR checklist with the MCA post consent, which will set out the required mitigations of relevance to SAR that will be implemented.
- To maintain suitable SAR access, the final layout of structures will be agreed with the MCA post consent. This will include application of the SAR layout requirements within MGN 654 (MCA, 2021), noting that there may also be a need for use of Helicopter Refuge Areas given the size of the site boundary. The consideration of MGN 654 in addition to agreement of the layout positions with the MCA will maintain suitable SAR access.
- The most likely consequence is a delay caused emergency response request but without notable impact on the operation. As a worst case the delay could lead to PLL.
16.10.2.1 Frequency of Occurrence
- The frequency of occurrence is considered to be remote based on consideration of the historical incident data and the embedded mitigation in place including compliance with MGN 654.
16.10.2.2 Severity of Consequence
- The severity of consequence is considered to be serious.
16.10.2.3 Significance of Risk
- Overall, the severity of consequence is deemed to be serious and the frequency of occurrence is considered to be remote. The risk will, therefore, be of tolerable significance.
16.10.2.4 Additional Mitigation and Residual Risk
- No additional shipping and navigation mitigation is considered necessary because the likely risk in the absence of further mitigation (beyond the embedded mitigation measures outlined in section 18.1) is ALARP and not significant in EIA terms.
16.10.3 Decommissioning Phase
16.10.3 Decommissioning Phase
- Since the methods used to remove infrastructure are expected to be similar to those used for installation, this impact is expected to be similar in nature to the equivalent construction phase impact. In particular, a buoyed decommissioning area analogous to the buoyed construction area will be in place and it is anticipated that third-party vessels would be unlikely to enter on a regular basis.
- This also includes the assumption that the vessels on site associated with decommissioning will form additional resource to respond to any incidents in the area in liaison with the MCA, both in terms of incidents associated with the projects (i.e. self help resources), but also incidents occurring outside of the Array to third party vessels.
- As required under MGN 654 (MCA, 2021), the Applicant will produce and submit an ERCoP to the MCA detailing how they would cooperate and assist in the event of an incident including consideration of additional project resources that will be available (e.g. project vessels associated with decommissioning). The ERCoP will be updated on a regular basis as required by the MCA, and this will include an update prior to decommissioning.
- The most likely consequence is a delay caused emergency response request but without notable impact on the operation. As a worst case the delay could lead to PLL.
16.10.3.1 Frequency of Occurrence
- The frequency of occurrence is considered to be remote based on consideration of the historical incident data and the embedded mitigation in place including compliance with MGN 654.
16.10.3.2 Severity of Consequence
- The severity of consequence is considered to be serious.
16.10.3.3 Significance of Risk
- Overall, the severity of consequence is deemed to be serious and the frequency of occurrence is considered to be remote. The risk will, therefore, be of tolerable significance.
16.10.3.4 Additional Mitigation and Residual Risk
- No additional shipping and navigation mitigation is considered necessary because the likely risk in the absence of further mitigation (beyond the embedded mitigation measures outlined in section 18.1) is ALARP and not significant in EIA terms.
17 Cumulative Risk Assessment
17 Cumulative Risk Assessment
17.1 Increased Vessel to Vessel Collision Risk Resulting from Displacement (Third Party To Third Party)
17.1 Increased Vessel to Vessel Collision Risk Resulting from Displacement (Third Party To Third Party)
- Any displacement associated with the installation of the Proposed offshore export cable(s) cumulatively with the Array will be spatially limited to the area immediately around the installation vessel activities and temporary in nature. Details of the installation would be promulgated in advance via the usual means including Notice to Mariners and Kingfisher bulletins ensuring awareness will be maximised and facilitating passage planning. Once installation was complete, there would be displacement impact other than any maintenance works requiring surface vessel presence (which will likely be an infrequent event).
- Based on the cumulative routeing assessment (section 14.2) which considers all screened in developments, it is anticipated that the majority of vessels will choose to pass inshore of the Array, between Seagreen 1 Offshore Wind Farm and Morven Offshore Wind Farm. Further north, the Flora Floating Offshore Wind Farm may mean that vessels are more likely to pass inshore of the Hywind Offshore Wind Farm, however passing between the Flora Floating Offshore Wind Farm and the Muir Mhor Offshore Wind Farm will also be an option.
- Vessels choosing to pass further offshore may use the sea area between the Array and Bellrock Offshore Wind Farm, noting that general consensus during consultation including the hazard workshop was that there was sufficient sea space to accommodate likely users. There is also the option to pass further offshore, between the Campion Offshore Wind Farm and Bellrock Offshore Wind Farm. Any vessels choosing such passage would need to pass either north or south of the Cedar Offshore Wind Farm.
- The location of the Aspen Offshore Wind Farm is considered as being unlikely to significantly contribute to cumulative deviations, given that as discussed above most vessels on north/south are likely to pass inshore.
- In addition to the Morven Offshore Wind Farm, the proximity of the Bellrock Offshore Wind Farm means that lighting and marking and also charting will need to be considered cumulatively. This will ensure vessels are aware of the projects and are able to passage plan accordingly.
- The frequency of occurrence is considered to be extremely unlikely based on the available sea room, the outputs of the modelling, and consideration of historical incident data. The severity of consequence is considered to be serious. The risk will, therefore, be of tolerable significance. Assuming consultation with the MCA and NLB on the cumulative lighting and marking and charting of the Array and other relevant developments, the risk is considered to be ALARP.
17.2 Displacement from Adverse Weather Routeing
17.2 Displacement from Adverse Weather Routeing
- Any displacement associated with the installation of the Proposed offshore export cable(s) cumulatively with the Array will be spatially limited to the area immediately around the installation vessel activities and temporary in nature. Details of the installation would be promulgated in advance via the usual means including Notice to Mariners and Kingfisher bulletins ensuring awareness will be maximised and facilitating passage planning. Once installation was complete, there would be displacement impact other than any maintenance works requiring surface vessel presence (which will likely be an infrequent event). As such no notable cumulative impact on adverse weather routeing is anticipated.
- There is in excess of 10 nm of navigable sea area between Seagreen 1 Offshore Wind Farm and Morven Offshore Wind Farm, and therefore there is considered to be sufficient sea room to accommodate any additional transits from vessels choosing an inshore passage as a result of adverse weather. It is considered likely based on the cumulative routeing assessment (section 14.2), that most vessels will choose this routeing option for deviation, passing inshore of both the Morven Offshore Wind Farm and the Salamander Offshore Wind Farm.
- Any vessels choosing to pass further offshore will likely use either the sea space between the Array and Bellrock Offshore Wind Farm, or between Campion Offshore Wind Farm and Bellrock Offshore Wind Farm. Any vessels choosing such passage would need to pass either north or south of the Cedar Offshore Wind Farm. However as above, inshore transits are more likely during adverse weather.
- The location of the Aspen Offshore Wind Farm is considered as being unlikely to significantly contribute to cumulative deviations, given that as discussed above most vessels on north/south are likely to pass inshore, including during adverse weather.
- In addition to the Morven Offshore Wind Farm, the proximity of the Bellrock Offshore Wind Farm means that lighting and marking and also charting will need to be considered cumulatively. This will ensure vessels are aware of the projects and are able to passage plan accordingly including during adverse weather.
- The frequency of occurrence is considered to be extremely unlikely based on the available sea room, the outputs of the modelling, and consideration of historical incident data. The severity of consequence is considered to be serious. The risk will, therefore, be of tolerable significance. Assuming consultation with the MCA and NLB on the cumulative lighting and marking and charting of the Array and other relevant developments, the risk is considered to be ALARP.
17.3 Increased Vessel to Vessel Collision Risk (Third Party to Array Vessels)
17.3 Increased Vessel to Vessel Collision Risk (Third Party to Array Vessels)
- Any collision risk associated with the installation or maintenance of the Proposed offshore export cable(s) cumulatively with the Array will be spatially limited to the area immediately around the vessel activities and temporary in nature. Details of the installation and maintenance would be promulgated in advance via the usual means including Notice to Mariners and Kingfisher bulletins ensuring awareness will be increased and facilitating passage planning, thus reducing any collision risk associated with the installation. Any encounters that did occur between a third party vessel and the cable installation vessel would be managed via COLREGs.
- All screened in projects are anticipated to implement similar vessel management mitigations to those implemented for the Array, in particular marine coordination and use of safety zones. It is also noted that the production of a VMP and NSP are standard conditions of consent, and that all vessels associated with screened in projects will be required to comply with COLREGs and SOLAS.
- During the construction phase, there will be elevated levels of vessels on site and in the general area (noting ports are still to be decided). There may be overlap between the construction phase, and the construction phases of other screened in developments. Ports to be used for other developments are also unknown, however, as above vessel movements will all be managed.
- The frequency of occurrence is considered to be extremely unlikely based on the available sea room, consideration of historical incident data, and the embedded mitigation in place to manage project vessel movements and activities. The severity of consequence is considered to be serious. The risk will, therefore, be of tolerable significance, and ALARP.
17.4 Vessel to Structure Allision Risk
17.4 Vessel to Structure Allision Risk
- Based on the cumulative routeing assessment (section 14.2) it is likely that most vessels currently transiting within or near the Array will choose to pass inshore between Seagreen 1 Offshore Wind Farm and Morven Offshore Wind Farm, where there is in excess of 10 nm of width of sea room available for transit (which is considered sufficient to safely accommodate additional vessel transits without unduly increasing allision risk given allision risk is localised to each development).
- Any vessels choosing to pass further offshore will likely use either the sea space between the Array and Bellrock Offshore Wind Farm, or between Campion Offshore Wind Farm and Bellrock Offshore Wind Farm. There is in excess of 10 nm of sea room between Campion Offshore Wind Farm and Bellrock Offshore Wind Farm, and consensus during consultation including at the Hazard Workshop was that the space available between Bellrock Offshore Wind Farm and the Array was also sufficient to manage any associated risk.
- All screened in developments will be required to agree lighting and marking with the NLB to ensure navigational safety including managing allision risk. Similarly, layouts must also be agreed with the MCA and NLB, with these discussions including consideration of internal allision risk. In addition to the Morven Offshore Wind Farm, the proximity of the Bellrock Offshore Wind Farm means that lighting and marking and also charting will need to be considered cumulatively.
- The frequency of occurrence is considered to be extremely unlikely based on the available sea room, outputs of the modelling, and consideration of historical incident data. The severity of consequence is considered to be serious. The risk will, therefore, be of tolerable significance. Assuming consultation with the MCA and NLB on the cumulative lighting and marking and charting of the Array and other relevant developments, the risk is considered to be ALARP.
17.5 Reduced Access to Local Ports and Harbours
17.5 Reduced Access to Local Ports and Harbours
- Any displacement associated with the installation or maintenance of the Proposed offshore export cable(s) cumulatively with the Array will be spatially limited to the area immediately around the vessel activities and temporary in nature. Details of the installation or maintenance would be promulgated in advance via the usual means including Notice to Mariners and Kingfisher bulletins ensuring awareness will be increased and facilitating passage planning. Any cumulative impact on port access is therefore unlikely.
- Given the distance offshore of screened in offshore wind farm developments, there is unlikely to be any direct impact on port access from the structures outside of the cumulative deviations that have already been assessed.
- All screened in developments are likely to be utilising similar vessel management mitigations to those deployed fort the Array, in particular marine coordination. It is also noted that the production of a VMP and NSP are standard conditions of consent. These measures will seek to ensure vessel movements including in and out of port are managed.
- The frequency of occurrence is considered to be negligible considering the extent of the cumulative study area and based on the available sea room. The severity of consequence is considered to be minor. The risk will therefore be of broadly acceptable significance, which is not significant in EIA terms.
17.6 Reduction in SAR Capability
17.6 Reduction in SAR Capability
- Given the low baseline incident rates, there is not considered likely to be a notable effect on emergency response resources on a cumulative level. This takes account of historical data showing that allisions and collisions caused by offshore wind farms do not occur at a high frequency (section 9.6) in combination with there being unlikely to be a notable rise in incidents associated with the installation of the Proposed offshore export cable(s) cumulatively with the Array.
- All screened in projects will be required to produce an ERCoP and agree a SAR checklist with the MCA, meaning that each individual project will have appropriate liaison measures with the MCA in place, and implement suitable SAR mitigations. The relevant MCA guidance (MCA, 2021) also requires that individual ERCoPs consider SAR procedures and liaison on a cumulative basis.
- MCA guidance in the form of MGN 654 (MCA, 2021) also dictates SAR design requirements for offshore wind farms. All screened in projects will need to discuss and agree their layouts with the MCA, and these discussions will include consideration of other local offshore wind farms in proximity. This will ensure SAR operations can continue within the area, with SAR assets being able to access and search individual offshore wind farm layouts.
- The frequency of occurrence is considered to be remote based on consideration of the historical incident data and the embedded mitigation in place including compliance with MGN 654. The severity of consequence is considered to be serious. The risk will therefore be of tolerable significance and ALARP, which is not significant in EIA terms.
18 Risk Control Log
18 Risk Control Log
18.1 Embedded Mitigation
18.1 Embedded Mitigation
- The embedded mitigation measures assumed within the FSA are detailed in Table 18.1.
Table 18.1: Embedded Mitigation
Designed In Measures Adopted as Part of the Array | Justification |
|---|---|
Apply for and implement safety zones during major construction and operation and maintenance activities. Similar approach likely during decommissioning noting this will be a separate application. | Application for safety zones up to 500 m around structures where vessels are undertaking construction work during construction and periods of major operation and maintenance and 50 m around partially completed or completed but not yet fully commissioned surface piercing structures during construction. Advisory temporary safe passing distances to be promulgated to mariners, including fishermen, around installation/maintenance vessels actively engaged in works |
Deployment of a buoyed construction area in agreement with the NLB. | Protects third-party vessels from project vessels involved in construction activities which may be RAM, and partially completed structures. |
Completion of, and adherence to a CBRA. | The CBRA will consider relevant activities in the vicinity of inter-array and interconnector cables and confirm appropriate means of protection taking account of the final inter-array and interconnector cable. The CBRA will identify the appropriate target burial depth to ensure the cable remain buried, or appropriately protected, where target burial depths cannot be achieved, for the duration of Ossian, to minimise the risk of interaction with other sea users or cable exposure. |
Compliance with MGN 654 and its annexes (in particular SAR annex 5 and completion of a SAR checklist) where applicable. | Ensures the final Array layout is suitable for SAR operations and that reductions in underkeel clearance are acceptable. |
Use of guard vessel(s) as required by risk assessment. | Maximises awareness of temporary hazards, and ensures vessel presence where necessary to alert passing mariners to a hazard. |
Layout finalised through the DSLP via consultation with the MCA and NLB. | Ensures the final Array layout is suitable for both surface and air based (for SAR purposes) navigation and is compliant with MGN 654. Will also confirm adherence to key project design conditions including ensuring a safe underkeel clearance is maintained around mooring line arrangements and dynamic cables. |
Development of, and adherence to an LMP. | The LMP will confirm compliance with legal requirements including IALA G1162 (IALA, 2021), with regards to shipping, navigation and aviation marking and lighting to increases awareness of the Array in both day and night conditions for vessel and aviation operators including in restricted visibility and assists with SAR operations. Consideration of UK MGN 654 with respect to wind turbine design and construction, so that recognised safe standards are met with regards to navigational safety and emergency response (search and rescue, salvage and towing, counter pollution). |
Establishment of a Marine Coordinator and communication procedures to manage project vessel movements. | Ensure project vessels are suitably managed to minimise the likelihood of involvement in incidents and ensure the safe operation during all phases of project development. Increases the ability to assist in the event of a third-party incident. |
Production and implementation of a MPCP. | To reduce the potential for release of pollutants from construction, operation and maintenance and decommissioning plant is reduced so far as reasonably practicable. These will likely include designated areas for refuelling where spillages can be easily contained, storage of chemicals in secure designated areas in line with appropriate regulations and guidelines, double skinning of pipes containing hazardous substances, and storage of these substances in impenetrable bunds. All vessels associated with the Array will be required to comply with the standards set out by MARPOL. Measures will be in place to reduce the risk that accidental pollution poses to personnel, third party vessels and the environment. An outline MPCP is provided in volume 4, appendix 21, annex A. |
Appropriate marking of structures including mooring lines on UKHO Admiralty Charts and other electronic charts as appropriate. | Ensure the appropriate marking of structures on UKHO Admiralty Charts to maximise the awareness of the Array allowing vessels to plan their passage in advance. |
Minimum blade tip clearance height of 36 m above LAT | This minimises the risk of blade allision particularly for sailing vessels with a mast and surpasses the requirements set by the RYA policy (RYA, 2019) and MGN 654 (MCA, 2021). |
Development of, and adherence to a Navigational Safety and Vessel Management Plan (NSVMP). | The NSVMP will confirm the types and numbers of vessels that will be engaged in activities associated with the Array and consider vessel coordination including indicative transit route planning (Marine Coordination). All contractors undertaking works to be contractually obliged to ensure compliance with standard offshore policies, including those that prohibit the discarding of objects or materials overboard and that require the rapid recovery of accidentally dropped objects where feasible. Development and issue of a Code of Conduct to all project vessel operators to advise on how to avoid impacts on marine megafauna and interference with fishing activities. Compliance of all project vessels with maritime regulations as adopted by the relevant flag state including the COLREGs IMO, 1974a) and the SOLAS (IMO, 1974b). Promulgation of information for vessel routes, timings and locations, safety zones and advisory safe passing distances as required via Kingfisher Bulletins. Compliance with the Regulatory Expectations on Moorings for Floating Wind and Marine Devices, in particular independent TPV and monitoring/tracking. |
Development and implementation of an ERCoP. | In line with MGN 654 (MCA, 2021) Annex 5 SAR requirements. |
Promulgation of information through timely and efficient posting of NtM, Kingfisher Bulletins and navigational warnings, as appropriate. Information will include but not be limited to vessel routes, timings and locations, safety zones and advisory safe passing distances as required. | Maximises awareness of the Array allowing vessels to passage plan in advance. |
Compliance with the Regulatory Expectations on Moorings for Floating Wind and Marine Devices (HSE and MCA, 2017). | Ensure that the final design is appropriately designed, constructed to an appropriate standard and structural integrity maintained during the operation and maintenance phase of the project. MGN 654 requirement, to manage risk of loss of station and to ensure procedures are in place in the event of loss of station. |
Ossian Array infrastructure will be subject to TPV, where applicable. | Ensure that the final design is appropriately designed, constructed to an appropriate standard and structural integrity maintained during the operation and maintenance phase of the project. |
Installation of remote discrete condition monitoring equipment | Installation of appropriate system, such as sensors, cameras, dataloggers, etc. to ensure the safe and efficient operation of the Array infrastructure. |
Construction Method Statement (CMS) | The CMS will confirm certain construction activities and how these will be managed. This will include plans on wet storage within the Array including available underkeel clearance. |
18.2 Risk Control Log
18.2 Risk Control Log
- Table 18.2 presents a summary of the assessment of shipping and navigation hazards scoped into the risk assessment.
- This includes the frequency of occurrence, severity of consequence and significance of risk for each hazard.
Table 18.2: Risk Control Log – Array In Isolation
Description of Impact | Phase | Severity of Consequence | Frequency of Occurrence | Significance of Risk | Additional Measures | Residual Risk |
|---|---|---|---|---|---|---|
Increased vessel to vessel collision risk resulting from displacement (third-party to third-party) | Construction | Serious | Extremely unlikely | Tolerable | None | Tolerable and ALARP |
Increased vessel to vessel collision risk resulting from displacement (third-party to third-party) | Operation and maintenance | Serious | Extremely unlikely | Tolerable | None | Tolerable and ALARP |
Increased vessel to vessel collision risk resulting from displacement (third-party to third-party) | Decommissioning | Serious | Extremely unlikely | Tolerable | None | Tolerable and ALARP |
Displacement from adverse weather routeing | Construction | Serious | Extremely unlikely | Tolerable | None | Tolerable and ALARP |
Displacement from adverse weather routeing | Operation and maintenance | Serious | Extremely unlikely | Tolerable | None | Tolerable and ALARP |
Displacement from adverse weather routeing | Decommissioning | Serious | Extremely unlikely | Tolerable | None | Tolerable and ALARP |
Increased vessel to vessel collision risk resulting from displacement (third-party to project) | Construction | Serious | Extremely unlikely | Tolerable | None | Tolerable and ALARP |
Increased vessel to vessel collision risk resulting from displacement (third-party to project) | Operation and maintenance | Serious | Extremely unlikely | Tolerable | None | Tolerable and ALARP |
Increased vessel to vessel collision risk resulting from displacement (third-party to project) | Decommissioning | Serious | Extremely unlikely | Tolerable | None | Tolerable and ALARP |
Vessel to structure allision risk | Construction | Serious | Extremely unlikely | Tolerable | None | Tolerable and ALARP |
Vessel to structure allision risk | Operation and maintenance | Serious | Extremely unlikely | Tolerable | None | Tolerable and ALARP |
Vessel to structure allision risk | Decommissioning | Serious | Extremely unlikely | Tolerable | None | Tolerable and ALARP |
Reduced access to local ports and harbours | Construction | Minor | Remote | Broadly acceptable | None | Broadly acceptable |
Reduced access to local ports and harbours | Operation and maintenance | Minor | Remote | Broadly acceptable | None | Broadly acceptable |
Reduced access to local ports and harbours | Decommissioning | Minor | Remote | Broadly acceptable | None | Broadly acceptable |
Loss of station | Construction | Serious | Negligible | Broadly acceptable | None | Broadly acceptable |
Loss of station | Operation and maintenance | Serious | Negligible | Broadly acceptable | None | Broadly acceptable |
Loss of station | Decommissioning | Serious | Negligible | Broadly acceptable | None | Broadly acceptable |
Reduction of underkeel clearance as a result of subsea infrastructure | Construction | Serious | Extremely unlikely | Tolerable | None | Tolerable and ALARP |
Reduction of underkeel clearance as a result of subsea infrastructure | Operation and maintenance | Serious | Extremely unlikely | Tolerable | None | Tolerable and ALARP |
Reduction of underkeel clearance as a result of subsea infrastructure | Decommissioning | Serious | Extremely unlikely | Tolerable | None | Tolerable and ALARP |
Anchor interaction with subsea cables (including dynamic cabling) | Construction | Moderate | Extremely unlikely | Broadly acceptable | None | Broadly acceptable |
Anchor interaction with subsea cables (including dynamic cabling) | Operation and maintenance | Moderate | Extremely unlikely | Broadly acceptable | None | Broadly acceptable |
Anchor interaction with subsea cables (including dynamic cabling) | Decommissioning | Moderate | Negligible | Broadly acceptable | None | Broadly acceptable |
Anchor interaction with mooring lines | Construction | Moderate | Negligible | Broadly acceptable | None | Broadly acceptable |
Anchor interaction with mooring lines | Operation and maintenance | Moderate | Negligible | Broadly acceptable | None | Broadly acceptable |
Anchor interaction with mooring lines | Decommissioning | Moderate | Negligible | Broadly acceptable | None | Broadly acceptable |
Reduction in SAR capability | Construction | Serious | Remote | Tolerable | None | Tolerable and ALARP |
Reduction in SAR capability | Operation and maintenance | Serious | Remote | Tolerable | None | Tolerable and ALARP |
Reduction in SAR capability | Decommissioning | Serious | Remote | Tolerable | None | Tolerable and ALARP |
Table 18.3 Risk Control Log - Cumulative
Description of Impact | Phase | Severity of Consequence | Frequency of Occurrence | Significance of Risk | Additional Measures | Residual Risk |
|---|---|---|---|---|---|---|
Increased vessel to vessel collision risk resulting from displacement (third-party to third-party) | All | Serious | Extremely unlikely | Tolerable | Consultation with the MCA and NLB on the cumulative lighting and marking and charting of the Array and other relevant developments. | Tolerable and ALARP |
Displacement from adverse weather routeing | All | Serious | Extremely unlikely | Tolerable | Consultation with the MCA and NLB on the cumulative lighting and marking and charting of the Array and other relevant developments. | Tolerable and ALARP |
Increased vessel to vessel collision risk resulting from displacement (third-party to project) | All | Serious | Extremely unlikely | Tolerable | None | Tolerable and ALARP |
Vessel to structure allision risk | All | Serious | Extremely unlikely | Tolerable | Consultation with the MCA and NLB on the cumulative lighting and marking and charting of the Array and other relevant developments. | Tolerable and ALARP |
Reduced access to local ports and harbours | All | Minor | Negligible | Broadly acceptable | None | Broadly acceptable |
Reduction in SAR capability | All | Serious | Remote | Tolerable | None | Tolerable and ALARP |
19 Through Life Safety Management
19 Through Life Safety Management
- Health, Safety and Environment Quality (HSEQ) documentation including a Safety Management System (SMS) will be in place for the Array and will be continually updated throughout the development process. The following subsections provide an overview of this documentation and how it will be maintained and reviewed with reference, where required, to specific marine documentation. For the purposes of the Risk Assessment in Section 16 it has been assumed that these measures will be in place.
- Monitoring, reviewing, and auditing will be carried out on all procedures and activities and feedback actively sought. Any designated person (identified in HSEQ documentation), managers, and supervisors are to maintain continuous monitoring of all marine operations and determine if all required procedures and processes are being correctly implemented.
19.1 Incident Reporting
19.1 Incident Reporting
- After any incidents, including near misses, an incident report form will be completed in line with the HSEQ documentation. This will then be assessed for relevant outcomes and reviewed for possible changes required to operations.
- The Applicant will maintain records of investigation and analyse incidents in order to:
- determine underlying deficiencies and other factors that may be causing or contributing to the occurrence of incidents;
- identify the need for corrective action;
- identify opportunities for preventative action;
- identify opportunities for continual improvement; and
- communicate the results of such investigations.
- All investigations shall be performed in a timely manner.
- A database (lessons learnt) of all marine incidents will be developed. It will include the outcomes of investigations and any resulting actions. The Applicant will promote awareness of their potential occurrence and provide information to assist monitoring, inspection and auditing of documentation.
- When appropriate, the designated person (noted within the ERCoP should inform the MCA of any exercise or incidents including any implications on emergency response. The MCA will be invited to take part in incident debriefs should they request.
19.2 Review of Documentation
19.2 Review of Documentation
- The Applicant will be responsible for reviewing and updating all documentation including the risk assessments, ERCoP, SMS and, if required (i.e. if requested by the MCA), will convene a review panel of stakeholders to quantify risk e.g. via a Hazard Workshop process.
- Reviews of the risk register should be made after any of the following occurrences:
- changes to the Array, conditions of operation and prior to decommissioning;
- planned reviews; and
- following an incident or exercise.
- A review of potential risks should be carried out annually. A review of the response charts should be undertaken annually to ensure that response procedures are up to date and should include any amendments from audits, incident reports and identified deficiencies.
19.3 Inspection of Resources
19.3 Inspection of Resources
- All vessels, facilities, and equipment necessary for marine operations associated with the Array are to be subject to appropriate inspection and testing to determine fitness for purpose and availability in relation to their performance standards. This will include monitoring and inspection of all aids to navigation to determine compliance with the performance standards specified by NLB.
19.4 Audit Performance
19.4 Audit Performance
- Auditing and performance review are the final steps in HSEQ management systems. The feedback loop enables an organisation to reinforce, maintain and develop its ability to reduce risks to the fullest extent, and to ensure the continued effectiveness of the system. The Applicant will carry out audits and periodically evaluate the efficiency of the marine safety documentation.
- The audits and possible corrective actions should be undertaken in accordance with standard procedures and results of the audits and reviews should be brought to the attention of all personnel having responsibility in the area involved.
19.5 Safety Management System
19.5 Safety Management System
- The Applicant will manage the risk associated with the activities undertaken at the Array. An integrated SMS, which ensures that the safety and environmental risks of those activities are ALARP, will be established. This includes the use of remote monitoring and switching for aids to navigation to ensure that if a light is faulty then a quick fix can be instigated, which will allow IALA availability requirements to be met.
19.6 Cable Monitoring
19.6 Cable Monitoring
- The subsea cable routes (inter-array and interconnector cables) will be subject to periodic inspection post-construction to monitor the cable protection, including burial depths. Maintenance of the protection will be undertaken as necessary.
- If exposed cables or ineffective protection measures are identified during post-construction monitoring, these would be promulgated to relevant sea users including via Notice to Mariners and Kingfisher Bulletins. Where immediate risk was observed, the Applicant would also employ additional temporary measures (such as a guard vessel or temporary buoyage) until such time as the risk was permanently mitigated in liaison with MCA and NLB.
- Details will be included in full within the assessment of cable burial and protection document, to be produced post-consent.
19.7 Hydrographic Surveys
19.7 Hydrographic Surveys
- As required by Annex 4 of MGN 654 (MCA, 2021) detailed and accurate hydrographic surveys will be undertaken to required MCA periodicity and standards.
19.8 Decommissioning Programme
19.8 Decommissioning Programme
- A Decommissioning Programme will be developed post-consent. With regards to hazards to shipping and navigation, this will also include consideration of the scenario where upon decommissioning and completion of removal operations, an obstruction is left on site (attributable to the Array) which is considered to be a danger to navigation and which it has not proved possible to remove. Such an obstruction may require marking until such time as it is either removed or no longer considered a danger to navigation, the continuing cost of which would need to be met by the Applicant.
20 Summary
20 Summary
- Using baseline data, collision and allision risk modelling and the outputs of consultation, hazards relating to shipping and navigation have been identified for the Array for all phases of the development (construction, operation and maintenance and decommissioning).
20.1 Consultation
20.1 Consultation
- Throughout the NRA process, consultation has been undertaken directly with key shipping and navigation stakeholders. A Hazard Workshop and Regular Operator outreach has also been undertaken. Further details on consultation can be found in section 4.
20.2 Baseline Characterisation
20.2 Baseline Characterisation
20.2.1 Navigational Features
20.2.2 Maritime Incidents
- The maritime incident baseline is presented and detailed in section 9.
- A total of two helicopter taskings occurred within the shipping and navigation study area between April 2015 and March 2023, corresponding to an average of one every four years.
- A total of three incidents of documented by the RNLI as occurring within the shipping and navigation study area between 2013 and 2022, corresponding to one every three to four years. One of these occurred within the site boundary in 2016.
- From MAIB incident data recorded between 2012 and 2021, a total of four incidents occurred within the shipping and navigation study area, corresponding to an average of one incident every two to three years. Two of these incidents occurred within the site boundary itself, in 2015 and 2018.
- A review of older MAIB incident data spanning the previous ten years (2002 to 2011) indicated that the frequency of incidents has seen a minor decline over time in this area. There was a total of nine incidents, corresponding to one per year, with one within the site boundary in 2011.
20.2.3 Vessel Traffic Movements
20.2.3 Vessel Traffic Movements
- The vessel traffic baseline is presented and detailed in section 10.
- Within the shipping and navigation study area, there was an average of nine vessels per day during the winter vessel traffic survey period and 11 vessels per day during the summer vessel traffic survey period. Within the site boundary itself, there was an average of two to three vessels per day during the winter vessel traffic survey period and three to four vessels per day during the summer vessel traffic survey period.
- Oil and gas vessels and cargo vessels were the most common vessel types during both survey periods within the shipping and navigation study area, with cargo vessels being the most common vessel type intersecting the site boundary during both survey periods.
20.3 Vessel Routeing
20.3 Vessel Routeing
- A total of 11 main commercial routes were identified from 12 months of AIS data recorded during 2022. The highest-use main commercial route was a route used by oil and gas vessels between Aberdeen and various oil and gas infrastructure, with an average of 16 to 17 unique vessels per week. Seven of these routes are anticipated to require deviation as a result of the presence of the Array, with the amount of deviation within the shipping and navigation study area ranging from less than 0.1 nm to 5.7 nm.
20.4 Collision and Allision Risk Modelling
20.4 Collision and Allision Risk Modelling
- The collision and allision risk modelling has been presented and discussed in section 14.
- Six scenarios were assessed:
- Pre wind farm with the base case vessel traffic level.
- Pre wind farm with a future case vessel traffic level defined by:
- A 10% increase in traffic; and
- A 20% increase in traffic.
- Post wind farm with the base case traffic level.
- Post wind farm with a future case vessel traffic level defined by:
- A 10% increase in traffic; and
- A 20% increase in traffic.
- Table 20.1 presents a summary of the collision and allision modelling results.
Table 20.1: Risk Results Summary
Risk | Scenario | Annual Frequency | ||
|---|---|---|---|---|
Pre Wind Farm | Post Wind Farm | Increase | ||
Vessel to vessel collision | Base case | 4.14×10⁻⁴ (1 in 2,418 years) | 5.42×10⁻⁴ (1 in 1,845 years) | 1.28×10⁻⁴ |
Future case (10%) | 5.45×10⁻⁴ (1 in 1,835 years) | 7.28×10⁻⁴ (1 in 1,374 years) | 1.83×10⁻⁴ | |
Future case (20%) | 6.33×10⁻⁴ (1 in 1,580 years) | 8.41×10⁻⁴ (1 in 1,188 years) | 2.09×10⁻⁴ | |
Powered vessel to structure allision | Base case | - | 6.91×10⁻³ (1 in 145 years) | - |
Future case (10%) | - | 7.60×10⁻³ (1 in 132 years) | - | |
Future case (20%) | - | 8.29×10⁻³ (1 in 121 years) | - | |
Drifting vessel to structure allision | Base case | - | 2.16×10⁻⁴ (1 in 4,619 years) | - |
Future case (10%) | - | 2.38×10⁻⁴ (1 in 4,199 years) | - | |
Future case (20%) | - | 2.60×10⁻⁴ (1 in 3,849 years) | - | |
Fishing vessel to structure allision | Base case | - | 4.08×10⁻² (1 in 24 years) | - |
Future case (10%) | - | 4.49×10⁻² (1 in 22 years) | - | |
Future case (20%) | - | 4.90×10⁻² (1 in 20 years) | - | |
Total | Base case | 4.14×10⁻⁴ (1 in 2,418 years) | 4.85×10⁻² (1 in 21 years) | 4.81×10⁻² |
Future case (10%) | 5.45×10⁻⁴ (1 in 1,835 years) | 5.35×10⁻² (1 in 19 years) | 5.30×10⁻² | |
Future case (20%) | 6.33×10⁻⁴ (1 in 1,580 years) | 5.84×10⁻² (1 in 17 years) | 5.78×10⁻² | |
20.5 Risk Statement
20.5 Risk Statement
- Using the baseline data, expert opinion, outputs of the Hazard Workshop, stakeholder concerns, and lessons learnt from existing offshore developments, various shipping and navigation hazards have been risk assessed in line with the FSA approach. The full Risk Control Log, including details of hazards, proposed embedded mitigation measures and significance of risk, is presented in section 18.
- All hazards on both an in isolation and cumulative basis are at most tolerable with mitigation.
21 References
21 References
4C Offshore (2018). Wind farm support vessel to the rescue. Lowestoft: 4C Offshore. Available at: https://www.4coffshore.com/news/wind-farm-support-vessel-to-the-rescue-nid8059.html. Accessed on: 01 November 2023.
4C Offshore (2020). Offshore wind vessel joins search for missing pilot. Lowestoft: 4C Offshore. Available at: https://www.4coffshore.com/news/offshore-wind-vessel-joins-search-for-missing-pilot-nid17573.html. Accessed on: 01 November 2023.
Anatec and TCE (2012). Strategic Assessment of Impacts on Navigation of Shipping and Related Effects on Other Marine Activities Arising from the Development of Offshore Wind Farms in the UK REZ. Aberdeen: Anatec.
Anatec (2016). Influence of UK Offshore Wind Farm Installation on Commercial Vessel Navigation: A Review of Evidence. Aberdeen: Anatec.
Anatec (2018). Seagreen Navigational Risk Assessment Addendum. Aberdeen Anatec.
Anatec (2023). Regional Routeing Assessment. Appendix A of A4709-OSS-LTA-01. Aberdeen: Anatec.
Anatec (2023). ShipRoutes Database. Aberdeen: Anatec.
Atlantic Array (2012). Atlantic Array Offshore Wind Farm Draft Environmental Statement Annex 18.3: Noise and Vibration (Anthropogenic Receptors): Predictions of Operational Wind Turbine Noise Affecting Fishing Vessel Crews. Swindon: RWE npower renewables.
BBC (2018). Two rescued from sinking fishing boat in North Sea. London: BBC. Available at: https://www.bbc.co.uk/news/uk-england-norfolk-46101032 . Accessed on: 01 November 2023.
Bristow Group (2022). Bristow Awarded Second-Generation Search and Rescue Aviation Contract by the Maritime and Coastguard Agency. Houston, US. Available at: https://www.bristowgroup.com/news-media/press-releases/detail/511/bristow-awarded-second-generation-search-and-rescue Accessed on: 01 November 2023.
BWEA (2007). Investigation of Technical and Operational Effects on Marine Radar Close to Kentish Flats Offshore Wind Farm. London, UK: BWEA (now RenewableUK), BEIS, MCA and PLA.
CHIRP (2023). Confidential Human Factors Incident Reporting Programme. Available at: https://chirp.co.uk/. Accessed on: 13 December 2023.
DfT (2001). Identification of Marine Environmental High Risk Areas (MEHRAs) in the UK. London: DfT.
Edinburgh Evening News (2021). Mum's horrific inflatable ordeal at East Lothian beach as dinghy is swept out to sea. Edinburgh: Edinburgh Evening News. Available at: https://www.edinburghnews.scotsman.com/lifestyle/family-and-parenting/mums-horrific-inflatable-ordeal-at-east-lothian-beach-as-dinghy-is-swept-out-to-sea-3331559. Accessed on: 01 November 2023.
Energinet (2014). Horns Rev 3 Offshore Wind Farm Technical Report no. 12 – Radio Communication and Radars. Fredericia, Denmark: Energinet.
G+ (2021). G+ Global Offshore Wind Health and Safety Organisation 2020 Incident Data Report. London: Energy Institute.
IALA (2021a). IALA Recommendation O-139 on The Marking of Man-Made Offshore Structures. Edition 2. Saint Germain en Laye, France: IALA.
IALA (2021b). IALA Guidance G1162 on The Marking of Man-Made Offshore Structures. Saint Germain en Laye, France: IALA.
IMO (1972/77). Convention on International Regulations for Preventing Collisions at Sea (COLREGs) – Annex 3. London: IMO.
IMO (2001). Maritime Safety Committee, 74th Session, Agenda Item 5 – Bulk Carrier Safety: Formal Safety Assessment of Life Saving Appliance for Bulk Carriers. London: IMO.
IMO (2018). Revised Guidelines for Formal Safety Assessment (FSA) for Use in the Rule-Making Process. MSC-MEPCC.2/Circ.12/Rev.2. London: IMO.
ITOPF (2023). ITOPF Worldwide Database of Accidental Oil Spills from Tankers, Combined Carriers and Barges.
MAIB (2013). Casualty Definitions Used by the UK MAIB – From 2012. London: MAIB.
Marine Safety Forum (2020). Safety Alert No 20-01. Available at: msf-safety-alert-20.01.pdf (marinesafetyforum.org). Accessed on: 14 December 2023.
MCA and HSE (2017). Regulatory Expectations on Moorings for Floating Wind And Marine Devices. Amendment 2. Southampton: MCA
MCA and QinetiQ (2004). Results of the Electromagnetic Investigations. 2nd Edition. Southampton, UK: MCA and QinetiQ.
MCA (2005). Offshore Wind Farm Helicopter Search and Rescue Trials Undertaken at the North Hoyle Wind Farm. Southampton: MCA.
MCA (2008a). Marine Guidance Note 371 (Merchant and Fishing) Offshore Renewable Energy Installations (OREIs): Guidance on UK Navigational Practice, Safety and Emergency Response Issues. Southampton: MCA.
MCA (2008b). Marine Guidance Note 372 (Merchant and Fishing) Offshore Renewable Energy Installations (OREIs): Guidance to Mariners Operating in the Vicinity of UK OREIs. Southampton: MCA.
MCA (2016). MGN 543 (Merchant and Fishing) Safety of Navigation: Offshore Renewable Energy Installations (OREIs) – Guidance on UK Navigational Practice, Safety and Emergency Response. Southampton, UK: MCA.
MCA (2021). Marine Guidance Note 654 (Merchant and Fishing) Safety of Navigation: Offshore Renewable Energy Installations (OREIs) – Guidance on UK Navigational Practice, Safety and Emergency Response. Southampton: MCA.
MCA (2022). Marine Guidance Note 372 Amendment 1 (Merchant and Fishing) Offshore Renewable Energy Installations (OREIs): Guidance to Mariners Operating in the Vicinity of UK OREIs. Southampton: MCA.
Offshore WIND (2020). Dudgeon Crew Rescues Injured Fishermen. Schiedam, Netherlands: Offshore WIND. Available at: https://www.offshorewind.biz/2020/12/23/dudgeon-crew-rescues-injured-fishermen/. Accessed on: 01 November 2023.
OSPAR (2008). Background Document on Potential Problems Associated with Power Cables Other Than Those for Oil and Gas Activities. Paris, France: OSPAR Convention.
PLA (2005). Interference to Radar Imagery from Offshore Wind Farms. 2nd Nautical Offshore Renewable Energy Liaison (NOREL) WP4. London: PLA.
RenewableUK (2014). Offshore Wind and Marine Energy Health and Safety Guidelines. London: RenewableUK.
Renews (2019). Gwynt y Mor vessel answers rescue call. Winchester: Renews. Available at: https://renews.biz/54133/gwynt-y-mor-vessel-answers-rescue-call/. Accessed on: 01 November 2023.
RNLI (2016). Barrow RNLI rescues crew after fishing vessel collides with wind turbine. Barrow: RNLI. Available at: https://rnli.org/news-and-media/2016/may/26/barrow-rnli-rescues-crew-after-fishing-vessel-collides-with-wind-turbine. Accessed on: 01 November 2023.
RNLI (2022). Early morning call for Bridlington RNLI to assist local fishing boat. Barrow: RNLI. Available at: https://rnli.org/news-and-media/2022/june/09/early-morning-call-for-bridlington-rnli-to-assist-local-fishing-boat. Accessed on: 01 November 2023.
RYA and CA (2004). Sharing the Wind – Recreational Boating in the Offshore Wind Strategic Areas. Southampton and London: RYA and CA.
RYA (2019). The RYA Position on Offshore Renewable Energy Developments: Paper 1 (of 4) – Wind Energy. 5th Edition. Southampton, UK: RYA.
The Isle of Thanet News (2019). Margate RNLI call out to yacht tied to London Array wind turbine. Ramsgate: The Isle of Thanet News. Available at: https://theisleofthanetnews.com/2019/05/16/margate-rnli-call-out-to-yacht-tied-to-london-array-wind-turbine/. Accessed on: 01 November 2023.
Vessel Tracker (2020). One Injured in Hard Impact at Wind Turbine. Vessel Tracker. Available at: https://www.vesseltracker.com/en/Ships/Seacat-Ranger-I1746352.html. Accessed on: 01 November 2023.
Vessel Tracker (2021). Fire Alarm in Main Engine. Hamburg, Germany: Vessel Tracker. [online]. Available at: https://www.vesseltracker.com/en/Ships/Windcat-4-I54184.html. Accessed on: 01 November 2023.
Vessel Tracker (2022). Fishing Vessel Damage in Allision off Hornsea. Hamburg, Germany: Vessel Tracker. Available at: https://www.vesseltracker.com/en/Ships/Elsie-B-I1754032.html. Accessed on: 01 November 2023.
- Marine Guidance Note 654 Checklist
Marine Guidance Note 654 Checklist
- The MGN 654 Checklist can be divided into two distinct checklists, one considering the main MGN 654 guidance document and one considering the Methodology for Assessing Marine Navigational Safety and Emergency Response Risks of OREIs (MCA, 2021) which serves as Annex 1 to MGN 654.
- The checklist for the main MGN 654 guidance document is presented in Table A.1. Following this, the checklist for the MCA’s methodology annex is presented in Table A.2. For both checklists, references to where the relevant information and/or assessment is provided in the NRA is given.
- MGN 654 Checklist for Main Document
Issue | Compliance | Comments |
|---|---|---|
Site and Installation Coordinates. Developers are responsible for ensuring that formally agreed coordinates and subsequent variations of site perimeters and individual OREI structures are made available, on request, to interested parties at relevant project stages, including application for consent, development, array variation, operation and decommissioning. This should be supplied as authoritative Geographical Information System (GIS) data, preferably in Environmental Systems Research Institute (ESRI) format. | ||
Traffic Survey. Includes: | ||
All vessel types. | | Section 10: Vessel Traffic Movements All vessel types are considered with specific breakdowns by vessel type given within the shipping and navigation study area. |
At least 28 days duration, within either 12 or 24 months prior to submission of the Array EIA Report. | | Section 5: Data Sources A total of 28 full days of vessel traffic survey data from December 2022 and July 2023 has been assessed within the shipping and navigation study area. |
Multiple data sources. | | Section 5: Data Sources The vessel traffic survey data includes AIS, Radar and visual observations to maximise coverage of vessels not broadcasting on AIS.
Appendix E: Long-Term Vessel Traffic Movements To assist with the assessment of seasonal variation a long-term AIS dataset covering 12 months in 2022 has also been assessed. |
Seasonal variations. | | Section 5: Data Sources A total of 28 full days of vessel traffic survey data from December 2022 and July 2023 has been assessed within the shipping and navigation study area.
Appendix E: Long-Term Vessel Traffic Movements To assist with the assessment of seasonal variation a long-term AIS dataset covering 12 months in 2022 has also been assessed. |
MCA consultation. | | Section 4: Consultation The MCA has been consulted as part of the NRA process including through the Hazard Workshop and via dedicated meetings. |
General Lighthouse Authority (GLA) consultation. | | Section 4: Consultation The NLB (i.e. the relevant GLA for the Array) has been consulted as part of the NRA process including through the Hazard Workshop and dedicated meetings. |
UK CoS consultation. | | Section 4: Consultation The UK CoS has been consulted as part of the NRA process including through the Hazard Workshop and dedicated meetings. |
Recreational and fishing vessel organisations consultation. | | Section 4: Consultation RYA Scotland, SFF, SFWPA, and the SPFA has been consulted as part of the NRA process including through the Hazard Workshop. |
Port and navigation authorities consultation, as appropriate. | | Section 4: Consultation Forth Ports and the Port of Aberdeen have been consulted as part of the NRA process including through the Hazard Workshop. |
Assessment of the cumulative and individual effects of (as appropriate): | ||
i. Proposed OREI site relative to areas used by any type of marine craft. | | Section 10: Vessel Traffic Movements Vessel traffic data in proximity to the site boundary has been analysed.
Section 16: Risk Assessment The hazards due to the Array have been assessed for each phase.
Section 17: Cumulative Risk Assessment Cumulative risk assessment has been undertaken. |
ii. Numbers, types and sizes of vessels presently using such areas. | | Section 10: Vessel Traffic Movements Vessel traffic data in proximity to the site boundary has been analysed and includes breakdowns of daily vessel count, vessel type and vessel size. |
iii. Non-transit uses of the areas, e.g. fishing, day cruising of leisure craft, racing, aggregate dredging, personal watercraft, etc. | | Section 7: Navigational Features The navigational features of the area surrounding the site boundary have been assessed and the presence, or lack thereof, of areas that can involve non-transit uses identified.
Section 10: Vessel Traffic Movements Vessel traffic data in proximity to the site boundary has been analysed and included (via use of Radar and visual observations in addition to AIS) data representative of fishing vessels and recreational vessels that may be involved in non-transit activities. |
iv. Whether these areas contain transit routes used by coastal or deep-draught vessels on passage. | | Section 11: Base Case Vessel Routeing Main commercial routes have been identified in proximity to the site boundary in the shipping and navigation study area using the principles set out in MGN 654, with these vessels assessed on the basis of draught and whether they are coastal. |
v. Alignment and proximity of the site relative to adjacent shipping lanes. | | Section 7: Navigational Features The navigational features of the area surrounding the site boundary have been assessed and no IMO routeing measures were identified. |
vi. Whether the nearby area contains prescribed routeing schemes or precautionary areas. | | Section 7: Navigational Features The navigational features of the area surrounding the site boundary have been assessed and no prescribed routeing schemes or precautionary areas were identified. |
vii. Proximity of the site to areas used for anchorage (charted or uncharted), safe haven, port approaches and pilot boarding or landing areas. | | Section 7: Navigational Features The navigational features of the area surrounding the site boundary have been assessed. No areas used for anchorage (charted or uncharted), safe havens, port approaches, pilot boarding stations or landing areas were identified. |
viii. Whether the site lies within the jurisdiction of a port and/or navigation authority. | | Section 7: Navigational Features The navigational features of the area surrounding the site boundary have been assessed and it was determined that the site boundary does not intersect the jurisdiction of a port and/or navigation authority. |
ix. Proximity of the site to existing fishing grounds, or to routes used by fishing vessels to such grounds. | | Section 10: Vessel Traffic Movements Fishing vessel movements are considered within the shipping and navigation study area. Detailed analysis of dedicated fishing vessel activities is undertaken in volume 2, chapter 12. |
x. Proximity of the site to offshore firing/bombing ranges and areas used for any marine military purposes. | | Section 7: Navigational Features The navigational features of the area surrounding the site boundary have been assessed including military areas. |
xi. Proximity of the site to existing or proposed submarine cables or pipelines, offshore oil/gas platforms, marine aggregate dredging, marine archaeological sites or wrecks, Marine Protected Areas or other exploration/exploitation sites. | | Section 7: Navigational Features The navigational features of the area surrounding the site boundary have been assessed; submarine cables, pipelines, offshore oil/gas platforms and wrecks were identified. These are considered further in volume 2, chapter 15, and volume 2, chapter 19.
Section 14: Cumulative and Transboundary Overview Considers any cumulative and transboundary impacts from proposed developments. |
xii. Proximity of the site to existing or proposed OREI developments, in cooperation with other relevant developers, within each round of lease awards. | | Section 7: Navigational Features The navigational features of the area surrounding the site boundary have been assessed; the Seagreen 1 Offshore Wind Farm was identified.
Section 14: Cumulative and Transboundary Overview Considers any cumulative and transboundary impacts from proposed developments. |
xiii. Proximity of the site relative to any designated areas for the disposal of dredging spoil or other dumping ground. | | Section 7: Navigational Features The navigational features of the area surrounding the site boundary have been assessed; no spoil or dumping grounds were identified. See volume 2, chapter 15 for further details. |
xiv. Proximity of the site to aids to navigation and/or VTS in or adjacent to the area and any impact thereon. | | Section 7: Navigational Features The navigational features of the area surrounding the site boundary have been assessed; aids to navigation were identified and no VTS was identified. |
xv. Researched opinion using computer simulation techniques with respect to the displacement of traffic and, in particular, the creation of ‘choke points’ in areas of high traffic density and nearby or consented OREI sites not yet constructed. | | Section 15: Collision and Allision Risk Modelling Provides quantification of collision and allision risk resulting from the Array including pinch (or choke) points in proximity to the site boundary. |
xvi. With reference to xv. above, the number and type of incidents to vessels which have taken place in or near to the proposed site of the OREI to assess the likelihood of such events in the future and the potential impact of such a situation. | | Section 9: Emergency Response and Incident Overview Historical vessel incident data published by DfT (section 9.3), RNLI (section 9.4) and MAIB (section 9.5) in proximity to the site boundary has been considered alongside historical offshore wind farm incident data throughout the UK. |
xvii. Proximity of the site to areas used for recreation which depend on specific features of the area. | | Section 10: Vessel Traffic Movements Vessel traffic data in proximity to the site boundary has been analysed which included data representative of recreational vessel activities. |
Predicted effect of OREI on traffic and interactive boundaries. Where appropriate, the following should be determined: | ||
a. The safe distance between a shipping route and OREI boundaries. | | Section 13: Future Case Vessel Traffic A methodology for post wind farm routeing is outlined and includes a minimum distance of 1 nm from offshore installations and existing offshore wind farm boundaries. |
b. The width of a corridor between sites or OREIs to allow safe passage of shipping. | | Section 14: Cumulative and Transboundary Overview Cumulative routeing options are presented which consider the distances between cumulative developments. |
OREI Structures. The following should be determined: | ||
a. Whether any feature of the OREI, including auxiliary platforms outside the main generator site, mooring and anchoring systems, inter-device and export cabling could pose any type of difficulty or danger to vessels underway, performing normal operations, including fishing, anchoring and emergency response. | | Section 15: Collision and Allision Risk Modelling Provides quantification of collision and allision risk resulting from the Array including pinch (or choke) points in proximity to the site boundary
Section 16: Risk Assessment The hazards due to the Array have been assessed for each phase and include consideration of users such as commercial vessels, commercial fishing vessels in transit, recreational vessels, anchored vessels and emergency responders. |
b. Clearances of fixed or floating wind turbines blades above the sea surface are not less than 22 m (above Mean High Water Springs (MHWS) for fixed). Floating turbines allow for degrees of motion. | | Section 6: Project Description The shipping and navigation MDS for wind turbines has been outlined, including the minimum blade clearance. |
c. Underwater devices: i. Changes to charted depth; ii. Maximum height above seabed; and iii. Under keel clearance. | | Section 6: Project Description The shipping and navigation MDS for wind turbines has been outlined, including the cable burial specifications. |
d. Whether structures block or hinder the view of other vessels or other navigational features. | | Section 16: Risk Assessment The hazards due to the Array have been assessed for each phase and include consideration of the potential for vessels navigating in proximity to structures to be visually obscured or inhibit the use of existing aids to navigation. |
The effect of tides, tidal streams and weather. It should be determined whether: | ||
a. Current maritime traffic flows and operations in the general area are affected by the depth of water in which the proposed installation is situated at various states of the tide, i.e. whether the installation could pose problems at high water which do not exist at low water conditions, and vice versa. | | Section 6: Project Description The shipping and navigation MDS for the Array has been outlined and includes the range of existing water depths.
Section 8: Meteorological Ocean Data Meteorological data in proximity to the site boundary has been provided, relating to various states of the tide.
Section 10: Vessel Traffic Movements Vessel traffic data in proximity to the site boundary has been analysed, including vessel draught.
Section 15: Collision and Allision Risk Modelling Provides quantification of collision and allision risk resulting from the Array, a process which includes account of tidal conditions. |
b. The set and rate of the tidal stream, at any state of the tide, has a significant effect on vessels in the area of the OREI site. | | Section 8: Meteorological Ocean Data Meteorological data in proximity to the site boundary has been provided, relating to various states of the tide.
Section 15: Collision and Allision Risk Modelling Provides quantification of collision and allision risk resulting from the Array, a process which includes account of tidal conditions. |
c. The maximum rate tidal stream runs parallel to the major axis of the proposed site layout, and, if so, its effect. | | |
d. The set is across the major axis of the layout at any time, and, if so, at what rate. | | |
e. In general, whether engine failure or other circumstance could cause vessels to be set into danger by the tidal stream, including unpowered vessels and small, low speed craft. | | Section 8: Meteorological Ocean Data Meteorological data in proximity to the site boundary has been provided, relating to various states of the tide.
Section 15: Collision and Allision Risk Modelling Provides quantification of collision and allision risk resulting from the Array, including account of tidal conditions and assessment of whether machinery failure could cause vessels to be set into danger. |
f. The structures themselves could cause changes in the set and rate of the tidal stream. | | Section 8: Meteorological Ocean Data Meteorological data in proximity to the site boundary has been provided, relating to various states of the tide and notes that no effects are anticipated. |
g. The structures in the tidal stream could be such as to produce siltation, deposition of sediment or scouring, affecting navigable water depths in the wind farm area or adjacent to the area. | | Section 8: Meteorological Ocean Data Meteorological data in proximity to the site boundary has been provided, relating to various states of the tide.
Section 16: Risk Assessment The hazards due to the Array have been assessed for each phase and include consideration of the potential for reduction in underkeel clearance. |
h. The site, in normal, bad weather, or restricted visibility conditions, could present difficulties or dangers to craft, including sailing vessels, which might pass in close proximity to it. | | Section 8: Meteorological Ocean Data Meteorological data in proximity to the site boundary has been provided, relating to weather and visibility.
Section 10: Vessel Traffic Movements Vessel traffic data in proximity to the site boundary has been analysed, including recreational vessels.
Section 11.3: Adverse Weather Routeing Alternative vessel routeing in proximity to the site boundary in adverse weather has been identified.
Section 16: Risk Assessment The hazards due to the Array have been assessed for each phase and include consideration of adverse weather routeing. |
i. The structures could create problems in the area for vessels under sail, such as wind masking, turbulence or sheer. | | Section 16: Risk Assessment The hazards due to the Array have been assessed for each phase and include consideration of internal allision risk for vessels under sail. |
j. In general, taking into account the prevailing winds for the area, whether engine failure or other circumstances could cause vessels to drift into danger, particularly if in conjunction with a tidal set such as referred to above. | | Section 16: Risk Assessment The hazards due to the Array have been assessed for each phase and include consideration of drifting allision risk. |
Assessment of access to and navigation within, or close to, an OREI. To determine the extent to which navigation would be feasible within the OREI site itself by assessing whether: | ||
a. Navigation within or close to the site would be safe: | ||
i. For all vessels. | | Section 4: Consultation Section 4.1 outlines Regular Operator consultation undertaken.
Section 11.3: Adverse Weather Routeing Alternative vessel routeing in proximity to the site boundary in adverse weather has been identified.
Section 15: Collision and Allision Risk Modelling Provides quantification of collision and allision risk resulting from the Array, including accounting for weather and tidal conditions.
Section 16: Risk Assessment The hazards due to the Array have been assessed for each phase and include consideration of internal allision risk. |
ii. For specified vessel types, operations and/or sizes. | ||
iii. In all directions or areas. | ||
iv. In specified directions or areas. | ||
v. In specified tidal, weather or other conditions. | ||
b. Navigation in and/or near the site should be prohibited or restricted: | ||
i. For specified vessel types, operations and/or sizes. | | Section 12: Navigation, Communication and Position Fixing Equipment
Section 13: Future Case Vessel Traffic A methodology for post wind farm routeing is outlined and includes a minimum distance of 1 nm from offshore installations and existing offshore wind farm boundaries, i.e. it is assumed that commercial vessels will avoid the site boundary.
Section 16: Risk Assessment The hazards due to the Array have been assessed for each phase and include consideration of vessel displacement. |
ii. In respect of specific activities. | | |
iii. In all areas or directions. | | |
iv. In specified areas or directions. | | |
v. In specified tidal or weather conditions. | | |
c. Where it is not feasible for vessels to access or navigate through the site it could cause navigational, safety or routeing problems for vessels operating in the area, e.g. by preventing vessels from responding to calls for assistance from persons in distress. | |
Section 16: Risk Assessment The hazards due to the Array have been assessed for each phase and include consideration of vessel displacement and emergency response capability. |
d. Guidance on the calculation of safe distance of OREI boundaries from shipping routes has been considered. | | Section 13: Future Case Vessel Traffic A methodology for post wind farm routeing is outlined and includes consideration of the Shipping Route Template (MCA, 2021). |
SAR, maritime assistance service, counter pollution and salvage incident response. | ||
The MCA, through HMCG, is required to provide SAR and emergency response within the sea area occupied by all OREIs in UK waters. To ensure that such operations can be safely and effectively conducted, certain requirements must be met by developers and operators. | ||
a. An ERCoP will be developed for the construction, operation and decommissioning phases of the OREI. | | Section 18: Risk Control Log Outlines the embedded mitigation measures to be implemented to reduce the significance of risk of shipping and navigation hazards including compliance with MGN 654 which includes the provision of an ERCoP. |
b. The MCA’s guidance document Offshore Renewable Energy Installations: Requirements, Guidance and Operational Considerations for Search and Rescue and Emergency Response (MCA, 2021) for the design, equipment and operation requirements will be followed. | | Section 2: Guidance and Legislation Outlines the guidance and legislation used within the NRA including Annex 5 of MGN 654.
Section 18: Risk Control Log Outlines the embedded mitigation measures to be implemented to reduce the significance of risk of shipping and navigation hazards including compliance with MGN 654 and its annexes. |
c. A SAR checklist will be completed to record discussions regarding the requirements, recommendations and considerations outlined in Annex 5 (to be agreed with MCA). | | Section 18: Risk Control Log Outlines the embedded mitigation measures to be implemented to reduce the significance of risk of shipping and navigation hazards including compliance with MGN 654 which includes the completion of the SAR checklist. |
6. Hydrography. In order to establish a baseline, confirm the safe navigable depth, monitor seabed mobility and to identify underwater hazards, detailed and accurate hydrographic surveys are included or acknowledged for the following stages and to MCA specifications: | ||
i. Pre construction: The proposed generating assets area and proposed cable route. | | Section 19: Through Life Safety Management Confirms that hydrographic surveys will be undertaken in agreement with the MCA. |
ii. On a pre-established periodicity during the life of the development. | | |
iii. Post construction: Cable route(s). | | |
iv. Post decommissioning of all or part of the development: the installed generating assets area and cable route. | | |
Communications, Radar and positioning systems. To provide researched opinion of a generic and, where appropriate, site-specific nature concerning whether: | ||
a. The structures could produce radio interference such as shadowing, reflections or phase changes, and emissions with respect to any frequencies used for marine positioning, navigation and timing (PNT) or communications, including GMDSS and AIS, whether ship borne, ashore or fitted to any of the proposed structures, to: | ||
i. Vessels operating at a safe navigational distance. | | Section 12: Navigation, Communication and Position Fixing Equipment Assesses the potential risks associated with the use of navigation, communication and position fixing equipment due to the Array including in relation to radio interference. |
ii. Vessels by the nature of their work necessarily operating at less than the safe navigational distance to the OREI, e.g. support vessels, survey vessels, SAR assets. | | |
iii. Vessels by the nature of their work necessarily operating within the OREI. | | |
b. The structures could produce Radar reflections, blind spots, shadow areas or other adverse effects: | ||
i. Vessel to vessel. | | Section 12: Navigation, Communication and Position Fixing Equipment Assesses the potential risks associated with the use of navigation, communication and position fixing equipment due to the Array including in relation to marine Radar. |
ii. Vessel to shore. | | |
iii. VTS Radar to vessel. | | |
iv. Racon to/from vessel. | | |
c. The structures and generators might produce SONAR interference affecting fishing, industrial or military systems used in the area. | | Section 12: Navigation, Communication and Position Fixing Equipment Assesses the potential risks associated with the use of navigation, communication and position fixing equipment due to the Array including in relation to SONAR. |
d. The site might produce acoustic noise which could mask prescribed sound signals. | | Section 12: Navigation, Communication and Position Fixing Equipment Assesses the potential risks associated with the use of navigation, communication and position fixing equipment due to the Array including in relation to noise. |
e. Generators and the seabed cabling within the site and onshore might produce EMFs affecting compasses and other navigation systems. | | Section 12: Navigation, Communication and Position Fixing Equipment Assesses the potential risks associated with the use of navigation, communication and position fixing equipment due to the Array including in relation to electromagnetic interference. |
Risk mitigation measures recommended for OREI during construction, operation and decommissioning. | ||
Mitigation and safety measures will be applied to the OREI development appropriate to the level and type of risk determined during the EIA. The specific measures to be employed will be selected in consultation with the MCA and will be listed in the Developer’s Array EIA Report. These will be consistent with international standards contained in, for example, SOLAS Chapter V (IMO, 1974), and could include any or all of the following: | ||
i. Promulgation of information and warnings through notices to mariners and other appropriate MSI dissemination methods. | | Section 18: Risk Control Log Outlines the embedded mitigation measures to be implemented to reduce the significance of risk of shipping and navigation hazards including promulgation of information. |
ii. Continuous watch by multi-channel VHF, including DSC. | | Section 18: Risk Control Log Outlines the embedded mitigation measures to be implemented to reduce the significance of risk of shipping and navigation hazards including marine coordination. |
iii. Safety zones of appropriate configuration, extent and application to specified vessels[9]. | | Section 18: Risk Control Log Outlines the embedded mitigation measures to be implemented to reduce the significance of risk of shipping and navigation hazards including the application for Safety Zones. |
iv. Designation of the site as an Area to be Avoided. | | There are no plans to designate the Array as an Area to be Avoided. |
v. Provision of aids to navigation as determined by the GLA. | | Section 18: Risk Control Log Outlines the embedded mitigation measures to be implemented to reduce the significance of risk of shipping and navigation hazards including lighting and marking in accordance with NLB and MCA requirements. |
vi. Implementation of routeing measures within or near to the development. | | There are no plans to implement any new routeing measures in proximity to the Array. |
vii. Monitoring by Radar, AIS, Closed Circuit Television (CCTV) or other agreed means. | | Section 18: Risk Control Log Outlines the embedded mitigation measures to be implemented to reduce the significance of risk of shipping and navigation hazards including the completion of a SAR Checklist. |
viii. Appropriate means for OREI operators to notify, and provide evidence of, the infringement of Safety Zones. | | Section 18: Risk Control Log Outlines the embedded mitigation measures to be implemented to reduce the significance of risk of shipping and navigation hazards including the application for Safety Zones and use of guard vessels, which will be considered in further detail in the Safety Zone Application, submitted post consent. |
ix. Creation of an ERCoP with the MCA’s SAR Branch for the construction phase onwards. | | Section 18: Risk Control Log Outlines the embedded mitigation measures to be implemented to reduce the significance of risk of shipping and navigation hazards including compliance with MGN 654 which include the provision of an ERCoP. |
x. Use of guard vessels, where appropriate. | | Section 18: Risk Control Log Outlines the embedded mitigation measures to be implemented to reduce the significance of risk of shipping and navigation hazards including the use of guard vessels. |
xi. Update NRAs every two years, e.g. at testing sites. | | Not applicable to the Array. |
xii. Device-specific or array-specific NRAs. | | Section 6: Project Description All surface and subsea elements of the Array have been considered in this NRA. |
xiii. Design of OREI structures to minimise risk to contacting vessels or craft. | | Section 15: Collision and Allision Risk Modelling Provides assessment of potential for interaction with subsea mooring lines and dynamic cables (section 15.6). |
xiv. Any other measures and procedures considered appropriate in consultation with other stakeholders. | | Section 18: Risk Control Log Outlines the embedded mitigation measures to be implemented to reduce the significance of risk of shipping and navigation hazards.
Section 19: Through Life Safety Management Outlines how HSEQ documentation will be maintained and reviewed. |
- MGN 654 Annex 1 Checklist
Item | Compliance | Comments |
|---|---|---|
A risk claim is included that is supported by a reasoned argument and evidence. | | Section 16: Risk Assessment The risk assessment provides a risk claim for a range of hazards based on a number of inputs including (but not limited to) baseline data, expert opinion, outputs of the Hazard Workshop, stakeholder concerns and lessons learnt from existing offshore developments. |
Description of the marine environment. | | Section 7: Navigational Features Relevant navigational features in proximity to the site boundary have been described including (but not limited to) other offshore wind farm developments, aids to navigation, pipelines and charted wrecks.
Section 14: Cumulative and Transboundary Overview Potential future developments have been screened in to the cumulative risk assessment where a cumulative or in combination activity has been identified based upon the location and distance from the Array, including consideration of other offshore wind farms. |
SAR overview and assessment. | | Section 9: Emergency Response and Incident Overview Existing SAR resources of relevance to the Array are summarised including the UK SAR operations contract, RNLI stations and assets and HMCG stations.
Section 16: Risk Assessment The risk assessment includes an assessment of how activities associated with the Array may restrict emergency response capability of existing resources. |
Description of the OREI development and how it changes the marine environment. | | Section 6: Project Description The maximum extent of the Array for which any shipping and navigation hazards are assessed is provided including a description of the site boundary, Array infrastructure, timelines and indicative vessel and helicopter numbers during the construction and operation and maintenance phases.
Section 13: Future Case Vessel Traffic Worst case alternative routeing for commercial traffic has been considered. |
Analysis of the marine traffic, including base case and future traffic densities and types. | | Section 10: Vessel Traffic Movements Vessel traffic data in proximity to the Array has been analysed and includes vessel density and breakdowns of vessel type.
Section 13: Future Case Vessel Traffic Future vessel traffic levels have been considered, broken down as increases in commercial vessel activity, commercial fishing vessel and recreational vessel activity, increases in traffic associated with project operations and changes in marine aggregate dredging activities. Additionally, worst case alternative routeing for commercial traffic has been considered. |
Status of the Hazard Log:
| | Section 3: Navigational Risk Assessment Methodology A tolerability matrix has been defined to determine the tolerability (significance) of risks.
Appendix B: Hazard Log The complete Hazard Log is presented and includes all required elements listed in this checklist item. This includes a description of the hazards considered, possible causes, consequences (most likely and worst case) and relevant embedded mitigation measures. Using this information, each hazard is then ranked in terms of frequency of occurrence and severity of consequence to give a tolerability (significance) level. |
NRA:
| | Section 2: Guidance and Legislation MGN 654 and the IMO’s FSA guidelines are the primary guidance documents used for the assessment alongside MGN 372 Amendment 1.
Section 15: Collision and Allision Risk Modelling Provides quantification of collision and allision risk resulting from the Array with the results outlined numerically and graphically, where appropriate. |
Risk control log | | Section 18: Risk Control Log Provides the risk control log which summarises the assessment of shipping and navigation hazards scoped into the risk assessment. This includes the proposed embedded mitigation measures, frequency of occurrence, severity of consequence and significance of risk, per hazard. |
- Hazard Log
Hazard Log
The draft hazard log was produced following the hazard workshop (see section 4.3) and distributed to attendees for comment. The updated hazard log based on feedback received is presented in Table B.1.
The initial hazard log indicated that certain cumulative hazards were unacceptable, and that further consultation was required with the MCA and NLB to determine mitigation. Subsequent consultation is included in section 4, noting the key cumulative mitigation was identified as a cumulative approach to lighting and marking and charting (which will be agreed with NLB and MCA post consent including via the LMP process).
User | Phase (C/O/D) | Embedded Mitigation Measures (Full Descriptions Provided in Separate Sheet) | Possible Causes | Most Likely Consequences | Realistic Most Likely Consequences | Worst Case Consequences | Realistic Worst Case Consequences | Further Mitigation Required | Additional Comments | ||||||||||||
|---|---|---|---|---|---|---|---|---|---|---|---|---|---|---|---|---|---|---|---|---|---|
Consequences | Risk | Consequences | Risk | ||||||||||||||||||
Displacement from Routeing with Potential for Collision | |||||||||||||||||||||
Commercial vessels | C/D | • Buoyed construction/ decommissioning area | • Presence of buoyed construction/ decommissioning area | Displacement with effects on schedules and low impact collision event occurs involving minor vessel damage | 3 | 2 | 2 | 3 | 2 | 2.3 | Broadly Acceptable | Displacement with effects on schedule and collision event occurs involving vessel damage, injury to person and/or pollution | 2 | 4 | 4 | 4 | 4 | 4.0 | Tolerable |
| MCA indicated People should have a ranking of 5 for worst case. The ranking of 4 was retained on the grounds that a higher consequence would lead to a lower frequency. |
O | • Charting of infrastructure | • Presence of surface structures | 2 | 2 | 2 | 3 | 2 | 2.3 | Broadly Acceptable | 2 | 4 | 4 | 4 | 4 | 4.0 | Tolerable | |||||
Commercial fishing vessels in transit | C/D | • Buoyed construction/ decommissioning area | • Presence of buoyed construction/ decommissioning area | Displacement with effects on schedules and low impact collision event occurs involving minor vessel damage | 3 | 2 | 2 | 3 | 2 | 2.3 | Broadly Acceptable | Displacement with effects on routine and collision event occurs involving vessel damage, injury to person and/or pollution | 2 | 4 | 3 | 4 | 4 | 3.8 | Broadly Acceptable |
|
|
O | • Charting of infrastructure | • Presence of surface structures | 2 | 2 | 2 | 3 | 2 | 2.3 | Broadly Acceptable | 2 | 4 | 3 | 4 | 4 | 3.8 | Broadly Acceptable | |||||
Recreational vessels (2.5 to 24m length) | C/D | • Buoyed construction/ decommissioning area | • Presence of buoyed construction/ decommissioning area | Displacement with effects on schedules and low impact collision event occurs involving minor vessel damage | 3 | 2 | 2 | 3 | 2 | 2.3 | Broadly Acceptable | Displacement with effects on routine and collision event occurs involving vessel damage, injury to person and/or pollution | 1 | 4 | 2 | 4 | 4 | 3.5 | Broadly Acceptable |
|
|
O | • Charting of infrastructure | • Presence of surface structures | 2 | 2 | 2 | 3 | 2 | 2.3 | Broadly Acceptable | 1 | 4 | 2 | 4 | 4 | 3.5 | Broadly Acceptable | |||||
Displacement from Adverse Weather Routeing | |||||||||||||||||||||
Commercial vessels | C/D | • Buoyed construction/ decommissioning area | • Presence of buoyed construction/ decommissioning area | Displacement from normal adverse weather preference with no effects on schedule and no safety risks | 5 | 1 | 1 | 1 | 1 | 1.0 | Tolerable | Displacement from normal adverse weather preference with effects on schedule and/or passing further offshore than preferred | 3 | 3 | 3 | 3 | 3 | 3.0 | Tolerable |
|
|
O | • Charting of infrastructure | • Presence of surface structures | 5 | 1 | 1 | 1 | 1 | 1.0 | Tolerable | 3 | 3 | 3 | 3 | 3 | 3.0 | Tolerable | |||||
Commercial fishing vessels in transit | C/D | • Buoyed construction/ decommissioning area | • Presence of buoyed construction/ decommissioning area | Displacement from normal adverse weather preference with no safety risks | 5 | 1 | 1 | 1 | 1 | 1.0 | Tolerable | Displacement from normal adverse weather preference with effects on schedule and/or passing further offshore than preferred | 1 | 3 | 2 | 3 | 3 | 2.8 | Broadly Acceptable |
|
|
O | • Charting of infrastructure | • Presence of surface structures | 5 | 1 | 1 | 1 | 1 | 1.0 | Tolerable | 1 | 3 | 2 | 3 | 3 | 2.8 | Broadly Acceptable | |||||
Recreational vessels (2.5 to 24m length) | C/D | • Buoyed construction/ decommissioning area | • Presence of buoyed construction/ decommissioning area | Displacement from normal adverse weather preference with no safety risks | 1 | 1 | 1 | 1 | 1 | 1.0 | Broadly Acceptable | Displacement from normal adverse weather preference with effects on schedule and/or passing further offshore than preferred | 1 | 3 | 2 | 3 | 3 | 2.8 | Broadly Acceptable |
|
|
O | • Charting of infrastructure | • Presence of surface structures | 1 | 1 | 1 | 1 | 1 | 1.0 | Broadly Acceptable | 1 | 3 | 2 | 3 | 3 | 2.8 | Broadly Acceptable | |||||
Collision Risk (Third-Party with Project Vessel in Transit) | |||||||||||||||||||||
Commercial vessels | C/D | • Application for safety zones | • Project vessels in transit including towing operations | Low impact collision event occurs involving minor vessel damage | 3 | 2 | 2 | 3 | 2 | 2.3 | Broadly Acceptable | Collision event occurs involving vessel damage, injury to person and/or pollution | 2 | 4 | 4 | 4 | 4 | 4.0 | Tolerable |
| Noted importance of vessel management plan (VMP). Indicated that VMP should include consideration of towing operations. |
O | 2 | 2 | 2 | 3 | 2 | 2.3 | Broadly Acceptable | 2 | 4 | 4 | 4 | 4 | 4.0 | Tolerable |
| ||||||
Commercial fishing vessels in transit | C/D | • Application for safety zones | • Project vessels in transit including towing operations | Low impact collision event occurs involving minor vessel damage | 3 | 2 | 2 | 3 | 2 | 2.3 | Broadly Acceptable | Collision event occurs involving vessel damage, injury to person and/or pollution | 3 | 4 | 3 | 4 | 4 | 3.8 | Tolerable |
| Noted importance of VMP. Indicated that VMP should include consideration of towing operations. |
O | 2 | 2 | 2 | 3 | 2 | 2.3 | Broadly Acceptable | 2 | 4 | 3 | 4 | 4 | 3.8 | Broadly Acceptable |
| ||||||
Recreational vessels (2.5 to 24m length) | C/D | • Application for safety zones | • Project vessels in transit including towing operations | Low impact collision event occurs involving minor vessel damage | 3 | 2 | 2 | 3 | 2 | 2.3 | Broadly Acceptable | Collision event occurs involving vessel damage, injury to person and/or pollution | 3 | 4 | 2 | 4 | 4 | 3.5 | Tolerable |
| Noted importance of VMP. Indicated that VMP should include consideration of towing operations. |
O | 2 | 2 | 2 | 3 | 2 | 2.3 | Broadly Acceptable | 2 | 4 | 2 | 4 | 4 | 3.5 | Broadly Acceptable |
| ||||||
Allision Risk (Powered, Drifting or Internal) | |||||||||||||||||||||
Commercial vessels | C/D | • Application for safety zones | • Presence of surface structures | Vessel passes at an unsafe distance resulting in a need to make a late adjustment to course/speed | 4 | 1 | 1 | 1 | 1 | 1.0 | Broadly Acceptable | Allision event occurs involving vessel damage, injury to person and/or pollution | 2 | 4 | 4 | 4 | 4 | 4.0 | Tolerable | Inclusion of contingency plans for navigational lights as part of Lighting and Marking Plan (LMP) process. | Noted that any wind turbine generators (WTGs) towed from site would need consideration if they included a navigational light. |
O | • Charting of infrastructure | • Presence of surface structures | Vessel passes in close proximity resulting in a need to make a late adjustment to course/speed | 4 | 1 | 1 | 1 | 1 | 1.0 | Broadly Acceptable | Allision event occurs involving vessel damage, injury to person and/or pollution | 3 | 4 | 4 | 4 | 4 | 4.0 | Tolerable | Inclusion of contingency plans for navigational lights as part of LMP process. | Noted that any WTGs towed from site would need consideration if they included a navigational light. | |
Commercial fishing vessels in transit | C/D | • Application for safety zones | • Presence of surface structures | Vessel passes in close proximity resulting in a need to make a late adjustment to course/speed | 4 | 1 | 1 | 1 | 1 | 1.0 | Broadly Acceptable | Allision event occurs involving vessel damage, injury to person and/or pollution | 2 | 4 | 3 | 4 | 4 | 4.0 | Tolerable | Inclusion of contingency plans for navigational lights as part of LMP process. | Noted that any WTGs towed from site would need consideration if they included a navigational light. |
O | • Charting of infrastructure | • Presence of surface structures | Vessel passes in close proximity resulting in a need to make a late adjustment to course/speed | 4 | 1 | 1 | 1 | 1 | 1.0 | Broadly Acceptable | Allision event occurs involving vessel damage, injury to person and/or pollution | 3 | 4 | 3 | 4 | 4 | 3.8 | Tolerable | Inclusion of contingency plans for navigational lights as part of LMP process. | Noted that any WTGs towed from site would need consideration if they included a navigational light. | |
Recreational vessels (2.5 to 24m length) | C/D | • Application for safety zones | • Presence of surface structures | Vessel passes in close proximity resulting in a need to make a late adjustment to course/speed | 4 | 1 | 1 | 1 | 1 | 1.0 | Broadly Acceptable | Allision event occurs involving vessel damage, injury to person and/or pollution | 2 | 4 | 2 | 4 | 4 | 3.5 | Broadly Acceptable | Inclusion of contingency plans for navigational lights as part of LMP process. | Noted that any WTGs towed from site would need consideration if they included a navigational light. |
O | • Charting of infrastructure | • Presence of surface structures | Vessel passes in close proximity resulting in a need to make a late adjustment to course/speed | 4 | 1 | 1 | 1 | 1 | 1.0 | Broadly Acceptable | Allision event occurs involving vessel damage, injury to person and/or pollution | 3 | 4 | 2 | 4 | 4 | 3.5 | Tolerable | Inclusion of contingency plans for navigational lights as part of LMP process. | Noted that any WTGs towed from site would need consideration if they included a navigational light. | |
Interference with Marine Navigation, Communication and Position Fixing Equipment | |||||||||||||||||||||
All vessels | C/D | • Compliance with MGN 654 | • Human error relating to adjustment of Radar controls | Structures have no effect upon the Radar, communications and navigation equipment on a vessel | 3 | 1 | 1 | 1 | 1 | 1.0 | Broadly Acceptable | Minor level of Radar interference due to the structures | 2 | 1 | 1 | 1 | 1 | 1.0 | Broadly Acceptable |
|
|
O | • Compliance with MGN 654 | • Human error relating to adjustment of Radar controls | Structures have no effect upon the Radar, communications and navigation equipment on a vessel | 4 | 1 | 1 | 1 | 1 | 1.0 | Broadly Acceptable | Minor level of Radar interference due to the structures | 3 | 1 | 1 | 1 | 1 | 1.0 | Broadly Acceptable |
|
| |
Loss of Station | |||||||||||||||||||||
All vessels | C/D | • Compliance with MGN 654 and MCA Regulatory Expectations | Damage to or failure of mooring line(s) | Failure of a single mooring line leads to temporary increase in the maximum excursion of the floating structure but not full loss of station | 3 | 2 | 2 | 2 | 2 | 2.0 | Broadly Acceptable | Total failure of mooring system leads to drifting of floating structure with risk of collision with vessels | 1 | 4 | 4 | 4 | 4 | 4.0 | Broadly Acceptable |
|
|
All vessels | O | • Compliance with MGN 654 and MCA Regulatory Expectations | Damage to or failure of mooring line(s) | Failure of a single mooring line leads to temporary increase in the maximum excursion of the floating structure but not full loss of station | 3 | 2 | 2 | 2 | 2 | 2.0 | Broadly Acceptable | Total failure of mooring system leads to drifting of floating structure with risk of collision with vessels | 1 | 4 | 4 | 4 | 4 | 4.0 | Broadly Acceptable |
|
|
Interaction with Subsea Mooring Lines or Cables | |||||||||||||||||||||
All vessels | C/D | • Compliance with MGN 654 | • Presence of mooring lines and cables | Vessel passes in close proximity to floating structure resulting in a need to make a late adjustment to course/speed | 4 | 1 | 1 | 1 | 1 | 1.0 | Broadly Acceptable | Vessel passes in proximity to floating structure and makes contact with mooring line or cable | 2 | 4 | 4 | 4 | 4 | 4.0 | Tolerable | MCA and NLB consultation on final design | Noted that bad weather conditions (e.g., strong winds, large swells) may mean subsea elements are more of a risk. |
O | • Compliance with MGN 654 | • Presence of mooring lines and cables | Vessel passes in close proximity to floating structure resulting in a need to make a late adjustment to course/speed | 4 | 1 | 1 | 1 | 1 | 1.0 | Broadly Acceptable | Vessel passes in proximity to floating structure and makes contact with mooring line or cable | 2 | 4 | 4 | 4 | 4 | 4.0 | Tolerable | |||
Vessels dropping anchor | C/D | • Compliance with MGN 654 | Presence of subsea cables or cable protection | Vessel anchors on or drags anchor over an installed cable/protection but no interaction occurs dependent on anchor/burial depth | 3 | 1 | 1 | 1 | 1 | 1.0 | Broadly Acceptable | Vessel anchors on or drags anchor over an installed cable/protection resulting in damage to the cable/protection and/or anchor | 2 | 2 | 1 | 2 | 2 | 1.8 | Broadly Acceptable |
|
|
O | • Compliance with MGN 654 | Presence of subsea cables or cable protection | Vessel anchors on or drags anchor over an installed cable/protection but no interaction occurs dependent on anchor/burial depth | 2 | 1 | 1 | 1 | 1 | 1.0 | Broadly Acceptable | Vessel anchors on or drags anchor over an installed cable/protection resulting in damage to the cable/protection and/or anchor | 1 | 2 | 1 | 2 | 2 | 1.8 | Broadly Acceptable |
|
| |
Reduction in Emergency Response Capability | |||||||||||||||||||||
Emergency responders | C/D | • Compliance with MGN 654 | • Under construction array does not facilitate responder access | Delay to emergency response request | 2 | 1 | 1 | 1 | 2 | 1.3 | Broadly Acceptable | Delay to response request leading to injury to person or loss of life | 1 | 5 | 5 | 5 | 5 | 5.0 | Tolerable |
| Assumes MGN 654 compliant layout. |
O | • Array does not facilitate responder access | 2 | 1 | 1 | 1 | 2 | 1.3 | Broadly Acceptable | 1 | 5 | 5 | 5 | 5 | 5.0 | Tolerable | ||||||
User | Phase (C/O/D) | Embedded Mitigation Measures (Full Descriptions Provided in Separate Sheet) | Possible Causes | Most Likely Consequences | Realistic Most Likely Consequences | Worst Case Consequences | Realistic Worst Case Consequences | Further Mitigation Required | Additional Comments | ||||||||||||
|---|---|---|---|---|---|---|---|---|---|---|---|---|---|---|---|---|---|---|---|---|---|
Consequences | Risk | Consequences | Risk | ||||||||||||||||||
Displacement from Routeing with Potential for Collision | |||||||||||||||||||||
Commercial vessels | C/D | • Buoyed construction/ decommissioning area | • Presence of buoyed construction/ decommissioning areas | Displacement with effects on schedules and low impact collision event occurs involving minor vessel damage | 4 | 2 | 2 | 3 | 2 | 2.3 | Tolerable | Displacement with effects on schedule and collision event occurs involving vessel damage, injury to person and/or pollution | 3 | 4 | 4 | 4 | 4 | 4.0 | Tolerable | MCA and NLB consultation to agree suitable cumulative lighting and marking and layouts. | Considered likely that larger commercial vessels will avoid the area altogether and pass further inshore, however considered possible that some vessels may look to transit between Ossian and the neighbouring projects. General consensus was that additional mitigation on a cumulative basis was needed to manage collision risk. |
O | • Charting of infrastructure | • Presence of surface structures | 3 | 2 | 2 | 3 | 2 | 2.3 | Broadly Acceptable | 3 | 4 | 4 | 4 | 4 | 4.0 | Tolerable | |||||
Commercial fishing vessels in transit | C/D | • Buoyed construction/ decommissioning area | • Presence of buoyed construction/ decommissioning areas | Displacement with effects on routine but no safety risks | 5 | 1 | 1 | 1 | 1 | 1.0 | Tolerable | Displacement with effects on routine and collision event occurs involving vessel damage, injury to person and/or pollution | 4 | 4 | 3 | 4 | 4 | 3.8 | Tolerable | MCA and NLB consultation to agree suitable cumulative lighting and marking and layouts. | It was noted that active fishing or fishing vessel transits could occur in between Ossian and other neighbouring projects, and concerns were raised over interactions with any larger commercial vessels that may transit between the projects. General consensus was that additional mitigation on a cumulative basis was needed to manage collision risk. |
O | • Charting of infrastructure | • Presence of surface structures | 4 | 1 | 1 | 1 | 1 | 1.0 | Broadly Acceptable | 4 | 4 | 3 | 4 | 4 | 3.8 | Tolerable | |||||
Recreational vessels (2.5 to 24m length) | C/D | • Buoyed construction/ decommissioning area | • Presence of buoyed construction/ decommissioning areas | Displacement with effects on routine but no safety risks | 5 | 1 | 1 | 1 | 1 | 1.0 | Tolerable | Displacement with effects on routine and collision event occurs involving vessel damage, injury to person and/or pollution | 2 | 4 | 2 | 4 | 4 | 3.5 | Broadly Acceptable |
| Recreational transits were considered likely to be an infrequent occurrence but may still occur. |
O | • Charting of infrastructure | • Presence of surface structures | 4 | 1 | 1 | 1 | 1 | 1.0 | Broadly Acceptable | 2 | 4 | 2 | 4 | 4 | 3.5 | Broadly Acceptable | |||||
Displacement from Adverse Weather Routeing | |||||||||||||||||||||
Commercial vessels | C/D | • Buoyed construction/ decommissioning area | • Presence of buoyed construction/ decommissioning areas | Displacement from normal adverse weather preference with no effects on schedule and no safety risks | 5 | 1 | 1 | 1 | 1 | 1.0 | Tolerable | Displacement from normal adverse weather preference with effects on schedule due to large deviation and/or passing further offshore than preferred | 4 | 3 | 3 | 3 | 3 | 3.0 | Tolerable | MCA and NLB consultation to agree suitable cumulative lighting and marking and layouts. | Should be considered that prevailing south westerly (SW) winds may mean that transit between wind farms is not preferred in adverse weather |
O | • Charting of infrastructure | • Presence of surface structures | 5 | 1 | 1 | 1 | 1 | 1.0 | Tolerable | 4 | 3 | 3 | 3 | 3 | 3.0 | Tolerable | |||||
Commercial fishing vessels in transit | C/D | • Buoyed construction/ decommissioning area• Charting of infrastructure• Compliance with MGN 654• Promulgation of information | • Presence of buoyed construction/ decommissioning areas• Adverse weather• Construction/ decommissioning vessels which are RAM | Displacement from normal adverse weather preference with no safety risks | 5 | 1 | 1 | 1 | 1 | 1.0 | Tolerable | Displacement from normal adverse weather preference with effects on schedule and/or passing further offshore than preferred | 2 | 3 | 2 | 3 | 3 | 2.8 | Broadly Acceptable | MCA and NLB consultation to agree suitable cumulative lighting and marking and layouts. Consideration of how cumulative projects are charted. | Should be considered that prevailing SW winds may mean that transit between wind farms is not preferred in adverse weather |
O | • Charting of infrastructure | • Presence of surface structures | 5 | 1 | 1 | 1 | 1 | 1.0 | Tolerable | 2 | 3 | 2 | 3 | 3 | 2.8 | Broadly Acceptable | |||||
Recreational vessels (2.5 to 24m length) | C/D | • Buoyed construction/ decommissioning area | • Presence of buoyed construction/ decommissioning areas | Displacement from normal adverse weather preference with no safety risks | 1 | 1 | 1 | 1 | 1 | 1.0 | Broadly Acceptable | Displacement from normal adverse weather preference with effects on schedule and/or passing further offshore than preferred | 2 | 3 | 2 | 3 | 3 | 2.8 | Broadly Acceptable |
| Should be considered that prevailing SW winds may mean that transit between wind farms is not preferred in adverse weather |
O | • Charting of infrastructure | • Presence of surface structures | 1 | 1 | 1 | 1 | 1 | 1.0 | Broadly Acceptable | 2 | 3 | 2 | 3 | 3 | 2.8 | Broadly Acceptable | |||||
Collision Risk (Third-Party with Project Vessel in Transit) | |||||||||||||||||||||
Commercial vessels | C/D | • Application for safety zones | • Project vessels in transit including towing operations | Increased encounters leading to low impact collision | 3 | 2 | 2 | 3 | 2 | 2.3 | Broadly Acceptable | Collision event occurs involving vessel damage, injury to person and/or pollution | 3 | 4 | 4 | 4 | 4 | 4.0 | Tolerable |
| Noted importance of vessel management plan (VMP). Indicated that VMP should include consideration of towing operations. |
O | 2 | 2 | 2 | 3 | 2 | 2.3 | Broadly Acceptable | 3 | 4 | 4 | 4 | 4 | 4.0 | Tolerable |
| ||||||
Commercial fishing vessels in transit | C/D | • Application for safety zones | • Project vessels in transit including towing operations | Increased encounters leading to low impact collision | 3 | 2 | 2 | 3 | 2 | 2.3 | Broadly Acceptable | Collision event occurs involving vessel damage, injury to person and/or pollution | 3 | 4 | 3 | 4 | 4 | 3.8 | Tolerable |
| Noted importance of VMP. Indicated that VMP should include consideration of towing operations. |
O | 2 | 2 | 2 | 3 | 2 | 2.3 | Broadly Acceptable | 2 | 4 | 3 | 4 | 4 | 3.8 | Broadly Acceptable |
| ||||||
Recreational vessels (2.5 to 24m length) | C/D | • Application for safety zones | • Project vessels in transit including towing operations | Increased encounters leading to low impact collision | 3 | 2 | 2 | 3 | 2 | 2.3 | Broadly Acceptable | Collision event occurs involving vessel damage, injury to person and/or pollution | 3 | 4 | 2 | 4 | 4 | 3.5 | Tolerable |
| Noted importance of VMP. Indicated that VMP should include consideration of towing operations. |
O | 2 | 2 | 2 | 3 | 2 | 2.3 | Broadly Acceptable | 2 | 4 | 2 | 4 | 4 | 3.5 | Broadly Acceptable |
| ||||||
Allision Risk (Powered, Drifting or Internal) | |||||||||||||||||||||
Commercial vessels | C/D | • Application for safety zones | • Presence of surface structures | Vessel passes in close proximity resulting in a need to make a late adjustment to course/speed | 4 | 1 | 1 | 1 | 1 | 1.0 | Broadly Acceptable | Allision event occurs involving vessel damage, injury to person and/or pollution | 3 | 4 | 4 | 4 | 4 | 4.0 | Tolerable | Inclusion of contingency plans for navigational lights as part of Lighting and Marking Plan (LMP) process. | Noted that any wind turbine generators towed from site would need consideration if they included a navigational light. |
O | • Charting of infrastructure | • Presence of surface structures | Vessel passes in close proximity resulting in a need to make a late adjustment to course/speed | 4 | 1 | 1 | 1 | 1 | 1.0 | Broadly Acceptable | Allision event occurs involving vessel damage, injury to person and/or pollution | 3 | 4 | 4 | 4 | 4 | 4.0 | Tolerable | |||
Commercial fishing vessels in transit | C/D | • Application for safety zones | • Presence of surface structures | Vessel passes in close proximity resulting in a need to make a late adjustment to course/speed | 4 | 1 | 1 | 1 | 1 | 1.0 | Broadly Acceptable | Allision event occurs involving vessel damage, injury to person and/or pollution | 3 | 4 | 3 | 4 | 4 | 3.8 | Tolerable | Inclusion of contingency plans for navigational lights as part of Lighting and Marking Plan (LMP) process. | Noted that any wind turbine generators towed from site would need consideration if they included a navigational light. |
O | • Charting of infrastructure | • Presence of surface structures | Vessel passes in close proximity resulting in a need to make a late adjustment to course/speed | 4 | 1 | 1 | 1 | 1 | 1.0 | Broadly Acceptable | Allision event occurs involving vessel damage, injury to person and/or pollution | 3 | 4 | 3 | 4 | 4 | 3.8 | Tolerable | |||
Recreational vessels (2.5 to 24m length) | C/D | • Application for safety zones | • Presence of surface structures | Vessel passes in close proximity resulting in a need to make a late adjustment to course/speed | 4 | 1 | 1 | 1 | 1 | 1.0 | Broadly Acceptable | Allision event occurs involving vessel damage, injury to person and/or pollution | 3 | 4 | 2 | 4 | 4 | 3.5 | Tolerable | Inclusion of contingency plans for navigational lights as part of Lighting and Marking Plan (LMP) process. | Noted that any wind turbine generators towed from site would need consideration if they included a navigational light. |
O | • Charting of infrastructure | • Presence of surface structures | Vessel passes in close proximity resulting in a need to make a late adjustment to course/speed | 4 | 1 | 1 | 1 | 1 | 1.0 | Broadly Acceptable | Allision event occurs involving vessel damage, injury to person and/or pollution | 3 | 4 | 2 | 4 | 4 | 3.5 | Tolerable | |||
Interference with Marine Navigation, Communication and Position Fixing Equipment | |||||||||||||||||||||
All vessels | C/D | • Compliance with MGN 654 | • Human error relating to adjustment of Radar controls | Structures have no effect upon the Radar, communications and navigation equipment on a vessel | 5 | 1 | 1 | 1 | 1 | 1.0 | Tolerable | Radar interference due to the structures leading to a large vessels being unaware of presence of a smaller vessel leading to collision | 2 | 4 | 4 | 4 | 4 | 4.0 | Tolerable |
|
|
O | • Compliance with MGN 654 | • Human error relating to adjustment of Radar controls | Structures have no effect upon the Radar, communications and navigation equipment on a vessel | 5 | 1 | 1 | 1 | 1 | 1.0 | Tolerable | Radar interference due to the structures leading to a large vessels being unaware of presence of a smaller vessel leading to collision | 3 | 4 | 4 | 4 | 4 | 4.0 | Tolerable |
|
| |
Loss of Station | |||||||||||||||||||||
All vessels | C/D | • Compliance with MGN 654 and Maritime and Coastguard Agency (MCA) Regulatory Expectations | Damage to or failure of mooring line(s) | Failure of a single mooring line leads to temporary increase in the maximum excursion of the floating structure but not full loss of station | 3 | 2 | 2 | 2 | 2 | 2.0 | Broadly Acceptable | Total failure of mooring system leads to drifting of floating structure with risk of collision with vessels | 2 | 4 | 3 | 4 | 4 | 3.8 | Broadly Acceptable | Recovery and response procedures |
|
All vessels | O | • Compliance with MGN 654 and MCA Regulatory Expectations | Damage to or failure of mooring line(s) | Failure of a single mooring line leads to temporary increase in the maximum excursion of the floating structure but not full loss of station | 3 | 2 | 2 | 2 | 2 | 2.0 | Broadly Acceptable | Total failure of mooring system leads to drifting of floating structure with risk of collision with vessels | 2 | 4 | 3 | 4 | 4 | 3.8 | Broadly Acceptable | Recovery and response procedures |
|
Interaction with Subsea Mooring Lines or Cables | |||||||||||||||||||||
All vessels | C/D | • Compliance with MGN 654 | • Presence of mooring lines and cables | Vessel passes in close proximity to floating structure but no interaction with mooring lines or cables occurs | 4 | 1 | 1 | 1 | 1 | 1.0 | Broadly Acceptable | Vessel passes in proximity to floating structure and makes contact with mooring line or cable | 3 | 4 | 3 | 4 | 4 | 3.8 | Tolerable | MCA and NLB consultation on final design | Noted that bad weather conditions (e.g., strong winds, large swells) may mean subsea elements are more of a risk. |
O | • Compliance with MGN 654 | • Presence of mooring lines and cables | Vessel passes in close proximity to floating structure but no interaction with mooring lines or cables occurs | 4 | 1 | 1 | 1 | 1 | 1.0 | Broadly Acceptable | Vessel passes in proximity to floating structure and makes contact with mooring line or cable | 3 | 4 | 3 | 4 | 4 | 3.8 | Tolerable | |||
Vessels dropping anchor | C/D | • Compliance with MGN 654 | Presence of subsea cables or cable protection | Vessel anchors on or drags anchor over an installed cable/protection but no interaction occurs | 3 | 1 | 1 | 1 | 1 | 1.0 | Broadly Acceptable | Vessel anchors on or drags anchor over an installed cable/protection resulting in damage to the cable/protection and/or anchor | 3 | 2 | 1 | 2 | 2 | 1.8 | Broadly Acceptable |
|
|
O | • Compliance with MGN 654 | Presence of subsea cables or cable protection | Vessel anchors on or drags anchor over an installed cable/protection but no interaction occurs | 2 | 1 | 1 | 1 | 1 | 1.0 | Broadly Acceptable | Vessel anchors on or drags anchor over an installed cable/protection resulting in damage to the cable/protection and/or anchor | 2 | 2 | 1 | 2 | 2 | 1.8 | Broadly Acceptable |
|
| |
Reduction in Emergency Response Capability | |||||||||||||||||||||
Emergency responders | C/D | • Compliance with MGN 654 | • Under construction array does not facilitate responder access | Delay to emergency response request | 3 | 1 | 1 | 1 | 2 | 1.3 | Broadly Acceptable | Delay to response request leading to injury to person or loss of life, in particular in bad weather conditions | 2 | 5 | 5 | 5 | 5 | 5.0 | Tolerable | SAR checklist process, including consideration of VHF and AIS | Assumes MGN 654 compliant layout. |
O | • Array does not facilitate responder access | 3 | 1 | 1 | 1 | 2 | 1.3 | Broadly Acceptable | 2 | 5 | 5 | 5 | 5 | 5.0 | Tolerable | ||||||
- Consequences Assessment
Consequences Assessment
- This appendix presents an assessment of the consequences of collision and allision incidents, in terms of people and the environment, due to the presence of the Array.
- The significance of the impact due to the presence of the Array is also assessed based on risk evaluation criteria and comparison with historical incident data in UK waters[10].
- Risk Evaluation Criteria
Risk Evaluation Criteria Risk to People
- Regarding the assessment of risk to people two measures are considered, namely:
- individual risk; and
- societal risk.
- Individual Risk
- Individual risk considers whether the risk from an incident to a particular individual changes substantially due to the presence of the Array. Individual risk considers not only the frequency of the incident and the consequences (e.g. likelihood of death), but also the individual’s fractional exposure to that risk, i.e. the probability of the individual being in the given location at the time of the incident.
- The purpose of estimating the individual risk is to ensure that individuals who may be affected by the presence of the Array are not exposed to excessive risks. This is achieved by assessing the significance of the change in individual risk resulting from the presence of the Array relative to the UK background individual risk levels.
- Annual risk levels to crew (the annual risk to an average crew member) for different vessel types are presented in Figure C.1, which also includes the upper and lower bounds for risk acceptance criteria as suggested in IMO Maritime Safety Committee 72/16 (IMO, 2001). The annual individual risk level to crew falls within the ALARP region for each of the vessel types presented.
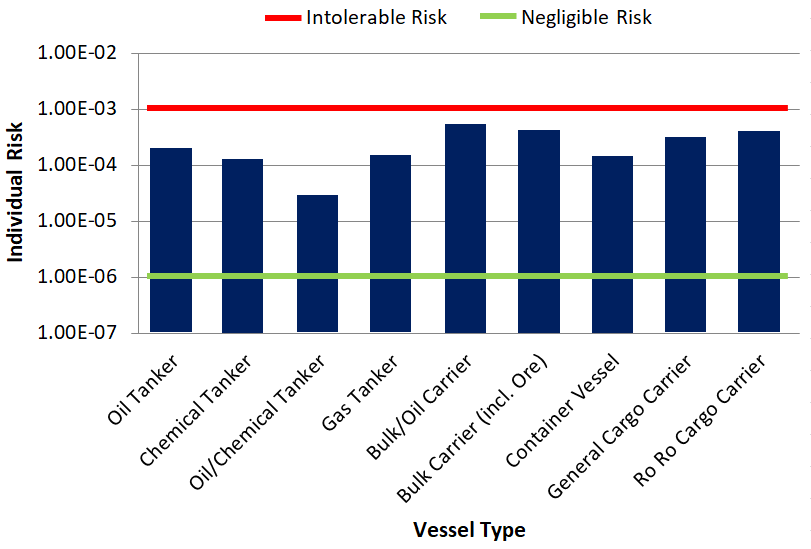
- The typical bounds defining the ALARP regions for decision making within shipping are presented in Table C.1. For a new vessel, the target upper bound for ALARP is set lower since new vessels are expected to benefit (in terms of design) from changes in legislation and improved maritime safety.
Individual | Lower Bound for ALARP | Upper Bound for ALARP |
|---|---|---|
To crew member | 10-6 | 10-3 |
To passenger | 10-6 | 10-4 |
Third-party | 10-6 | 10-4 |
New vessel target | 10-6 | Above values reduced by one order of magnitude |
- On a UK basis, individual risks for various UK industries based on HSE data from 1987 to 1991, historically available on the MCA website. The risks for different industries are presented in Figure C.2.
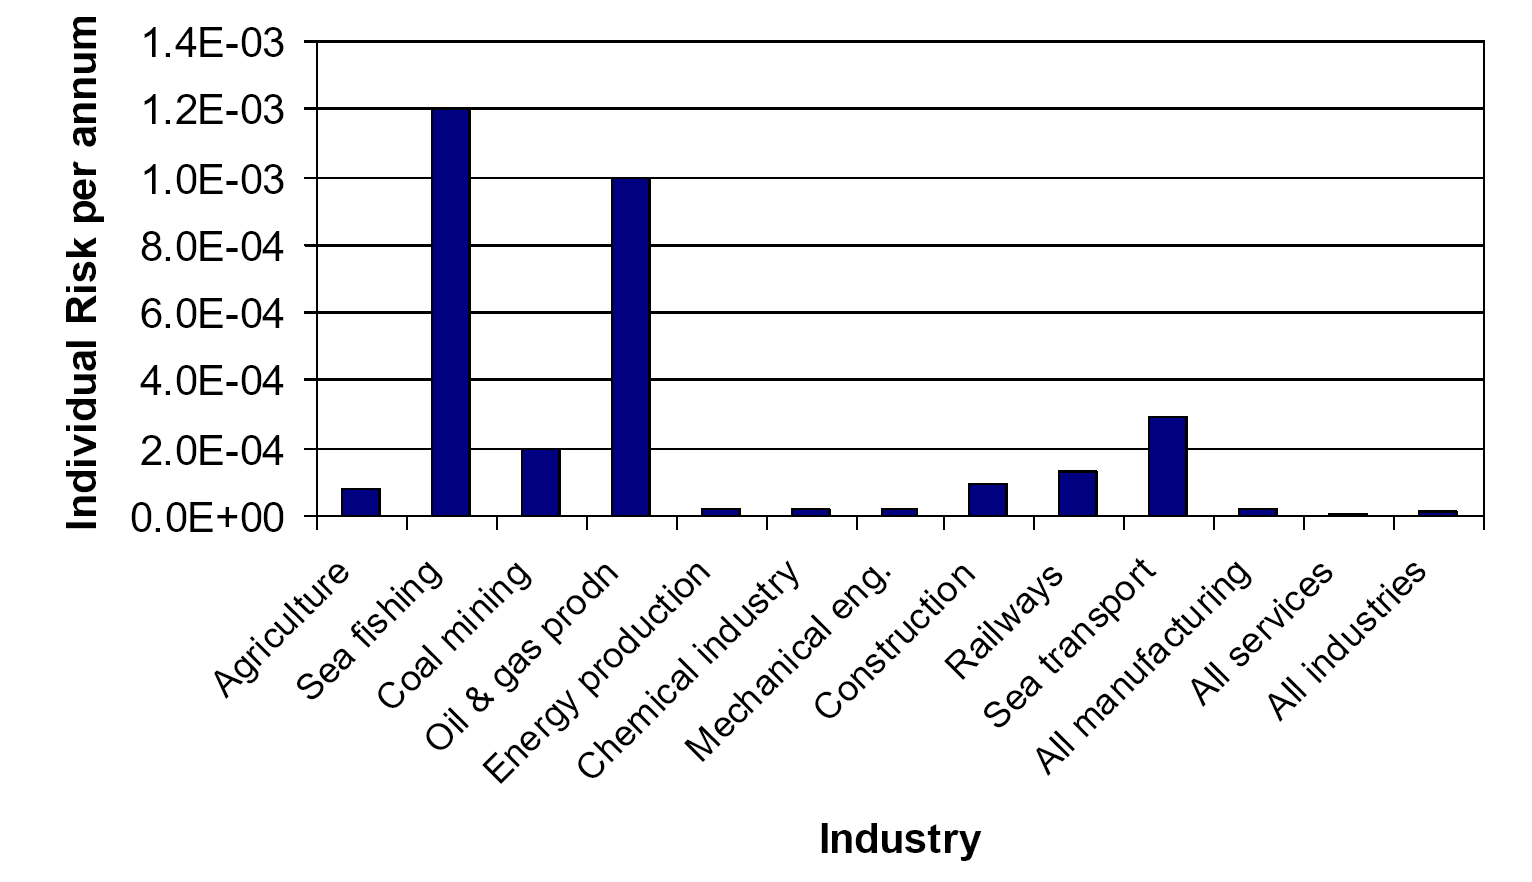
- The individual risk for sea transport of 2.9×10⁻⁴ per year is consistent with the worldwide data presented in Figure C.1, whilst the individual risk for sea fishing of 1.2×10⁻³ per year is the highest across all of the industries included.
- Societal Risk
- Societal risk is used to estimate risks of incidents affecting many persons (catastrophes) and acknowledging risk averse or neutral attitudes. Societal risk includes the risk to every person, even if a person is only exposed to risk on one brief occasion. For assessing the risk to a large number of affected people, societal risk is desirable because individual risk is insufficient in evaluating risks imposed on large numbers of people.
- Within this assessment, societal (navigation based) risk can be assessed for the Array, giving account to the change in risk associated with each incident scenario caused by the introduction of the Array structures. Societal risk may be expressed as:
- annual fatality rate where frequency and fatality are combined into a convenient one-dimensional measure of societal risk (also known as PLL); and
- F-N (frequency/consequence) diagrams showing explicitly the relationship between the cumulative frequency of an accident and the number of fatalities in a multi-dimensional diagram.
- When assessing societal risk, this study focuses on PLL, which accounts for the number of people likely to be involved in an incident (which is higher for certain vessel types) and assesses the significance of the change in risk compared to the UK background risk levels.
- For risk to the environment the key criteria considered in terms of the risk due to the Array is the potential quantity of oil spilled from a vessel involved in an incident.
- It is recognised that there will be other potential pollution, e.g. hazardous containerised cargoes; however, oil is considered the most likely pollutant and the extent of predicted oil spills is therefore worst case based on frequency and will provide an indication of the significance of pollution risk due to the Array compared to UK background pollution risk levels.
- Marine Accident Investigation Branch Incident Data
- All Incidents in UK Waters
Marine Accident Investigation Branch Incident Data All Incidents in UK Waters
- Marine Accident Investigation Branch Incident Data
- All British flagged commercial vessels are required to report incidents to the MAIB. Non-British flagged vessels do not have to report an incident to the MAIB unless located at a UK port or within 12 nm territorial waters and carrying passengers to a UK port. There are no requirements for non-commercial recreational craft to report incidents to the MAIB; however, a significant proportion of such incidents are reported to and investigated by the MAIB.
- The MCA, harbour authorities and inland waterway authorities also have a duty to report incidents to the MAIB. Therefore, whilst there may be a degree of underreporting of incidents with minor consequences, those resulting in more serious consequences, such as fatalities, are likely to be reported.
- Only incidents occurring in UK waters have been considered within this assessment for which the MAIB data is most comprehensive. It is also noted that incidents occurring in ports/harbours and rivers/canals have been excluded since the causes and consequences may differ considerably from an incident occurring offshore, which is the location of most relevance to the Array.
- Accounting for these criteria, a total of 11,773 accidents, injuries and hazardous incidents were reported to the MAIB in the 20-year period between 2002 and 2021 involving 13,415 vessels (some incidents, such as collisions, involved more than one vessel).
- The location of all incidents in proximity to the UK are presented in Figure C.3, colour-coded by incident type. The majority of incidents occur in coastal waters.
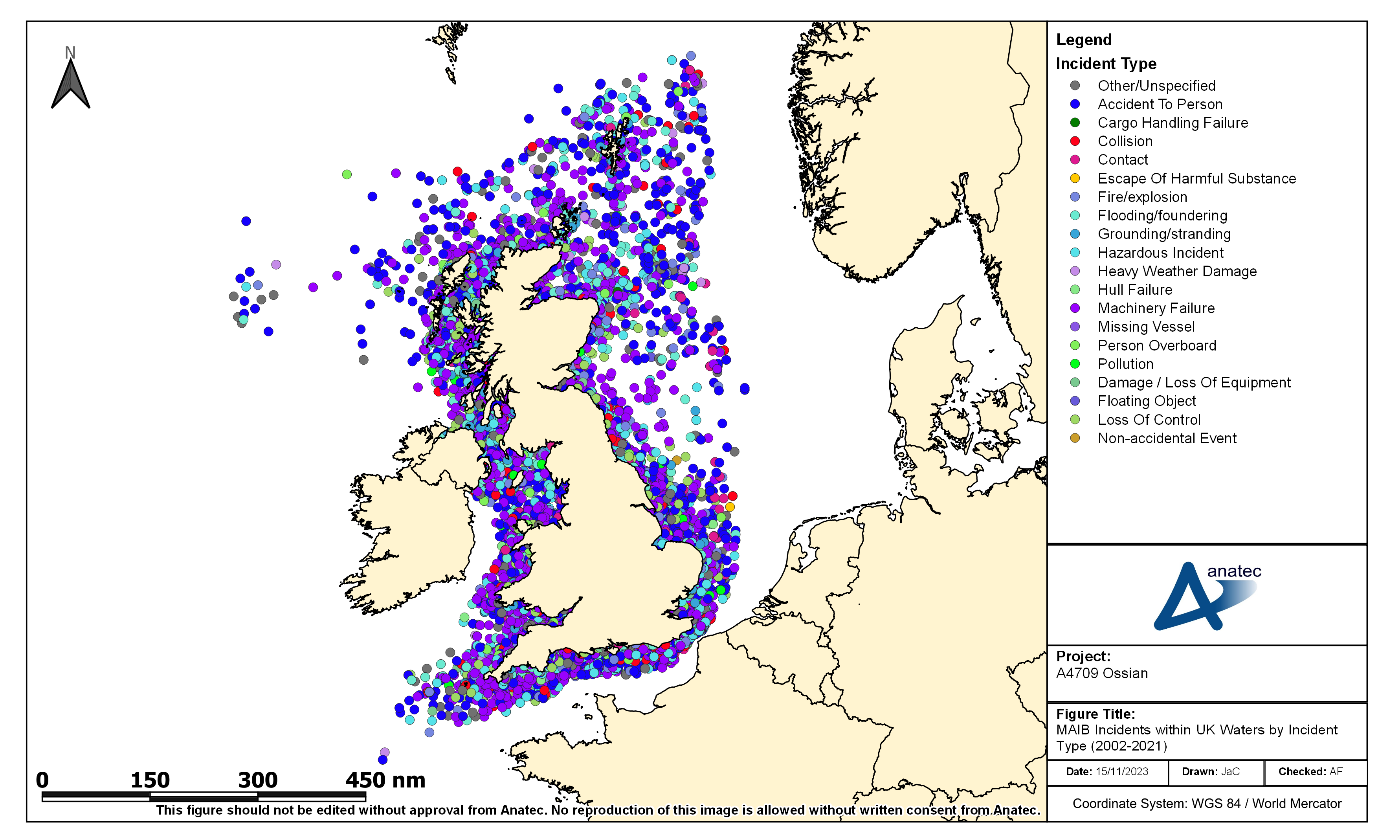
- The distribution of incidents by year in UK waters is presented in Figure C.4.
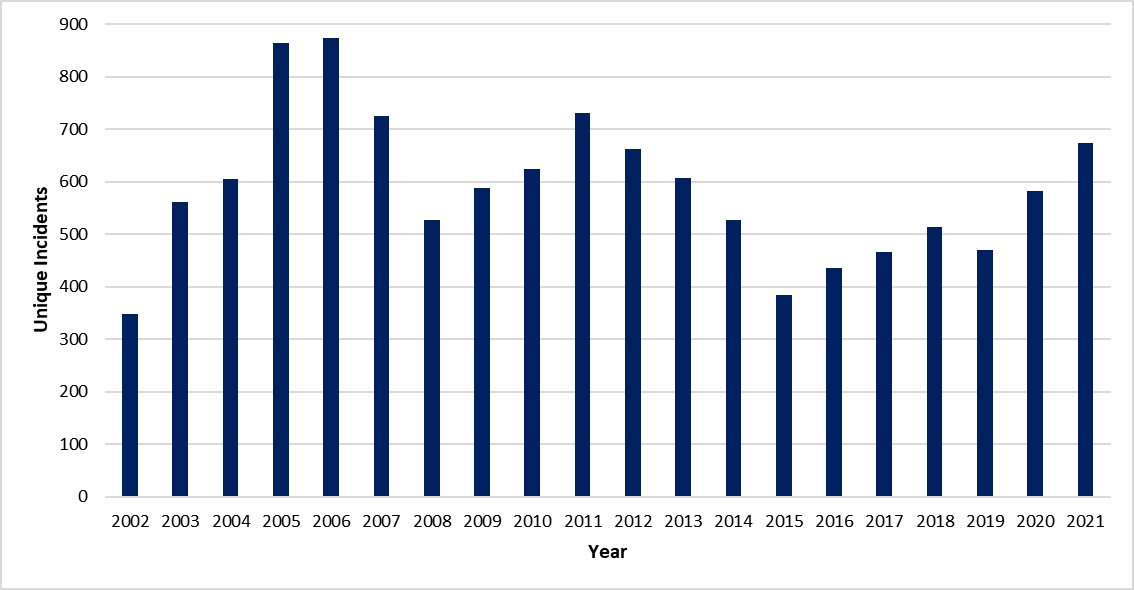
- The average number of unique incidents per year was 589. There has generally been a fluctuating trend in incidents over the 20-year period.
- The distribution of incidents in UK waters by incident type is presented in Figure C.5.
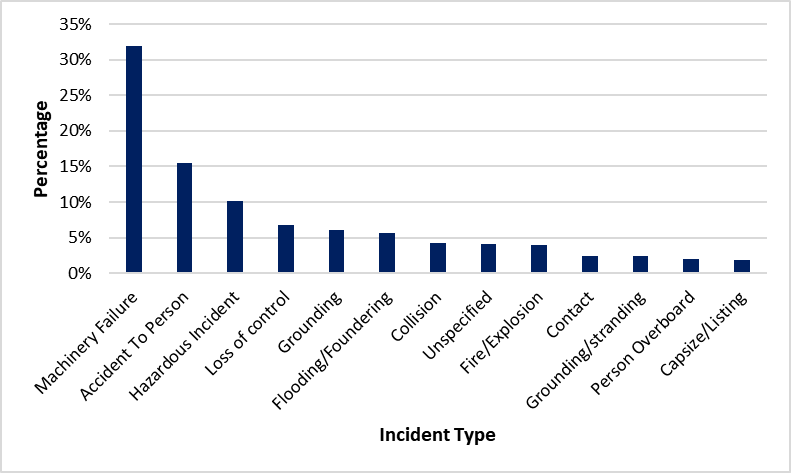
- The most frequent incident types were “machinery failure” (32%), “accident to person” (16%) and “hazardous incident” (10%). “Collision” and “contact” incidents represented 4% and 2% of total incidents, respectively.
- The distribution of incidents in UK waters by vessel type is presented in Figure C.6.
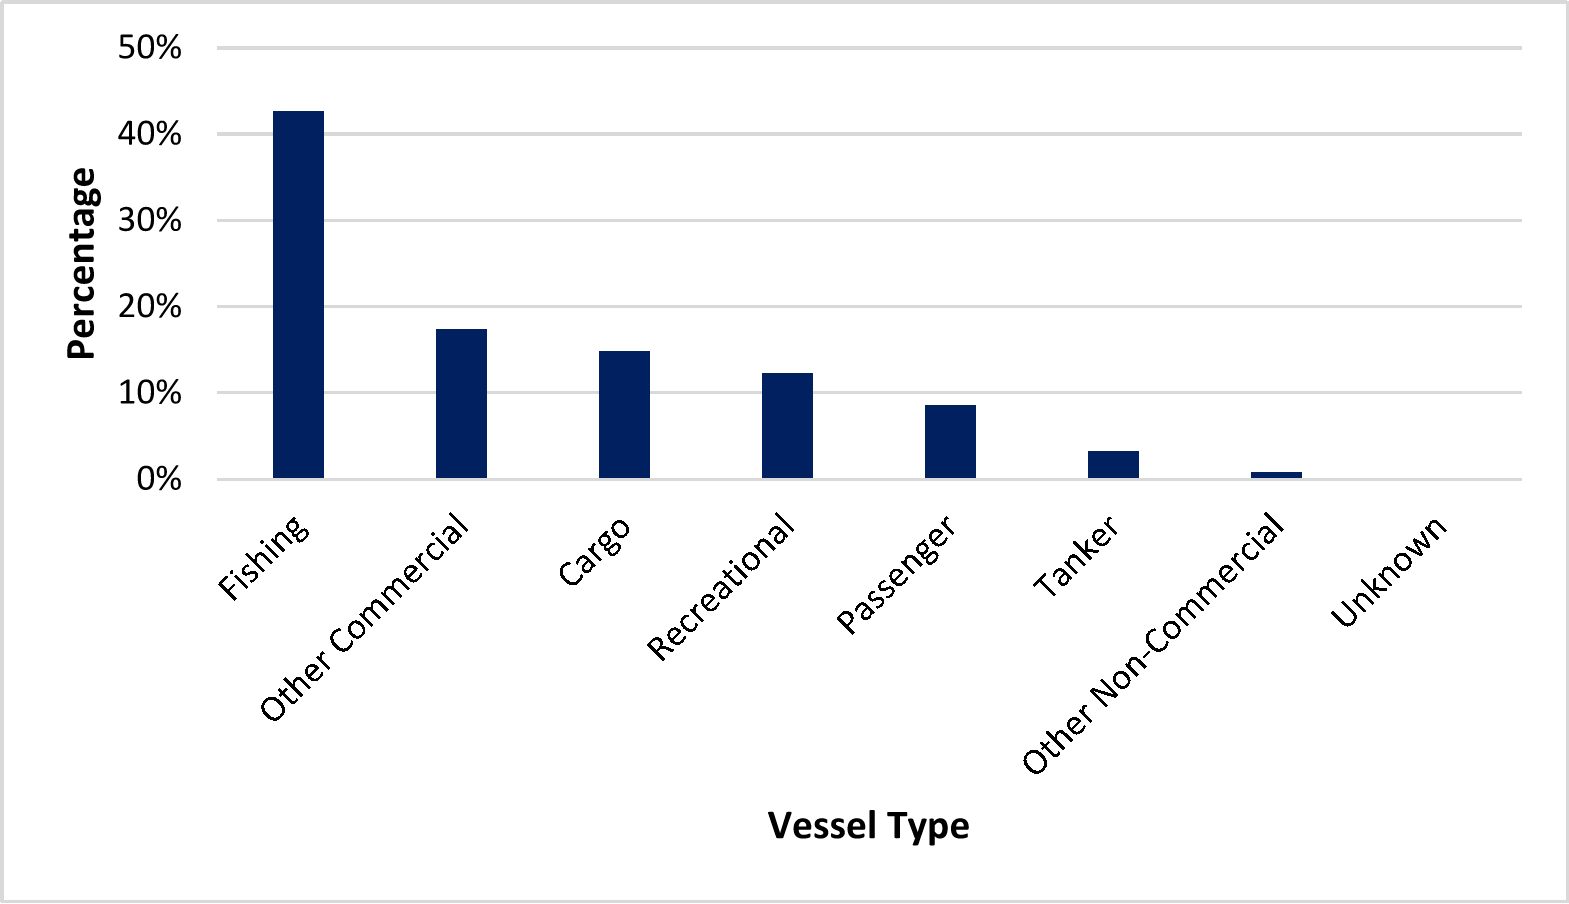
- The most frequent vessel types involved in incidents were fishing vessels (43%), other commercial vessels (17%) (including offshore industry vessels, tugs, workboats and pilot vessels) and cargo vessels (15%).
- A total of 414 fatalities were reported in the MAIB incidents within UK waters between 2002 and 2021, corresponding to an average of 21 fatalities per year.
- The distribution of fatalities in UK waters by vessel type and person category (crew, passenger and other) is presented in Figure C.7.
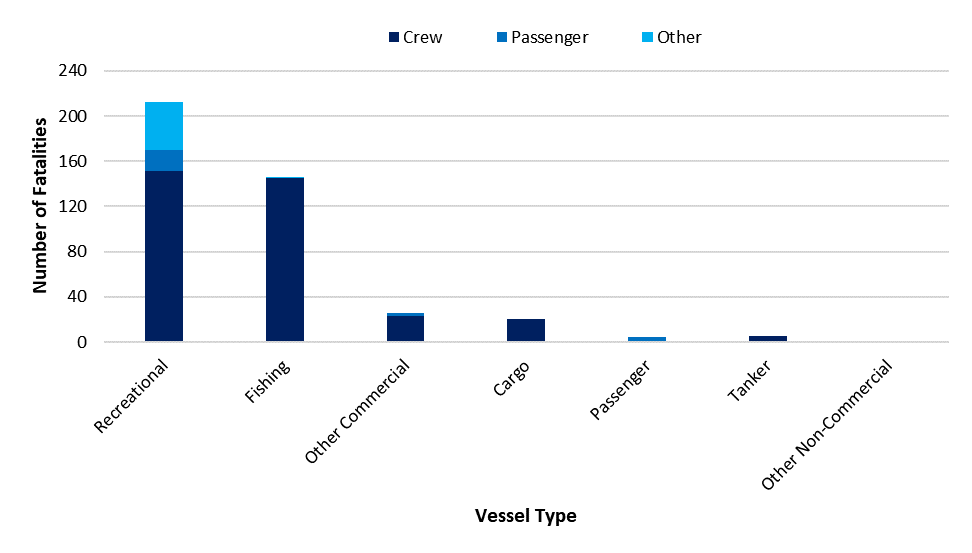
- The majority of fatalities occurred to recreational vessels (51%) and fishing vessels (35%), with crew members the main people involved (83%).
- The MAIB define a collision incident as “ships striking or being struck by another ship, regardless of whether the ships are underway, anchored or moored” (MAIB, 2013).
- A total of 504 collision incidents were reported to the MAIB in UK waters between 2002 and 2021 involving 1,068 vessels (in a small number of cases the other vessel involved was not logged).
- The locations of collision incidents reported in proximity to the UK are presented in Figure C.8.
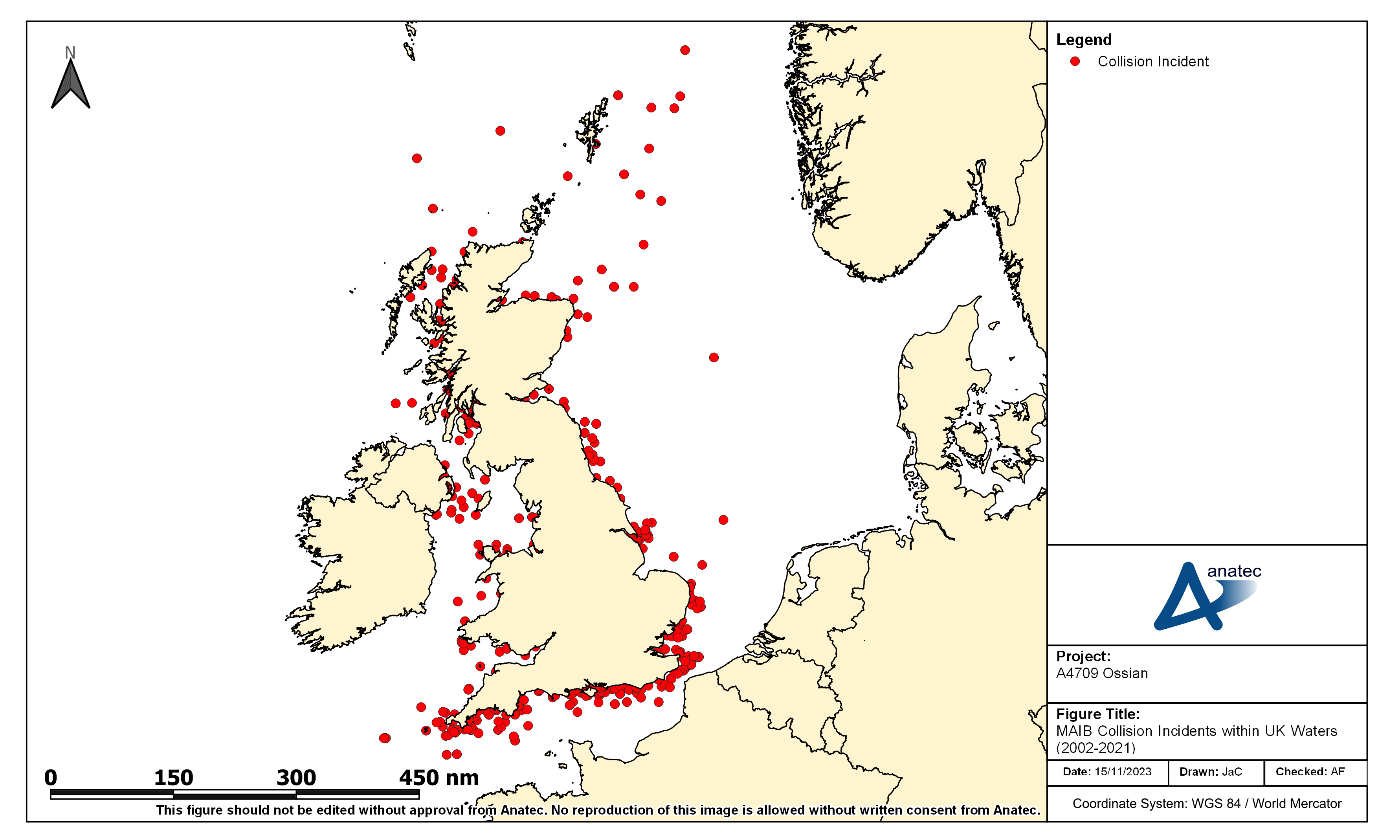
- The distribution of collision incidents per year is presented in Figure C.9.
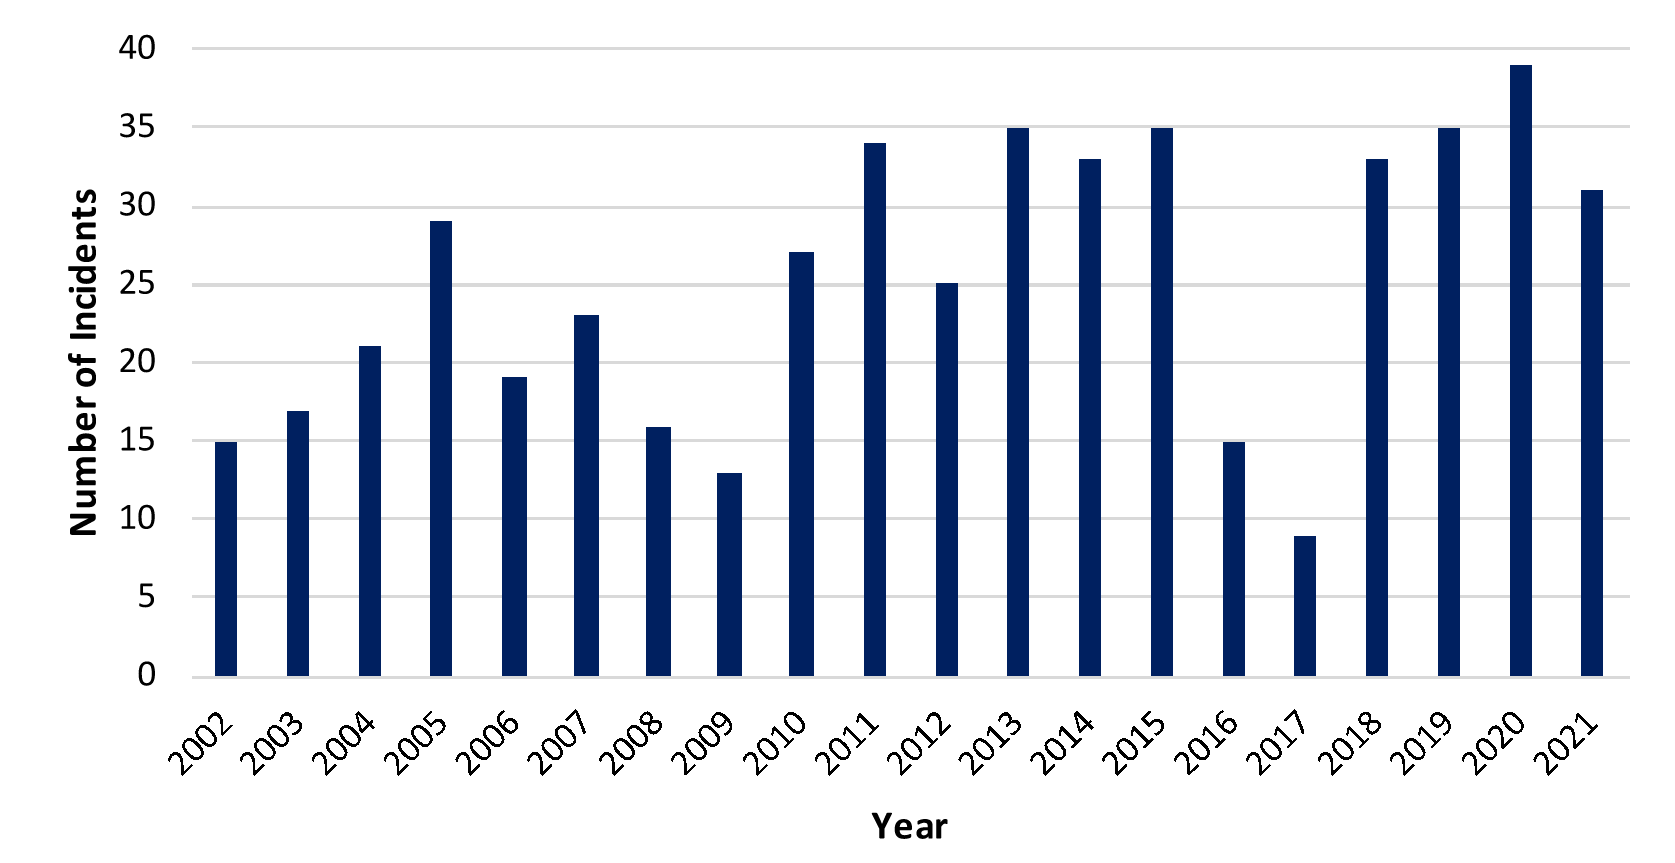
- The average number of collision incidents per year was 25. There has been an overall slight increasing trend in collision incidents over the 20-year period, which may be due to better reporting of less serious incidents in recent years.
- The distribution of vessel types involved in collision incidents is presented in Figure C.10.
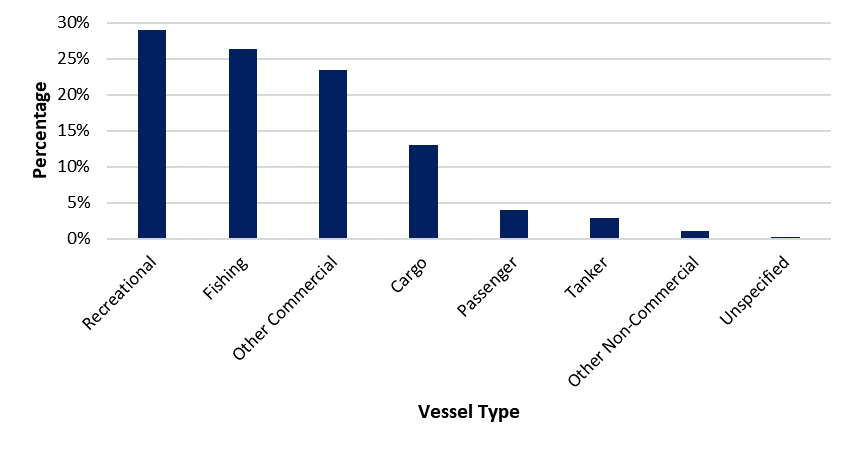
- The most frequent vessel types involved in collision incidents were recreational vessels (29%), fishing vessels (26%), other commercial vessels (24%) and cargo vessels (13%).
- A total of five fatalities were reported in MAIB collision incidents within UK waters between 2002 and 2021. Details of each of these fatal incidents reported by the MAIB are presented in Table C.2.
Date | Description | Fatalities |
|---|---|---|
July 2005 | Collision between two powerboats at night. Both vessels were unlit and both helmsmen had consumed alcohol. One of the helmsmen died. | 1 |
October 2007 | Collision between fishing vessel and coastal general cargo vessel following failure to keep an effective lookout. Fishing vessel sank with three of the four crew members abandoning ship into a life raft but the fourth crew member was not recovered. | 1 |
August 2010 | Collision between passenger ferry and fishing vessel. Fishing vessel sank with one of the two crew members recovered from the sea but the other member was not recovered despite an extensive search. | 1 |
June 2015 | Collision between Rigid-hulled Inflatable Boat (RIB) and yacht. Believed that around a dozen persons were onboard the motorboat with the majority taken ashore by lifeboat. One person seriously injured and airlifted to hospital before being pronounced dead later. | 1 |
June 2018 | Collision between power boats during a race. One of the vessels overturned with the pilot pronounced dead at the scene. | 1 |
- Allision Incidents
- The MAIB define a contact incident as “ships striking or being struck by an external object. The objects can be: floating object (cargo, ice, other or unknown); fixed object, but not the sea bottom; or flying object” (MAIB, 2013). In line with the NRA as a whole, an allision is considered to involve a moving object and a stationary object at sea, with port infrastructure excluded from consideration; the MAIB contact incidents have been individually inspected and filtered in line with the NRA definition.
- A total of 119 allision incidents were reported to the MAIB within UK waters between 2002 and 2021 involving 119 vessels.
- The locations of allision incidents reported in proximity to the UK are presented in Figure C.11.
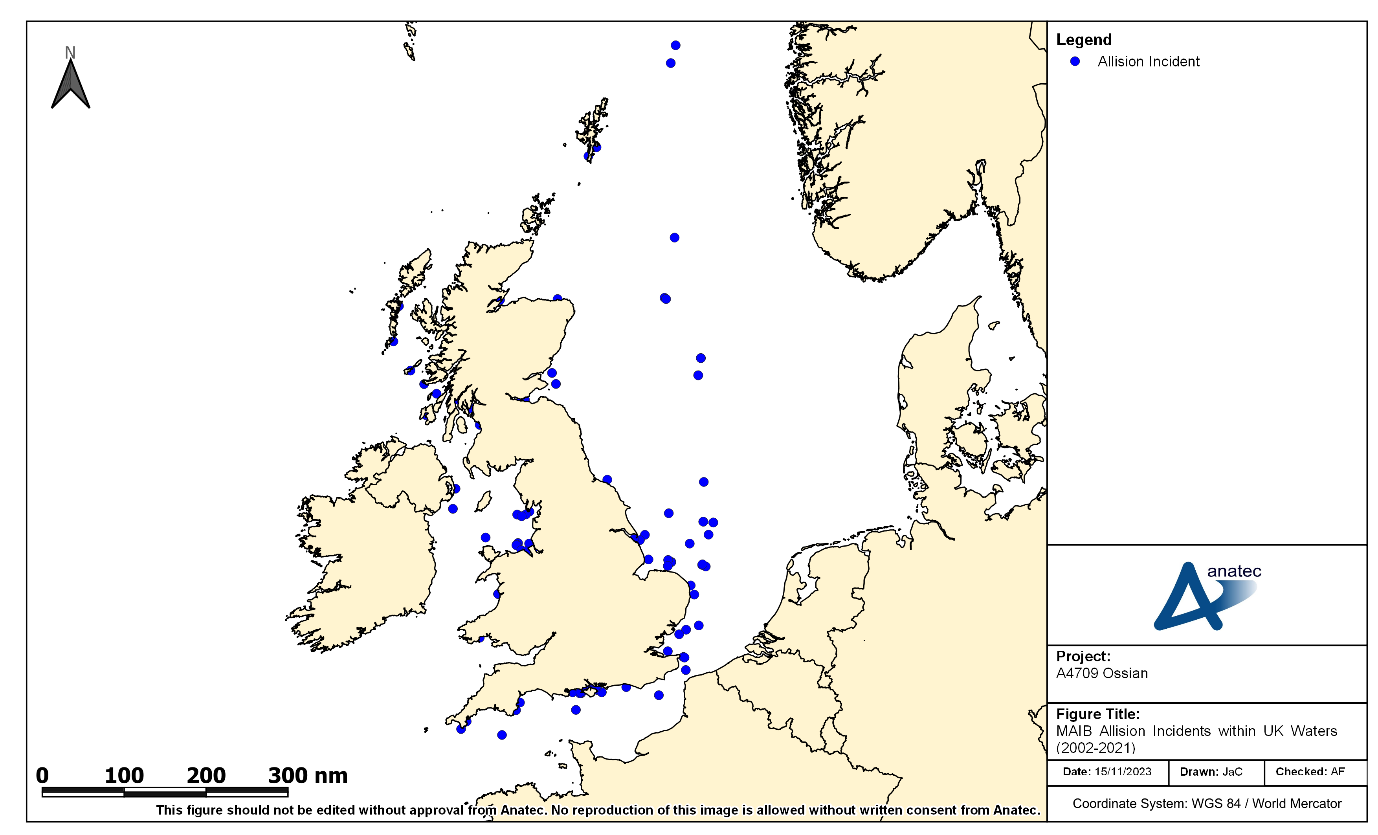
- The distribution of allision incidents per year is presented in Figure C.12.
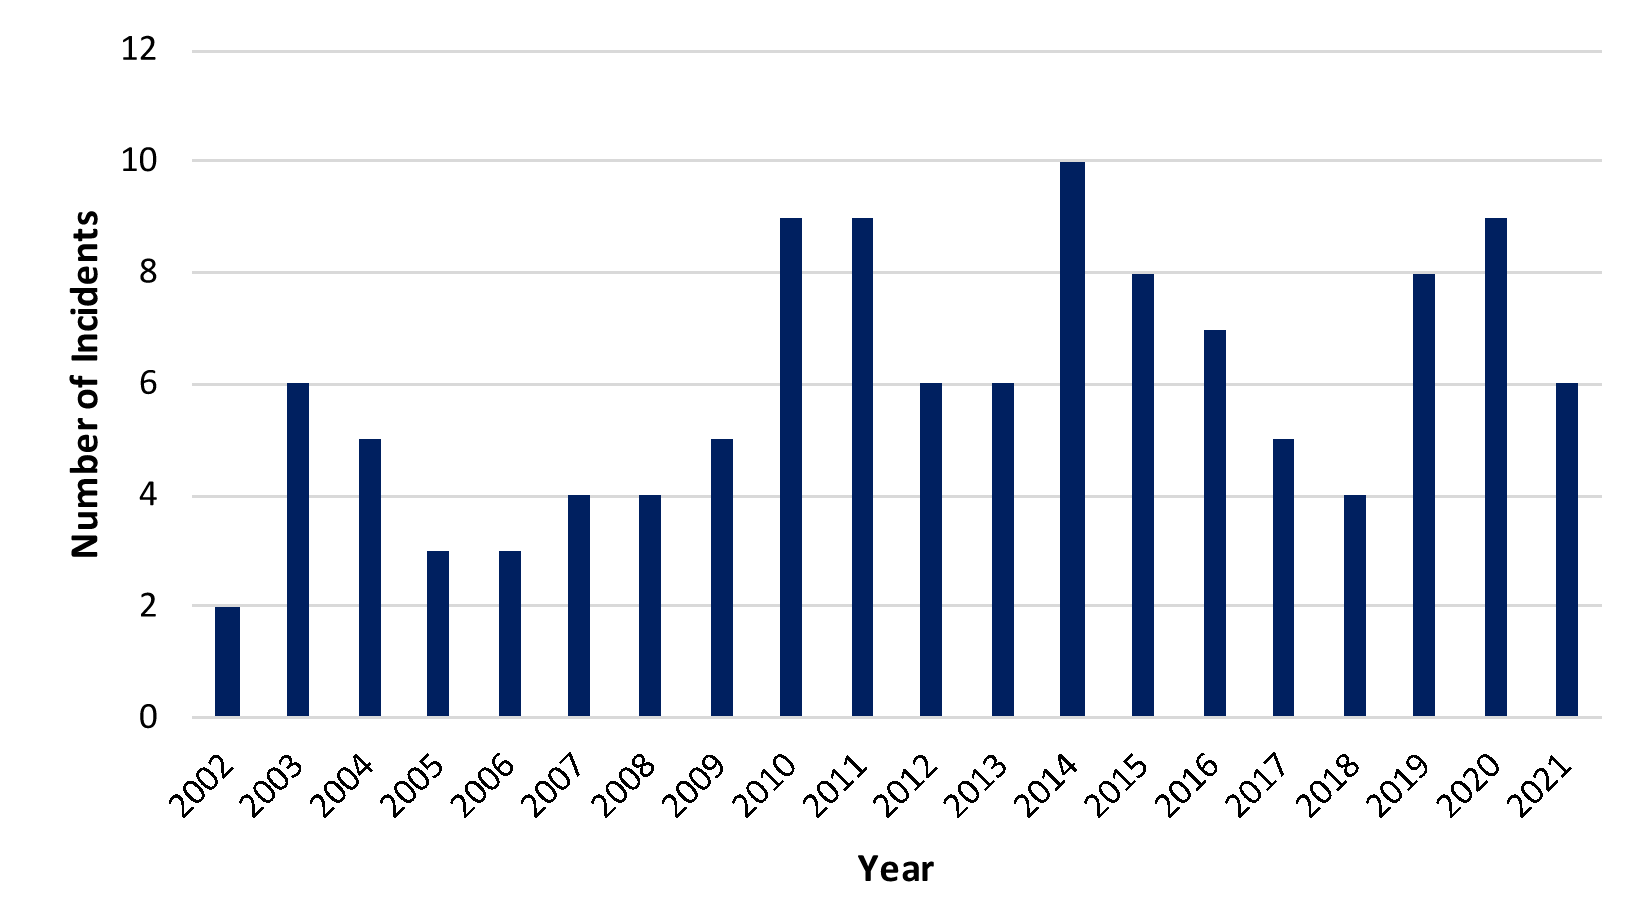
- The average number of allision incidents per year was six. As with collision incidents, there has been an overall slight increasing trend in allision incidents over the 20-year period, which may be due to better reporting of less serious incidents in recent years.
- The distribution of vessel types involved in allision incidents is presented in Figure C.13.
- The most frequent vessel types involved in allision incidents were other commercial vessels (50%), recreational vessels (18%) and fishing vessels (15%).
- No fatalities were reported in MAIB allision incidents within offshore UK waters between 2002 and 2021.
- Fatality Risk
- Incident Data
Fatality Risk Incident Data
- Fatality Risk
- This section uses the MAIB incident data along with information on average manning levels per vessel type to estimate the probability of a fatality in a maritime incident associated with the Array.
- The Array is assessed to have the potential to affect the following incidents:
- vessel to vessel collision;
- powered vessel to structure allision;
- drifting vessel to structure allision; and
- fishing vessel to structure allision.
- Of these incident types, only vessel to vessel collisions match the MAIB definition of collisions and hence the fatality analysis presented in section C.2.2 is considered directly applicable to these types of incidents.
- The other scenarios of powered vessel to structure allision, drifting vessel to structure allision and fishing vessel to structure allision are not clearly represented by the MAIB data (as discussed in section C.3.2). Additionally, none of the allision incidents reported by the MAIB between 2002 and 2021 resulted in a fatality.
- Therefore, the MAIB collision fatality risk rate has also been conservatively applied for the allision incident types.
- Five of the 504 collision incidents reported by the MAIB within UK waters between 2002 and 2021 resulted in one or more fatalities. This gives a 0.99% probability that a collision incident will lead to a fatal accident.
- To assess the fatality risk for personnel onboard a vessel (crew, passenger or other) the number of persons involved in the incidents needs to be estimated. Table C.3 presents the average number of POB estimated for each category of vessel navigating in proximity to the Array. For passenger vessels this is based upon information available for the specific vessels recorded in the vessel traffic survey data. For other vessel categories, this is based upon information available from the MAIB incident data.
Vessel Category | Sub Categories | Source of Estimated Average POB | Estimated Average POB |
|---|---|---|---|
Cargo/freight | Dry cargo, other commercial, service ship, etc. | MAIB incident data | 15 |
Tanker | Tanker/combination carrier | MAIB incident data | 23 |
Passenger | Roll Roll Off Passenger, cruise liner, etc. | Vessel traffic survey data / online information | 1,952 |
Fishing | Trawler, potter, dredger, etc. | MAIB incident data | 3.3 |
Recreational | Yacht, small commercial motor yacht, etc. | MAIB incident data | 3.3 |
- It is recognised that these average POB numbers can be substantially higher or lower on an individual vessel basis depending upon the size, subtype, etc. but applying reasonable averages is considered sufficient for this analysis, particularly when noting that the average POB for the dominant vessel category (passenger) is based upon the vessel traffic survey data where possible.
- Using the average POB, along with the vessel type information involved in collision incidents reported by the MAIB (see section C.2.2), there was an estimated 86,746 POB the vessels involved in the collision incidents.
- Based upon five fatalities during the period 2002 to 2021, the overall fatality probability in a collision for any individual onboard is approximately 5.76×10⁻⁵ per collision.
- It is considered inappropriate to apply this rate uniformly as the statistics indicate that the fatality probability associated with smaller craft, such as fishing vessels and recreational vessels, is higher. Therefore, the fatality probability has been subdivided into three categories of vessel as presented in Table C.4. In addition, due to zero fatalities resulting from commercial vessel collisions between 2002 and 2021, the time period used to assess the fatality probability for commercial vessels has been extended by five years to ensure a meaningful probability is captured.
Vessel Category | Sub Categories | Fatalities | People Involved | Fatality Probability | Time Period |
|---|---|---|---|---|---|
Commercial | Dry cargo, passenger, tanker, etc. | 1 | 84,796 | 1.18×10⁻⁵ | 1997 to 2021 (25 years) |
Fishing | Trawler, potter, dredger, etc. | 2 | 927 | 2.2×10⁻³ | 2002 to 2021 (20 years) |
Recreational | Yacht, small commercial motor yacht, etc. | 3 | 1,023 | 2.9×10⁻³ | 2002 to 2021 (20 years) |
- Fatality Risk Due to the Array
- The base case and future case annual collision frequency levels pre and post wind farm for the Array are summarised in Table C.5.
Risk | Scenario | Annual Frequency | ||
|---|---|---|---|---|
Pre Wind Farm | Post Wind Farm | Increase | ||
Vessel to vessel collision | Base case | 4.14×10⁻⁴ (1 in 2,418 years) | 5.42×10⁻⁴ (1 in 1,845 years) | 1.28×10⁻⁴ |
Future case (10%) | 5.45×10⁻⁴ (1 in 1,835 years) | 7.28×10⁻⁴ (1 in 1,374 years) | 1.83×10⁻⁴ | |
Future case (20%) | 6.33×10⁻⁴ (1 in 1,580 years) | 8.41×10⁻⁴ (1 in 1,188 years) | 2.09×10⁻⁴ | |
Powered vessel to structure allision | Base case | - | 6.91×10⁻³ (1 in 145 years) | - |
Future case (10%) | - | 7.60×10⁻³ (1 in 132 years) | - | |
Future case (20%) | - | 8.29×10⁻³ (1 in 121 years) | - | |
Drifting vessel to structure allision | Base case | - | 2.16×10⁻⁴ (1 in 4,619 years) | - |
Future case (10%) | - | 2.38×10⁻⁴ (1 in 4,199 years) | - | |
Future case (20%) | - | 2.60×10⁻⁴ (1 in 3,849 years) | - | |
Fishing vessel to structure allision | Base case | - | 4.08×10⁻² (1 in 24 years) | - |
Future case (10%) | - | 4.49×10⁻² (1 in 22 years) | - | |
Future case (20%) | - | 4.90×10⁻² (1 in 20 years) | - | |
Total | Base case | 4.14×10⁻⁴ (1 in 2,418 years) | 4.85×10⁻² (1 in 21 years) | 4.81×10⁻² |
Future case (10%) | 5.45×10⁻⁴ (1 in 1,835 years) | 5.35×10⁻² (1 in 19 years) | 5.30×10⁻² | |
Future case (20%) | 6.33×10⁻⁴ (1 in 1,580 years) | 5.84×10⁻² (1 in 17 years) | 5.78×10⁻² | |
- From the detailed results of the collision and allision risk modelling, the distribution of the predicted change in annual collision and allision frequency by vessel type due to the Array for the base case and future case are presented in Figure C.14.
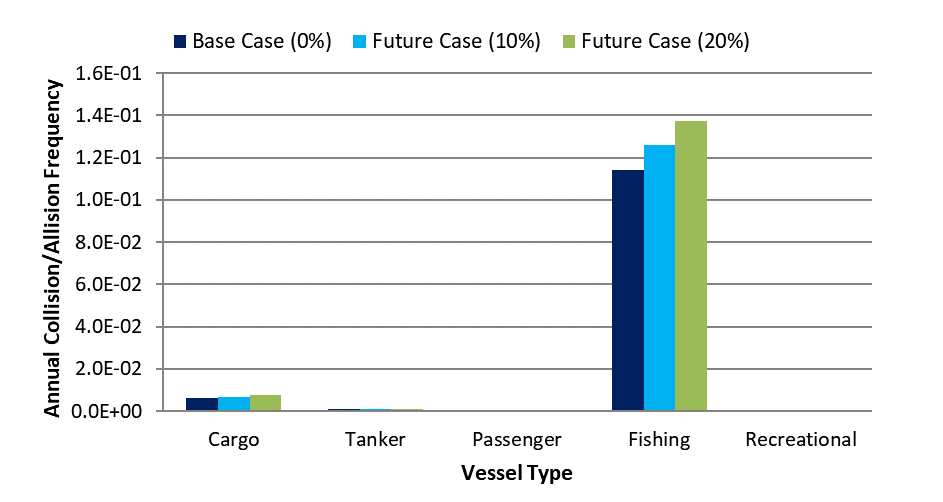
- It can be seen that the change in collision and allision frequency is dominated by fishing vessels, however this is mainly due to the high conservatism of the fishing allision model (see section 15.4.5). Cargo vessels had the next largest change in collision and allision frequency (likely due to their higher volume in terms of vessel numbers compared to the other vessel types).
- Combining the annual collision and allision frequency (see Table C.5), estimated number of POB for each vessel type (see Table C.3) and the estimated fatality probability for each vessel type category (see Table C.4), the annual increase in PLL due to the presence of the Array for the base case is estimated to be 7.74×10⁻⁴, equating to one additional fatality every 1,292 years.
- The estimated incremental increases in PLL due to the Array, distributed by vessel type and for the base case and future case, are presented in Figure C.15.
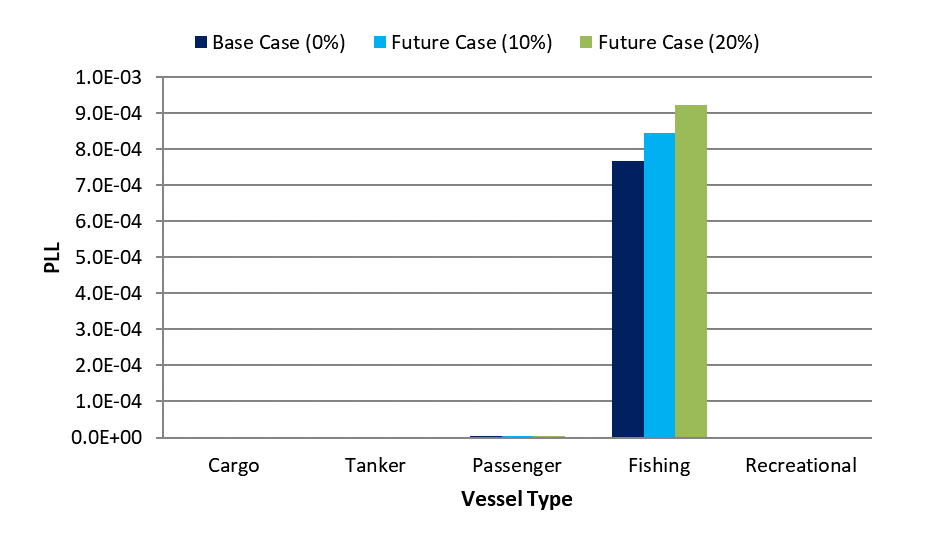
- As with the change in collision and allision frequency, the change in annual PLL is dominated by fishing vessels which historically have a higher fatality probability than commercial vessels.
- Converting the PLL to individual risk based upon the average number of people exposed by vessel type, the results are presented in Figure C.16.
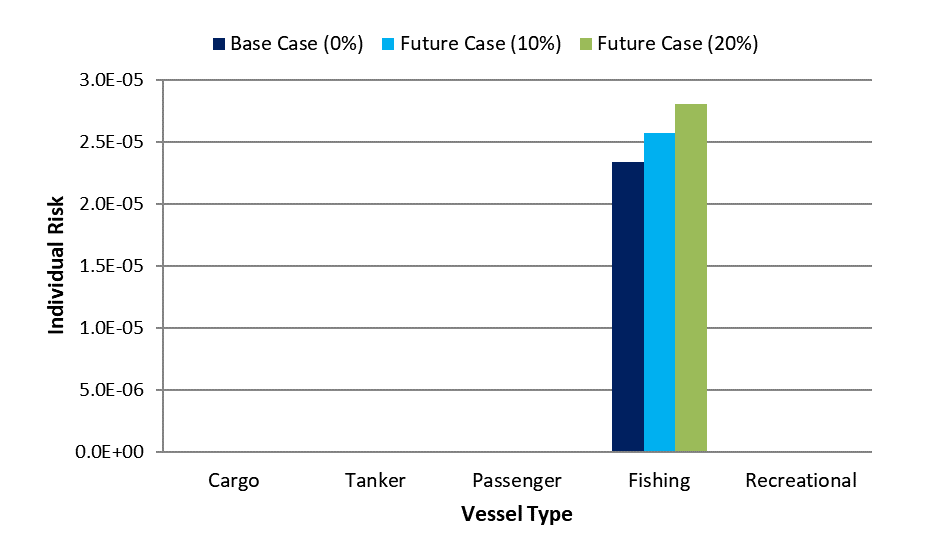
- It can be seen that the individual risk to people is dominated by fishing vessels, reflecting the higher probability of a fatality occurring in the event of an incident involving a fishing vessel in comparison to other vessel types.
- In comparison to MAIB statistics, which indicate an average of 18 to 19 fatalities per year in UK territorial waters during the 20-year period between 2002 and 2021, the overall increase for the base case in PLL of one additional fatality per 1,292 years represents a negligible change.
- In terms of individual risk to people, the change for commercial vessels attributed to the Array (approximately 8.86×10⁻⁹ for the base case) is negligible compared to the background risk level for the UK sea transport industry of 2.9×10⁻⁴ per year.
- For fishing vessels, the change in individual risk attributed to the Array (approximately 2.33×10⁻⁵ for the base case) is low compared to the background risk level for the UK sea fishing industry of 1.2×10⁻³ per year.
- Pollution Risk
Pollution Risk Historical Analysis
- The pollution consequences of a collision in terms of oil spill depend upon the following criteria:
- spill probability (i.e. the likelihood of outflow following an incident); and
- spill size (quantity of oil).
- Two types of oil spill are considered in this assessment:
- fuel oil spills from bunkers (all vessel types); and
- cargo oil spills (laden tankers).
- The research undertaken as part of the DfT’s MEHRAs project (DfT, 2001) has been used as it was comprehensive and based upon worldwide marine oil spill data analysis. From this research, the overall probability of a spill per incident was calculated based upon historical incident data for each incident type as presented in Figure C.17.
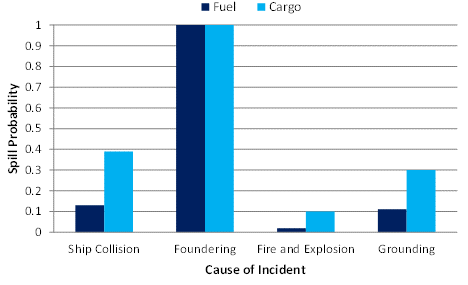
- Therefore, it was estimated that 13% of vessel collisions result in a fuel oil spill and 39% of collisions involving a laden tanker result in a cargo oil spill.
- In the event of a bunker spill, the potential outflow of oil depends upon the bunker capacity of the vessel. Historical bunker spills from vessels have generally been limited to a size below 50% of bunker capacity, and in most incidents much lower.
- For the types and sizes of vessels exposed to the Array, an average spill size of 100 tonnes of fuel oil is considered a conservative assumption.
- For cargo spills from laden tankers, the spill size can vary significantly. The ITOPF reported the following spill size distribution for tanker collisions between 1974 and 2004 (ITOPF, 2023):
- 31% of spills below seven tonnes;
- 52% of spills between seven and 700 tonnes; and
- 17% of spills greater than 700 tonnes.
- Based upon this data and the tankers transiting in proximity to the Array, an average spill size of 400 tonnes is considered a conservative assumption.
- For fishing vessel collisions, comprehensive statistical data is not available. Consequently, it is conservatively assumed that 50% of all collisions involving fishing vessels will lead to oil spill with the quantity spilled being on average five tonnes. Similarly for recreational vessels, due to a lack of data 50% of collisions are conservatively assumed to lead to a spill with an average size of one tonne.
- Pollution Risk Due to the Array
- Applying the above probabilities to the annual collision and allision frequency by vessel type presented in Table C.5 and the average spill size per vessel, the amount of oil spilled per year due to the impact of the Array is estimated to be 0.52 tonnes per year for the base case, 0.57 tonnes per year for the 10% future case and 0.62 tonnes per year for the 20% future case.
- The estimated increase in tonnes of oil spilled, distributed by vessel type, for the base case and future case are presented in Figure C.18.
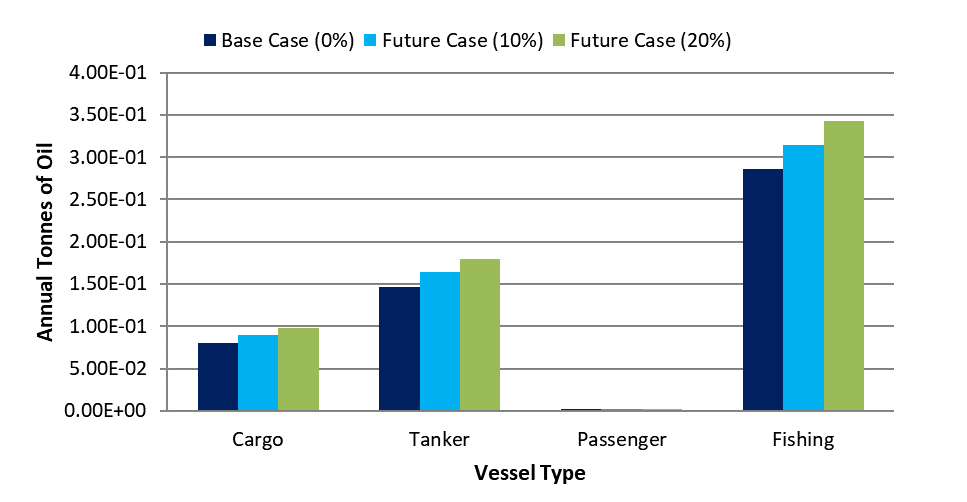
- The annual oil spill results are dominated by fishing vessels due to their high associated annual collision and allision frequency. Tankers and cargo vessels also contribute significantly to the annual oil spill estimate, which reflects the greater volume of oil spillage anticipated per incident involving tankers.
- Significance of Increase in Pollution Risk
- To assess the significance of the increased pollution risk from vessels caused by the Array, historical oil spill data for the UK has been used as a benchmark.
- From the MEHRAs research (DfT, 2001), the annual average tonnes of oil spilled in UK waters due to maritime incidents in the ten year period from 1989 to 1998 was 16,111. This is based upon a total of 146 reported oil pollution incidents of greater than one tonne (smaller spills are excluded as are incidents which occurred within port or harbour areas or resulting from operational errors or equipment failure). Commercial vessel spills accounted for approximately 99% of the total while fishing vessel incidents accounted for less than 1%.
- The overall increase in pollution estimated due to the Array of 0.52 tonnes for the base case represents a 0.003% increase compared to the historical average pollution quantities from maritime incidents in UK waters.
- Conclusion
Conclusion
- This appendix has quantitively assessed the fatality and pollution risk associated with the Array in the event of a collision or allision incident occurring. The assessment indicates that the fatality and pollution risk associated with fishing vessels is greatest.
- Overall, the impact of the Array on people and the environment is relatively low compared to the existing background risk levels in UK waters. However, this is the localised impact of a single offshore wind farm development and there will be additional maritime risks associated with other offshore wind farm developments in the North Sea and the UK as a whole.
- Regular Operator Consultation
Regular Operator Consultation
- As part of the consultation process for the Array, regular vessel operators identified (from the vessel traffic survey data) that may be required to deviate their routes due to the Array were consulted via electronic mail. An example of the correspondence sent to the Regular Operators is presented below.
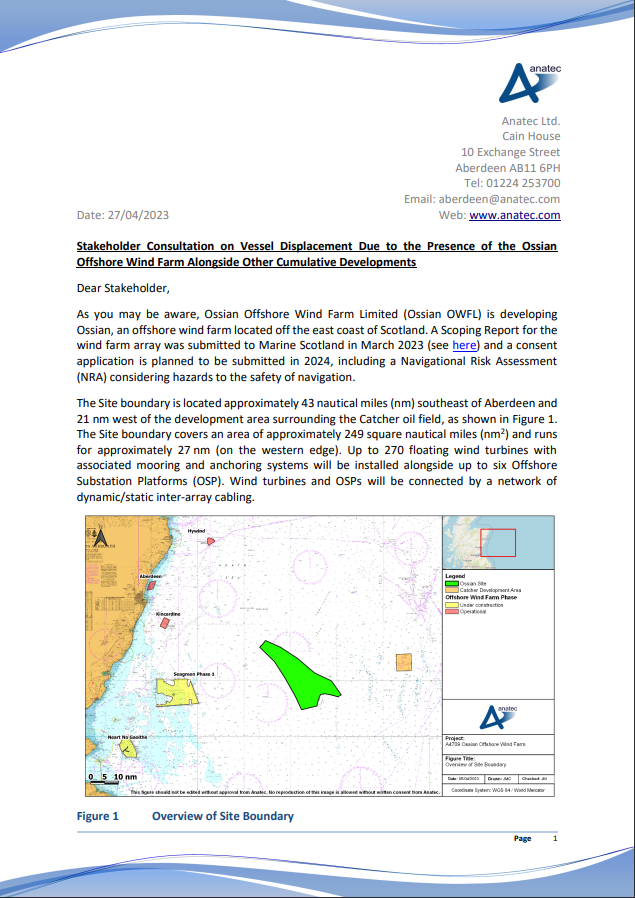
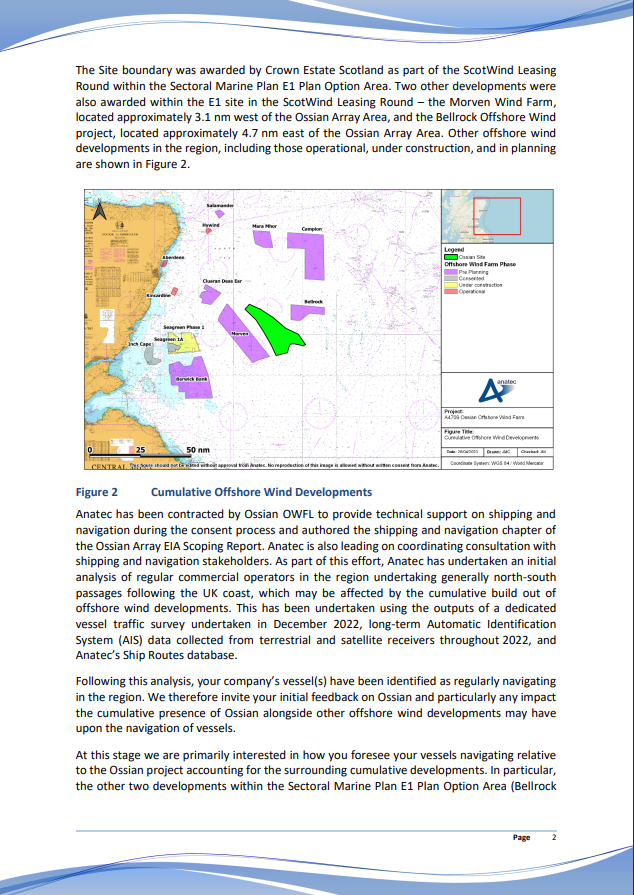
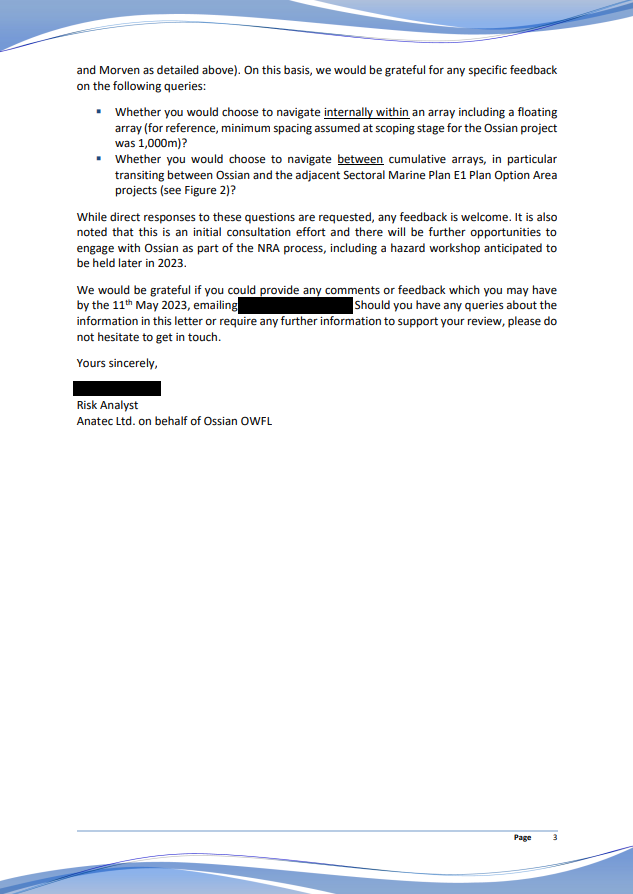
- Long-Term Vessel Traffic Movements
- Introduction
Introduction
Long-Term Vessel Traffic Movements Introduction
- This appendix assesses additional long-term vessel traffic data for Array. As required under MGN 654 (MCA, 2021), the NRA and volume 2, chapter 13 of the Array EIA Report consider 28 days of AIS, Radar and visual observation data as the primary vessel traffic data source. However, it should be considered that studying a 28-day period in isolation may exclude certain activities or periods of pertinence to shipping and navigation. Therefore, in line with good practice assessment procedures, this NRA has also considered a longer-term dataset covering all of 2022 to ensure a comprehensive characterisation of vessel traffic movements can be established, including the capture of any seasonal variation.
- This approach (i.e. the use of both short- and long-term data) has been agreed with the MCA and NLB.
- Aims and Objectives
Aims and Objectives
- The key aims and objectives of this appendix are as follows:
- identify seasonal variations in vessel traffic via assessment of the long-term vessel traffic data;
- determine which variations are not reflected within the short-term vessel traffic survey data (and therefore should be fed into the NRA baseline); and
- assess which dataset (long-term/survey or combination of both) should be utilised for each key NRA element that requires vessel traffic data input.
- Methodology
Methodology Study Area
- This appendix has assessed the long-term vessel traffic data within the shipping and navigation study area for the site boundary as defined in section 3.4.
- Data Period and Temporary Vessel Traffic
- The long-term vessel traffic data was collected from coastal and satellite AIS receivers for the entirety of 2022 (01 January to 31 December).
- As per the vessel traffic surveys, a number of vessel tracks recorded during the data period were classified as temporary (non-routine) and have been excluded from the characterisation of the vessel traffic baseline, including vessels involved in surveys, guard work or construction.
- General limitations associated with the use of AIS data (for example, carriage requirements) are discussed in full within section 5.4.1.
- AIS Coverage
- AIS coverage is affected by downtime where the source receivers are unavailable. Since both terrestrial and satellite receivers have been used, complete downtime (where all terrestrial and satellite sources indicated that no vessels were present which may indicate either downtime or genuine lack of vessel presence) is limited to 2% of the data period. However, there is potential for partial loss of coverage, particularly for areas further offshore.
- Long-Term AIS Assessment
Long-Term AIS Assessment Vessel Traffic Overview
- An overview of all AIS vessel data recorded within the shipping and navigation study area during 2022, excluding temporary traffic and colour-coded by vessel type, is presented in Figure E.1. Following this, Figure E.2 presents the same vessel traffic as a density heat-map.
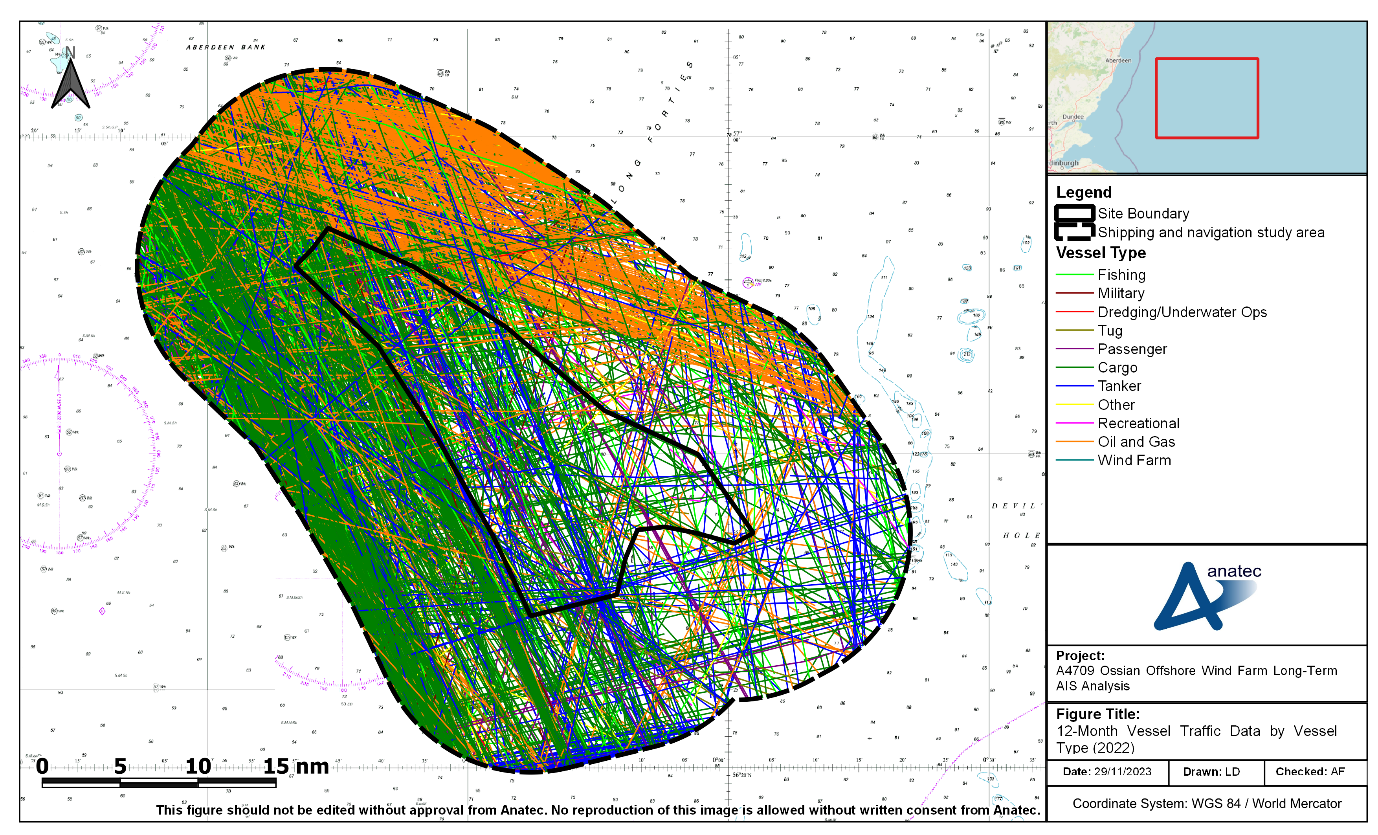
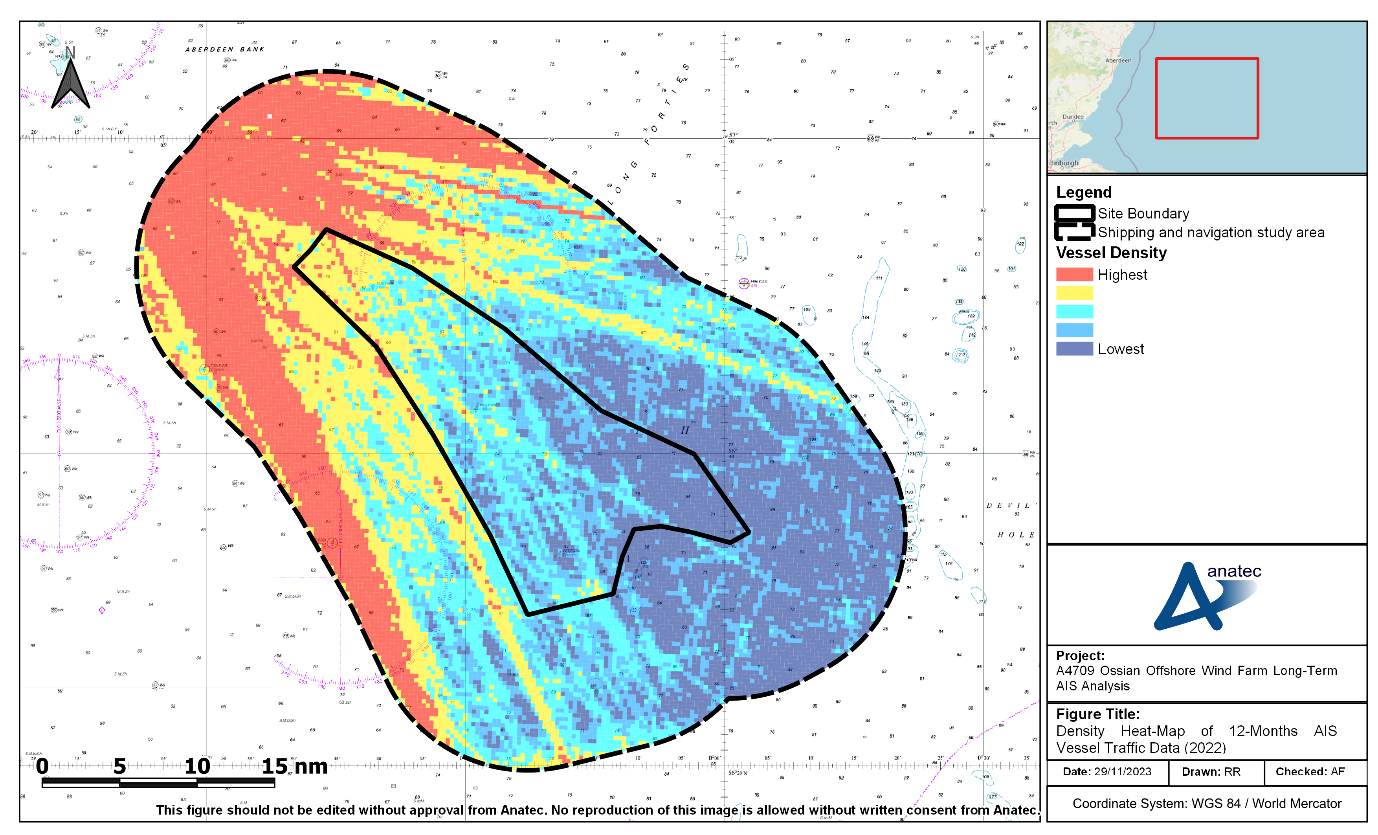
- The average number of unique vessels recorded per day for each month of 2022 within the shipping and navigation study area is presented in Figure E.3.
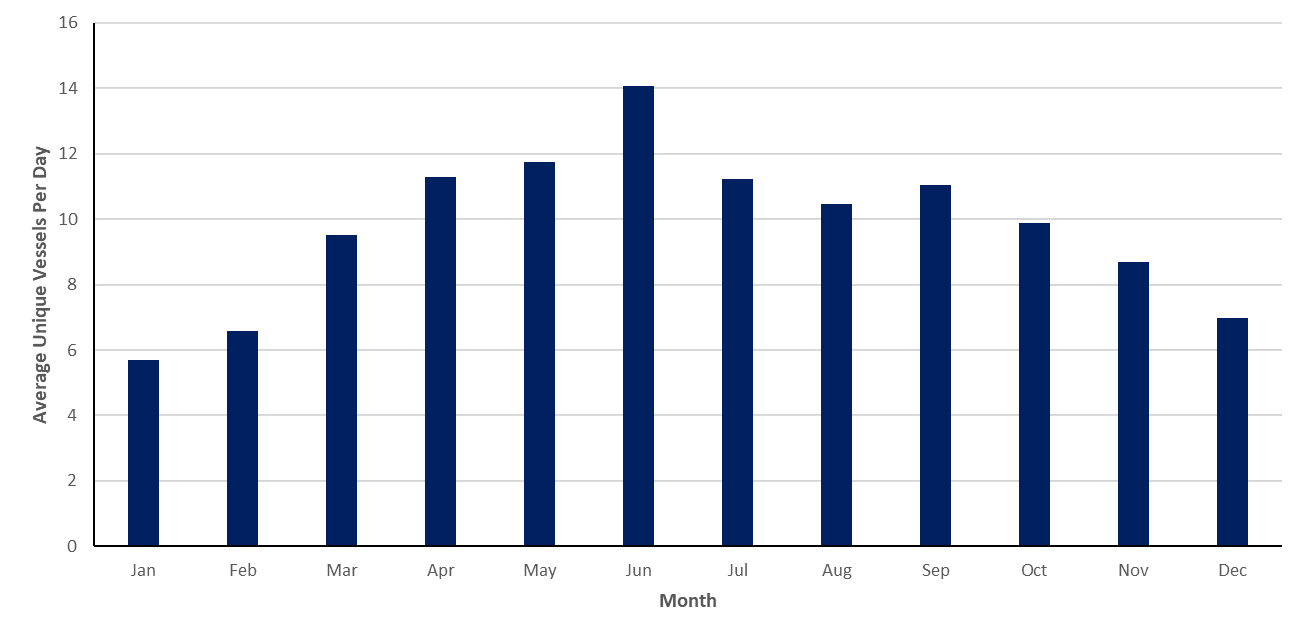
- An average of nine to ten unique vessels per day were recorded within the shipping and navigation study area during 2022. The busiest month for vessel traffic was June 2022, where approximately 14 unique vessels per day were recorded within the shipping and navigation study area. The quietest month was January 2022, with approximately six unique vessels per day recorded within the shipping and navigation study area. There were two individual days across 2022 where no vessels were recorded within the shipping and navigation study area which were the 07 January 2022 and 05 March 2022. The busiest day was the 02 June 2022 with 21 unique vessels within the shipping and navigation study area.
- The vessel traffic from the busiest and quietest months, colour-coded by vessel type, are presented in Figure E.4 and Figure E.5, respectively.
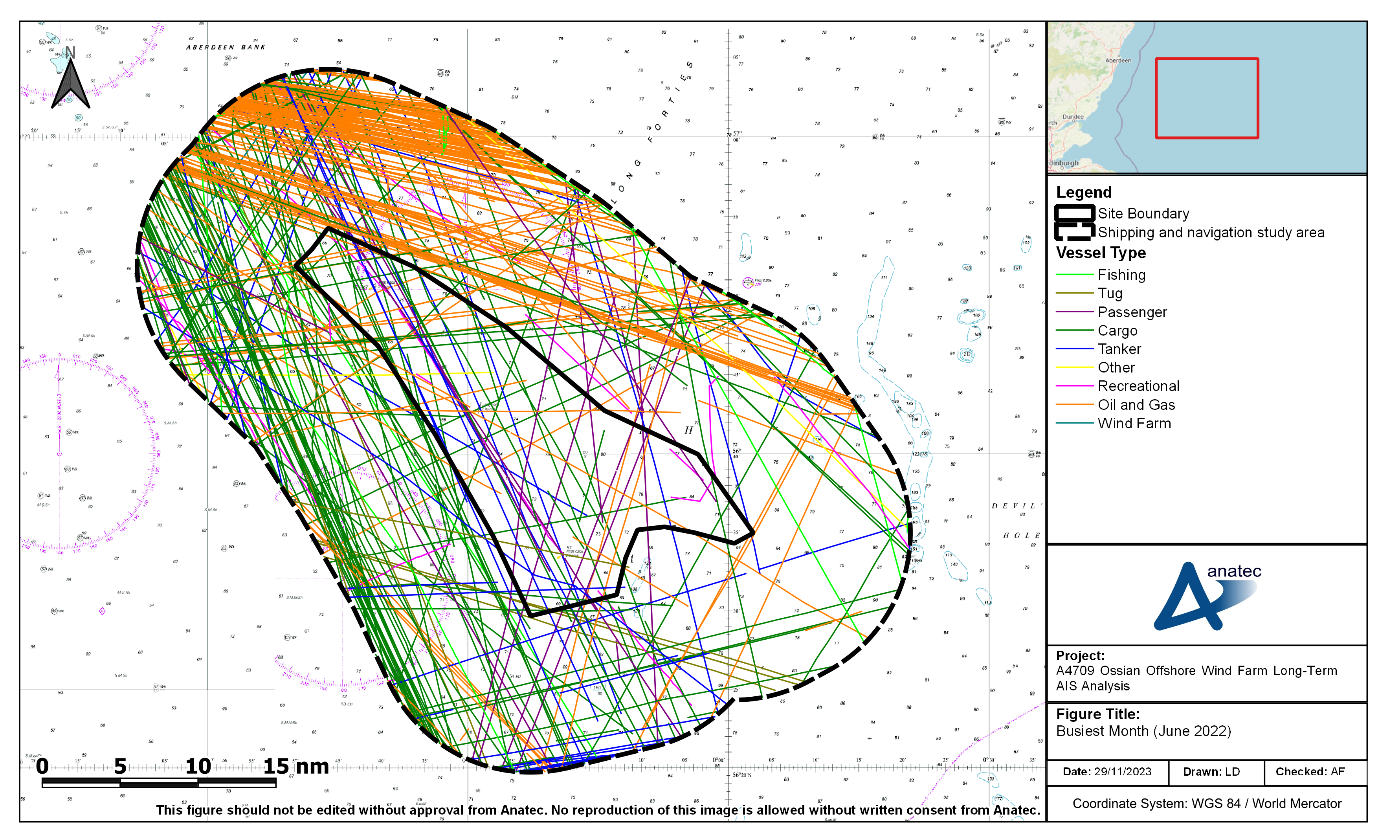
- Vessels by Type Recorded Within the Shipping and Navigation Study Area During the Busiest Month (June 2022)
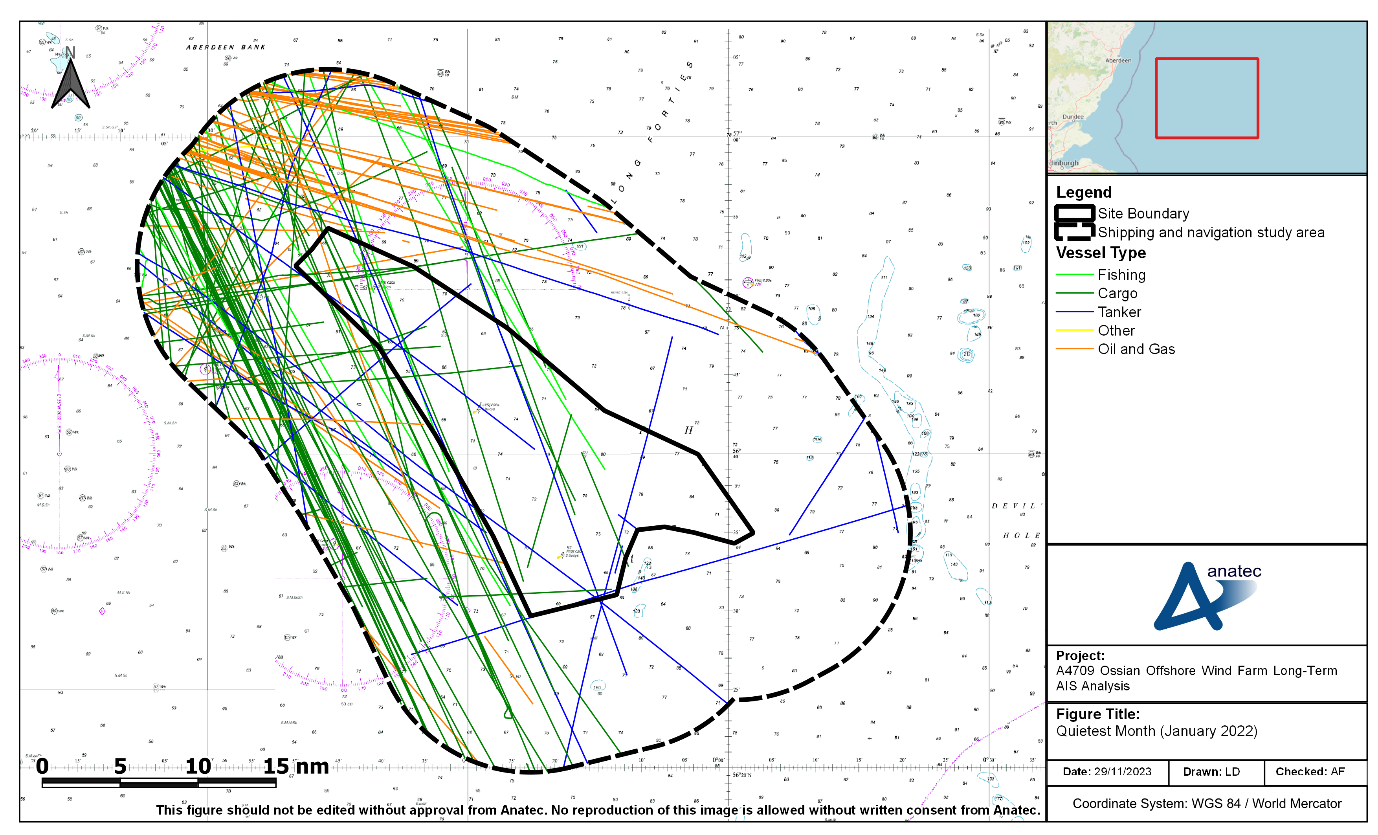
- Vessels by Type Recorded Within the Shipping and Navigation Study Area During the Quietest Month (January 2022)
- The distribution of vessel types recorded during 2022 within the shipping and navigation study area is presented in Figure E.6. Note that vessel types recorded in low numbers during the data period have been incorporated in the ‘All Other’ category[11].
- The most common vessel types recorded within the shipping and navigation study area during 2022 was oil and gas vessels (44%), cargo vessels (36%), and tankers (10%). No other vessel type accounted for more than 4% of all vessel traffic recorded.
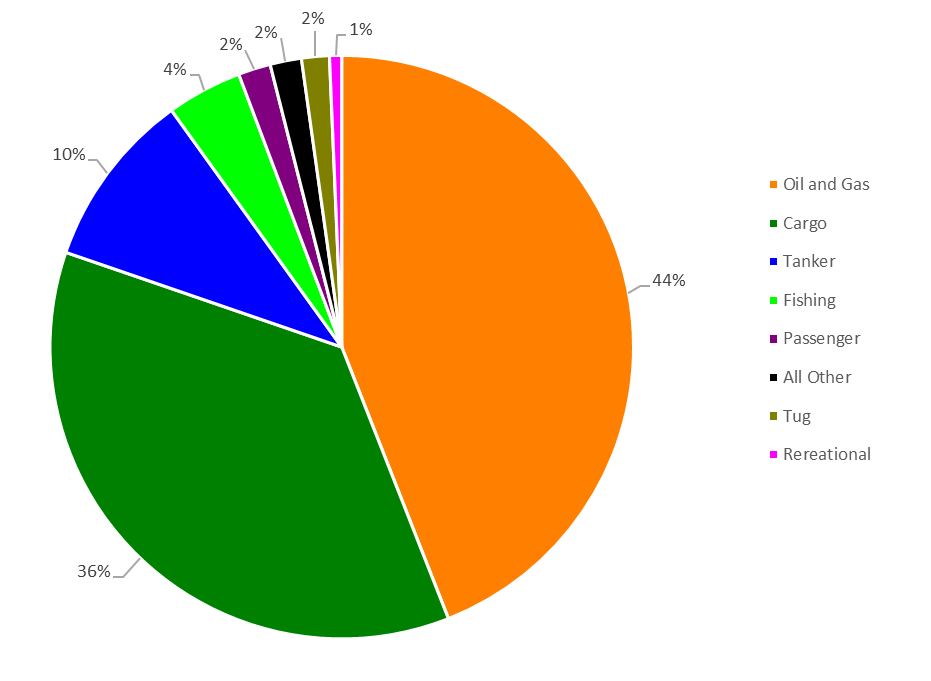
- Vessel Type Distribution Recorded Within the Shipping and Navigation Study Area Across 12 Months in 2022
- The vessel tracks recorded during 2022 within the shipping and navigation study area, colour-coded by vessel length, are presented in Figure E.7. Following this, the distribution of those lengths is presented in Figure E.8. It is noted that less than 1% of vessels did not broadcast their vessel length, all of which were recreational vessels.
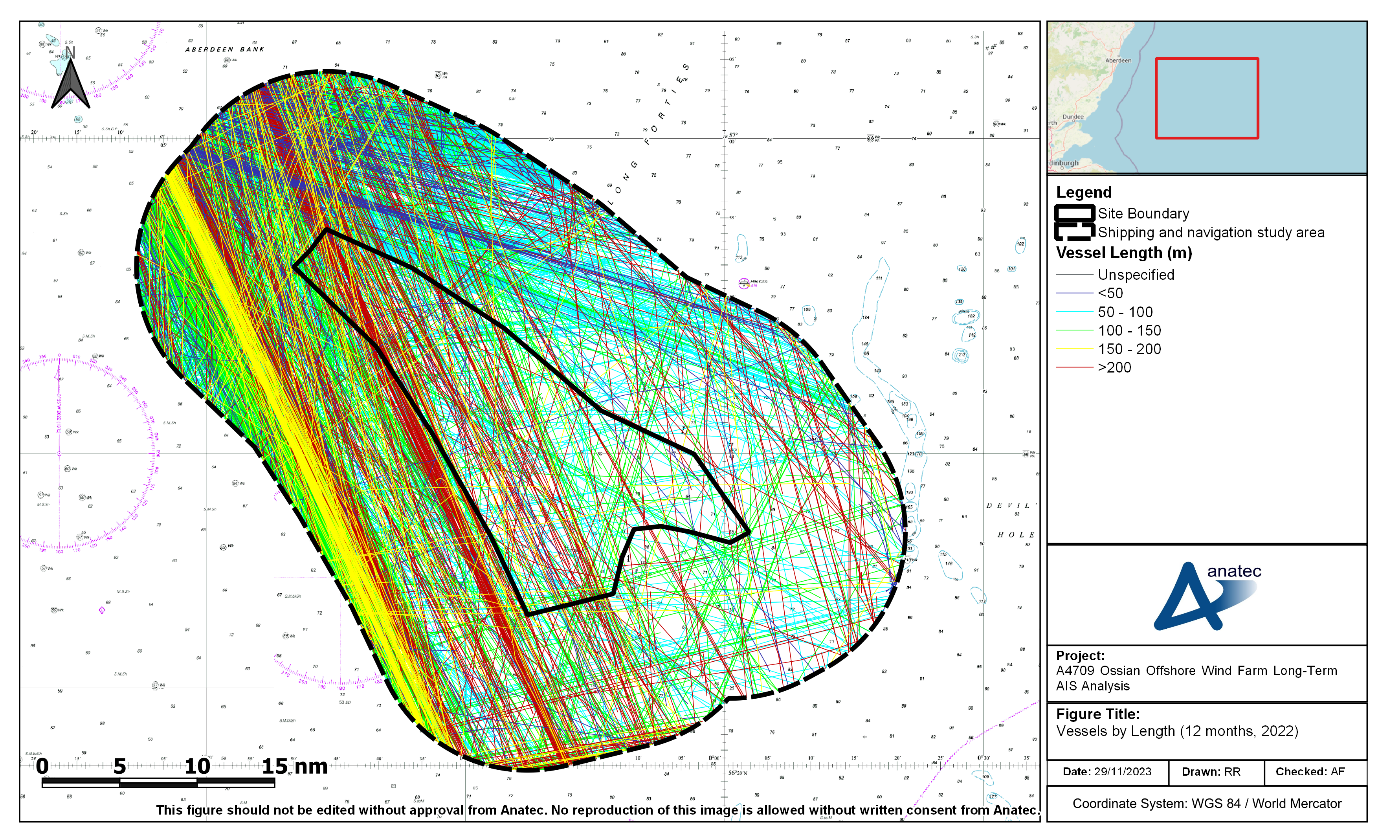
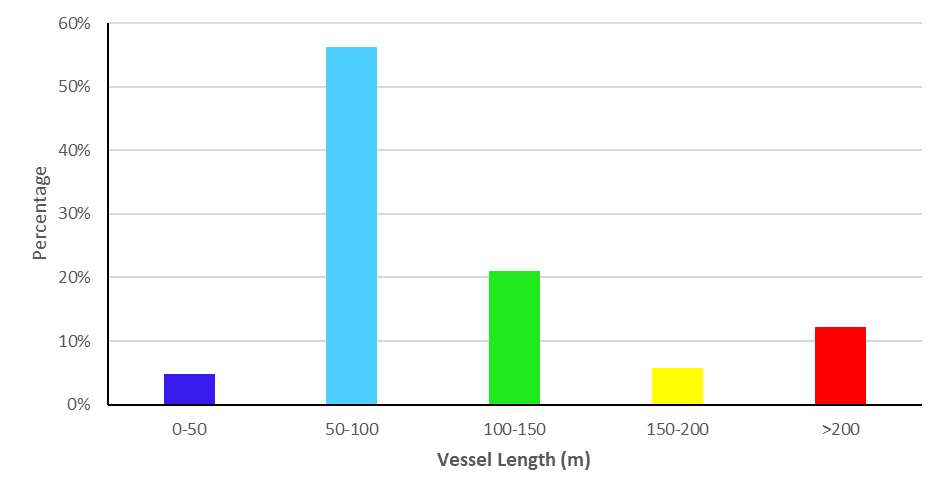
- Distribution of Vessel Lengths Recorded Within the Shipping and Navigation Study Area Across 12 Months in 2022
- The average length of vessels recorded during 2022 was 114 m. The greatest LOA was 300 m recorded for two unique container cargo vessels and one cruise liner. Over half of all unique vessels (56%) were between 50 m and 100 m; this was mainly made up of oil and gas vessels, small cargo vessels, and tankers. The larger vessels were all commercial vessels, in particular cruise liners, bulk carriers, shuttle tankers, and crude oil tankers, mainly transiting north-south through the shipping and navigation study area. The smaller vessels were primarily fishing vessels and oil and gas vessels recorded to the north of the site boundary.
- Vessel Type
- This section reviews the vessel activity within the shipping and navigation study area during 2022 for each of the main vessel types.
- Oil and Gas Vessels
- Oil and gas vessels made up 44% of all vessels recorded on AIS during 2022. Figure E.9 presents all oil and gas vessels recorded on AIS within the shipping and navigation study area during 2022.
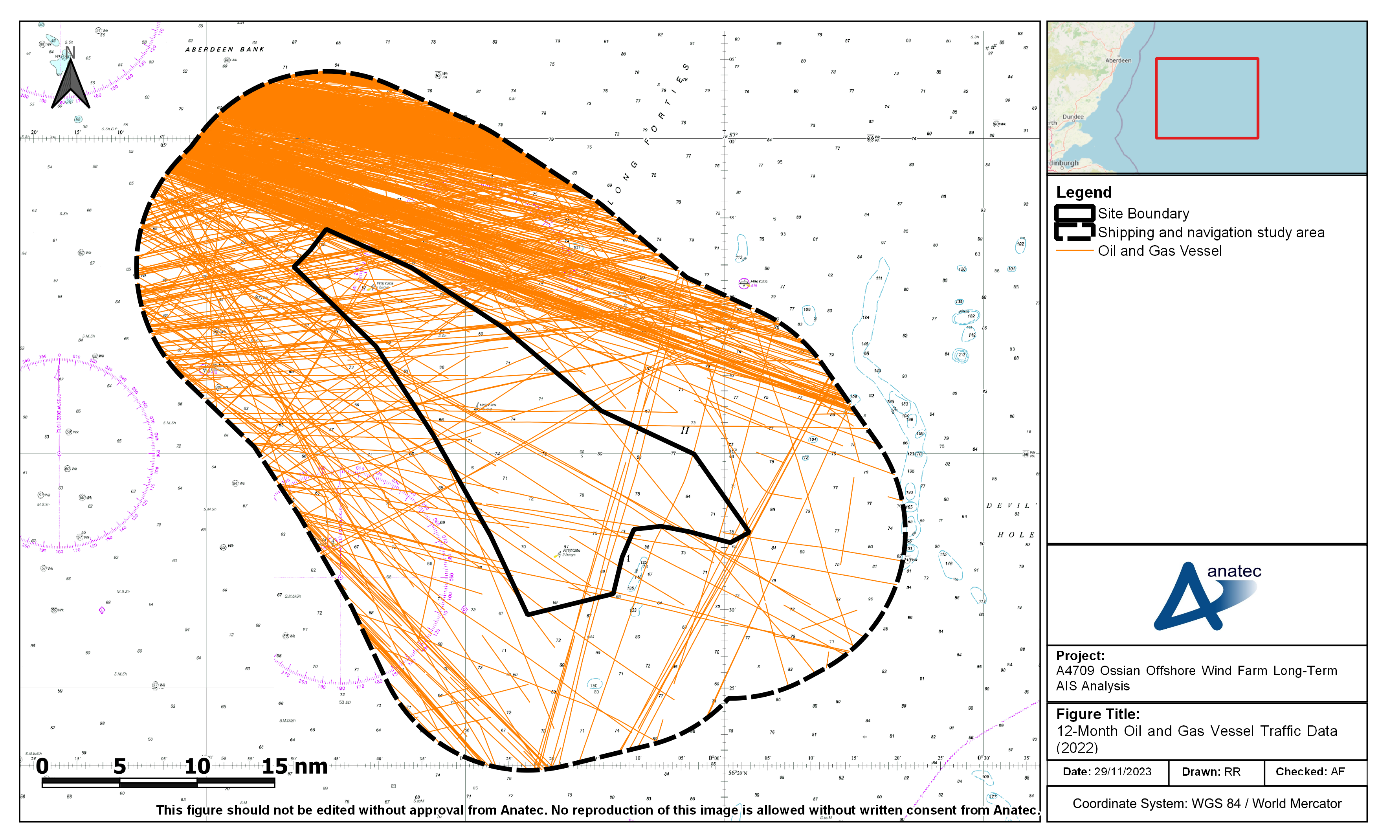
- As per section E.4.1.3, oil and gas vessels were the most commonly recorded vessel type within the shipping and navigation study area. The majority of oil and gas vessels were observed transiting to the north of the site boundary on a north-west/south-east transit headed between Aberdeen and the Catcher, Stella, Fulmar and Judy Fields, as well as various other oil and gas fields and platforms within the North Sea. Only 9% of oil and gas vessels recorded intersected the site boundary, with the majority of these vessels on an east/west transit between Aberdeen or Montrose and various oil and gas fields within the North Sea.
- Figure E.10 presents the average number of unique oil and gas vessels recorded per day for each month within the shipping and navigation study area during 2022.
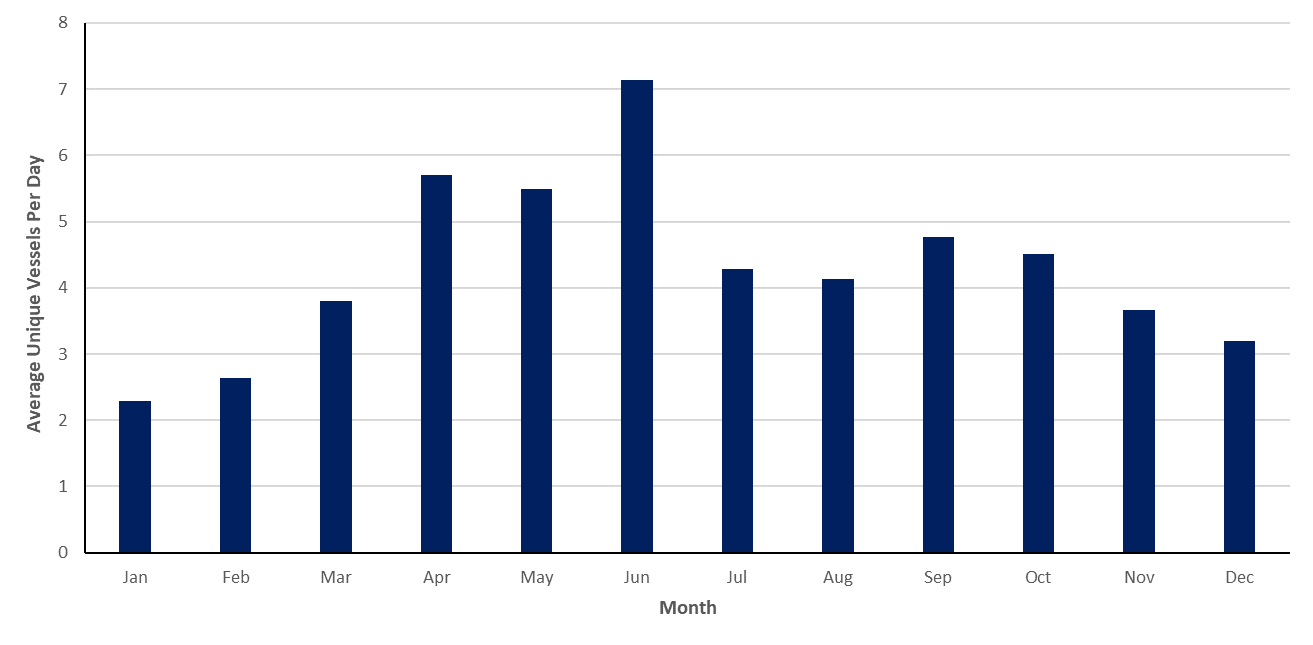
- Average Daily Oil and Gas Vessels per Month Within the Shipping and Navigation Study Area (12 months, 2022)
- Oil and gas vessels showed seasonal variation with higher average numbers recorded in the late spring/early summer months with fewer vessels recorded in the winter months in comparison. On average, there were four unique oil and gas vessels recorded per day within the shipping and navigation study area across 2022. June 2022 was the busiest month for oil and gas vessels when vessel activity peaked with an average of seven unique vessels recorded each day. January 2022 was the quietest month with an average of two unique vessels recorded each day.
- Cargo vessels made up 36% of all vessels recorded on AIS during 2022. Figure E.11 presents all cargo vessels recorded on AIS within the shipping and navigation study area during 2022.
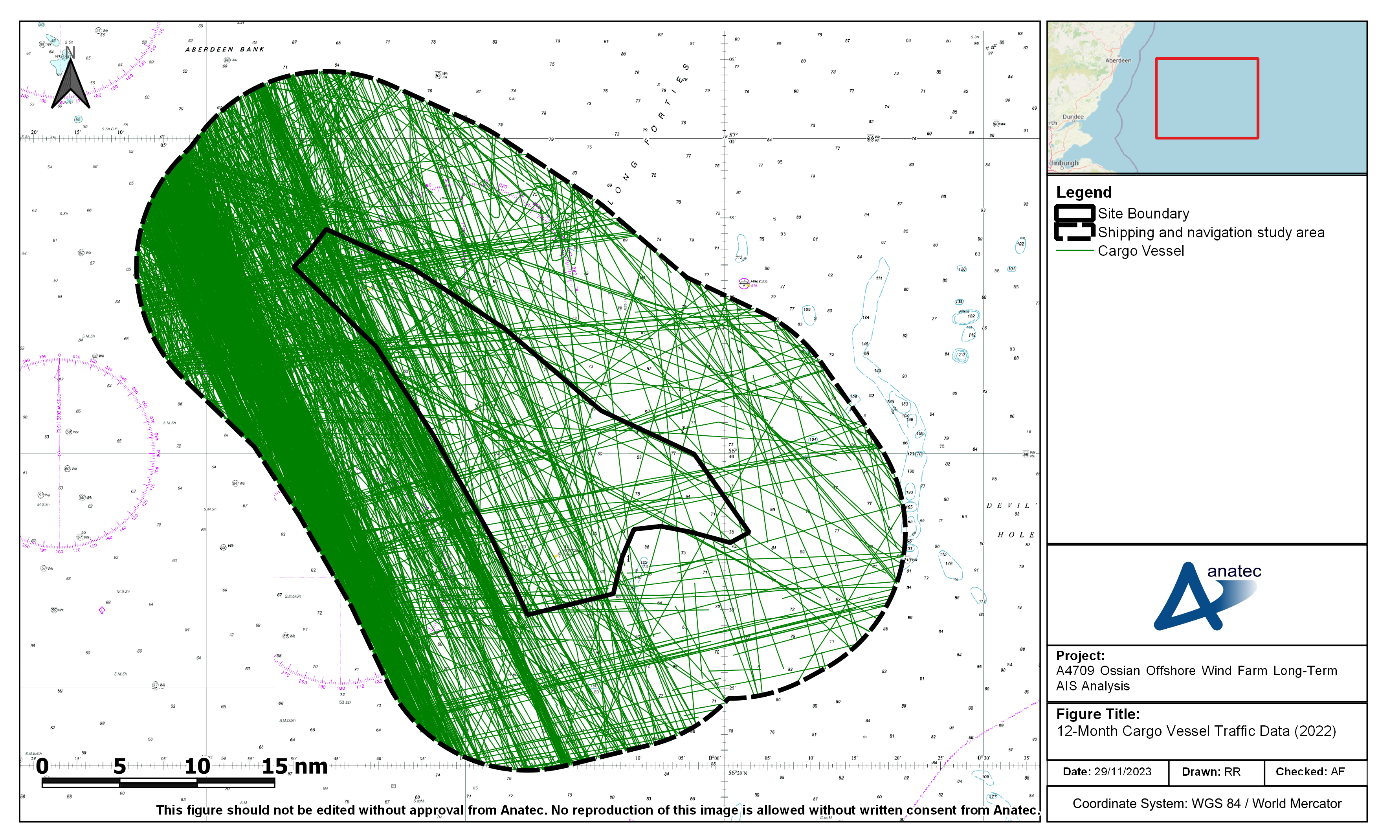
- The highest proportion of cargo vessels were observed to the west of the site boundary on defined coastal routes heading north/south. In some infrequent instances, cargo vessels utilising these routes on a regular basis passed further offshore. This may be due to Master preference but could also indicate potential adverse weather routeing. Various cargo vessels were also recorded transiting east/west through the site boundary with 23% of all cargo vessels recorded in the shipping and navigation study area intersecting the site boundary.
- The main cargo sub-type recorded was general cargo (39% of all cargo vessels recorded). Vehicle carriers (16%), bulk carriers (16%), and container vessels (14%) were also common.
- Roll-on/Roll-off (Ro-Ro) cargo vessels, which are a particularly sensitive user given their timetabled services, were infrequent; six transits (less than 1%) were recorded during 2022. These vessels were not on designated routes.
- Figure E.12 presents the average number of unique cargo vessels recorded per day for each month within the shipping and navigation study area during 2022.
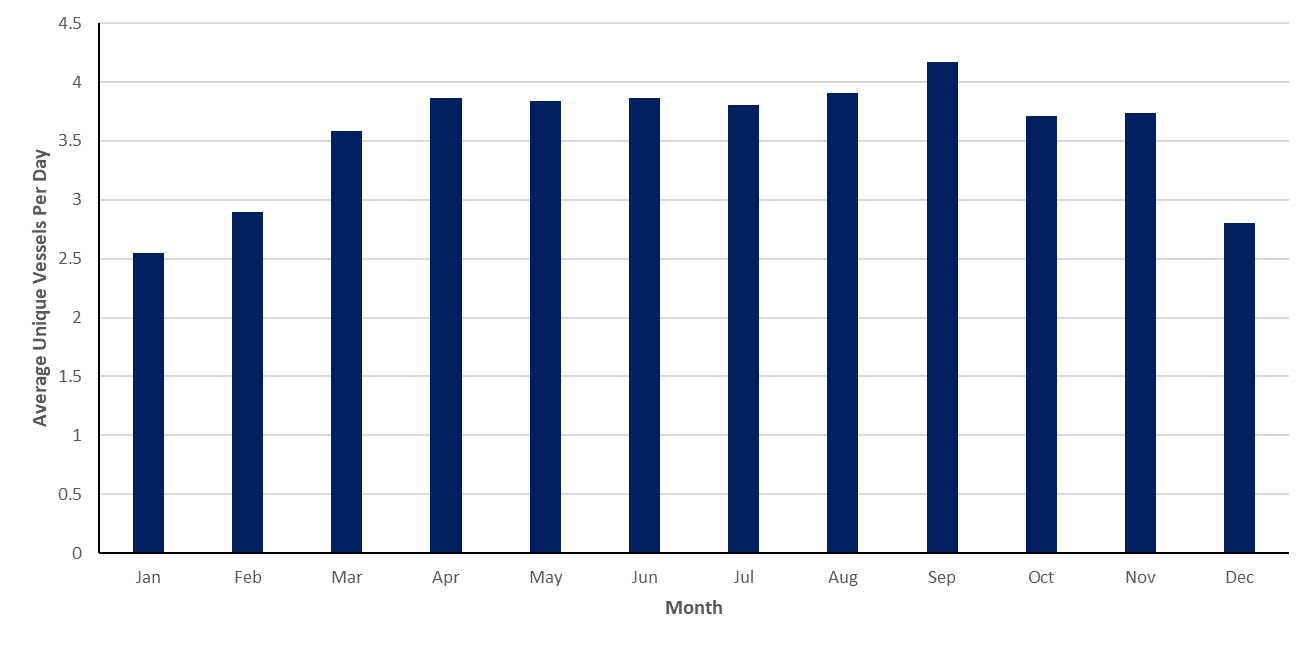
- Average Daily Cargo Vessels per Month Within the Shipping and Navigation Study Area (12 months, 2022)
- Cargo vessels showed slight seasonal variation and on average there was between three and four unique cargo vessels per day recorded within the shipping and navigation study area during 2022, with average numbers per day slightly lower in winter months. September 2022 was the busiest month for cargo vessels with an average of four unique vessels recorded per day. January 2022 was the quietest month with an average of two to three unique vessels recorded per day.
- Tankers made up 10% of all vessels recorded on AIS during 2022. Figure E.13 presents all tankers recorded on AIS within the shipping and navigation study area during 2022.
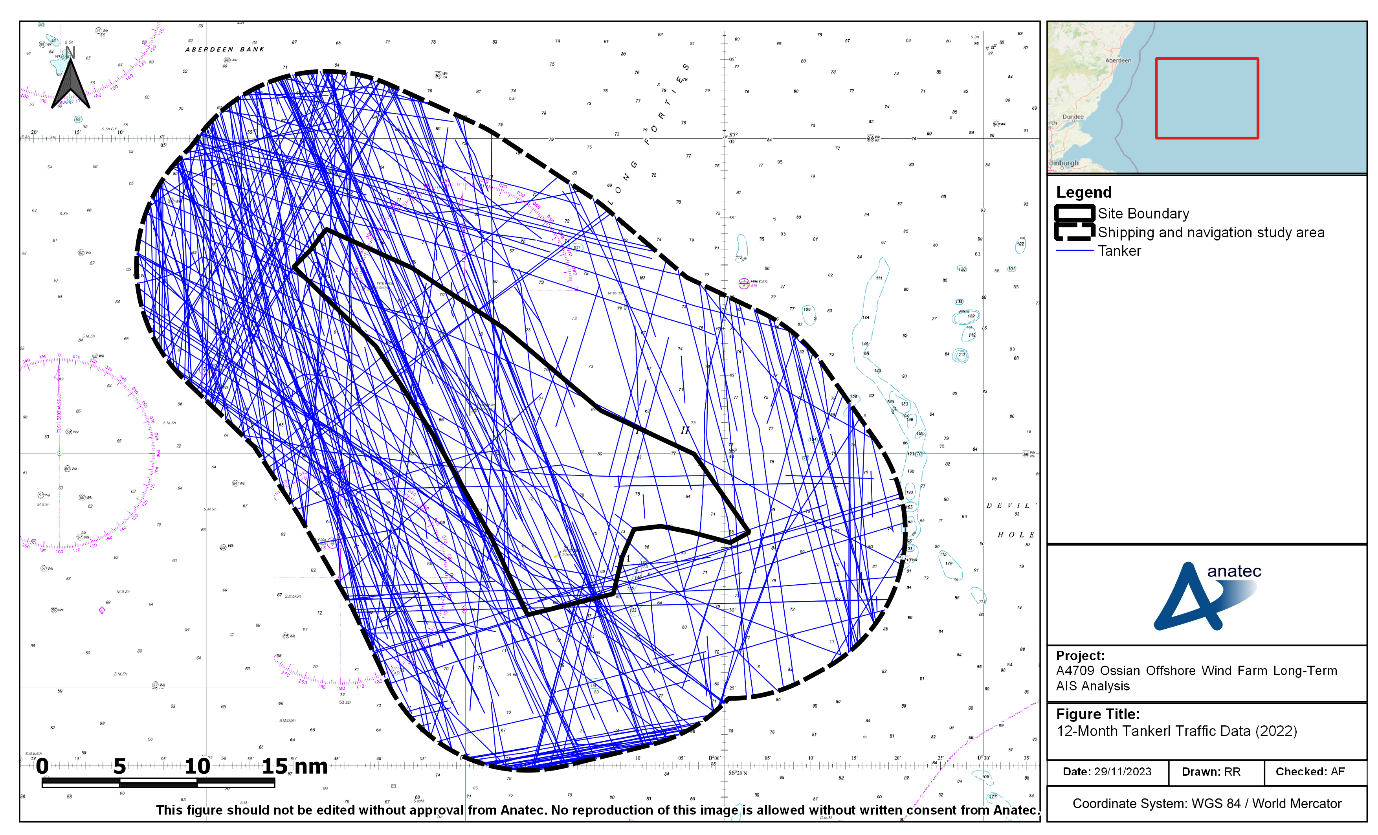
- Tankers were recorded transiting in various directions across the shipping and navigation study area with defined east/west routeing noted at the southern extent of the shipping and navigation study area, between ports in the Forth and the Baltic Sea. North-west/south-east routeing, mainly between Aberdeen and the Catcher Oil Field, was also recorded alongside north/south coastal routeing throughout the shipping and navigation study area, including through the site boundary, with approximately 27% of all tankers intersecting the site boundary.
- The most common tanker sub types recorded during 2022 was crude oil tankers (37%), combined oil/chemical tankers (24%), and chemical tankers (11%).
- Figure E.14 presents the average number of unique tankers recorded per month within the shipping and navigation study area during 2022.
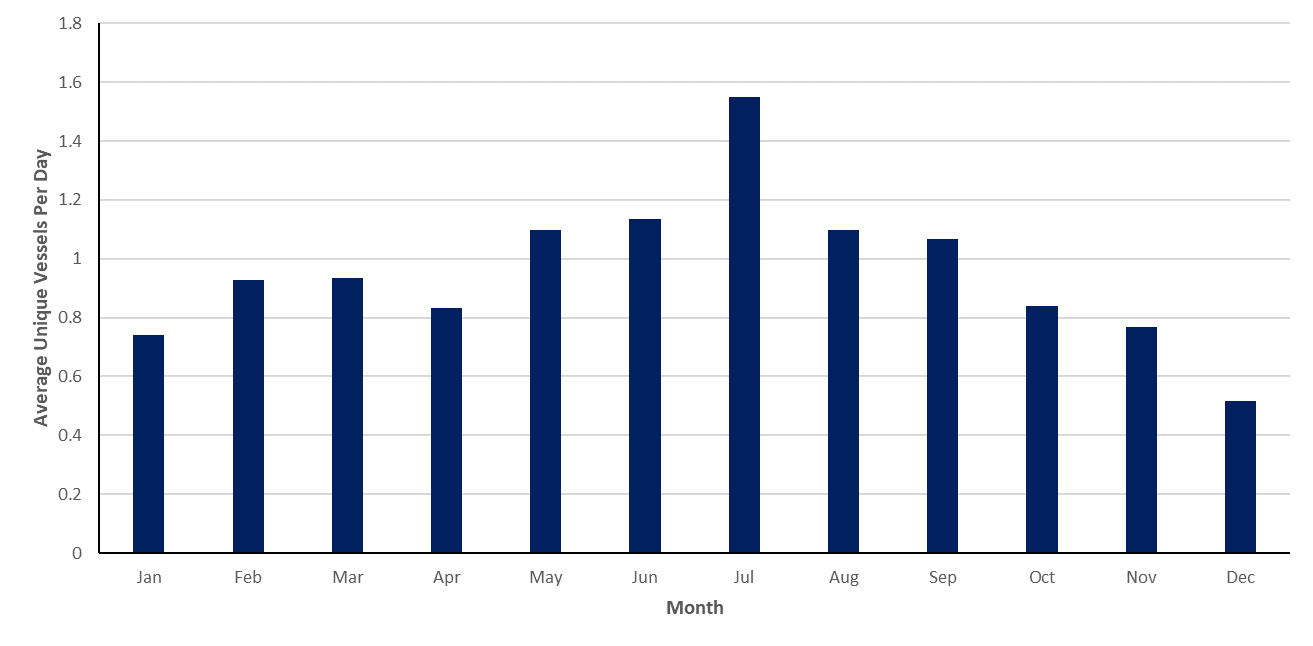
- Tankers showed minimal seasonal variation with marginally higher average numbers per day recorded in the summer months when compared to the winter months. July 2022 was the busiest month for tankers with an average of one to two tankers recorded per day within the shipping and navigation study area. December 2022 was the quietest month with an average of one tanker recorded every two days throughout the shipping and navigation study area.
- Fishing vessels made up 4% of all vessels recorded on AIS during 2022. Figure E.15 presents all fishing vessels recorded on AIS within the shipping and navigation study area during 2022, colour-coded by fishing activity. Fishing activity was determined by vessel speed, destination, track behaviour, and navigational status information transmitted via AIS. It is considered that a proportion of vessels were recorded on transit before and after being identified in active fishing activity. As AIS carriage is only mandatory for fishing vessels of 15 m length and over, it is likely that fishing vessel activity is underrepresented due to this assessment being AIS-only.
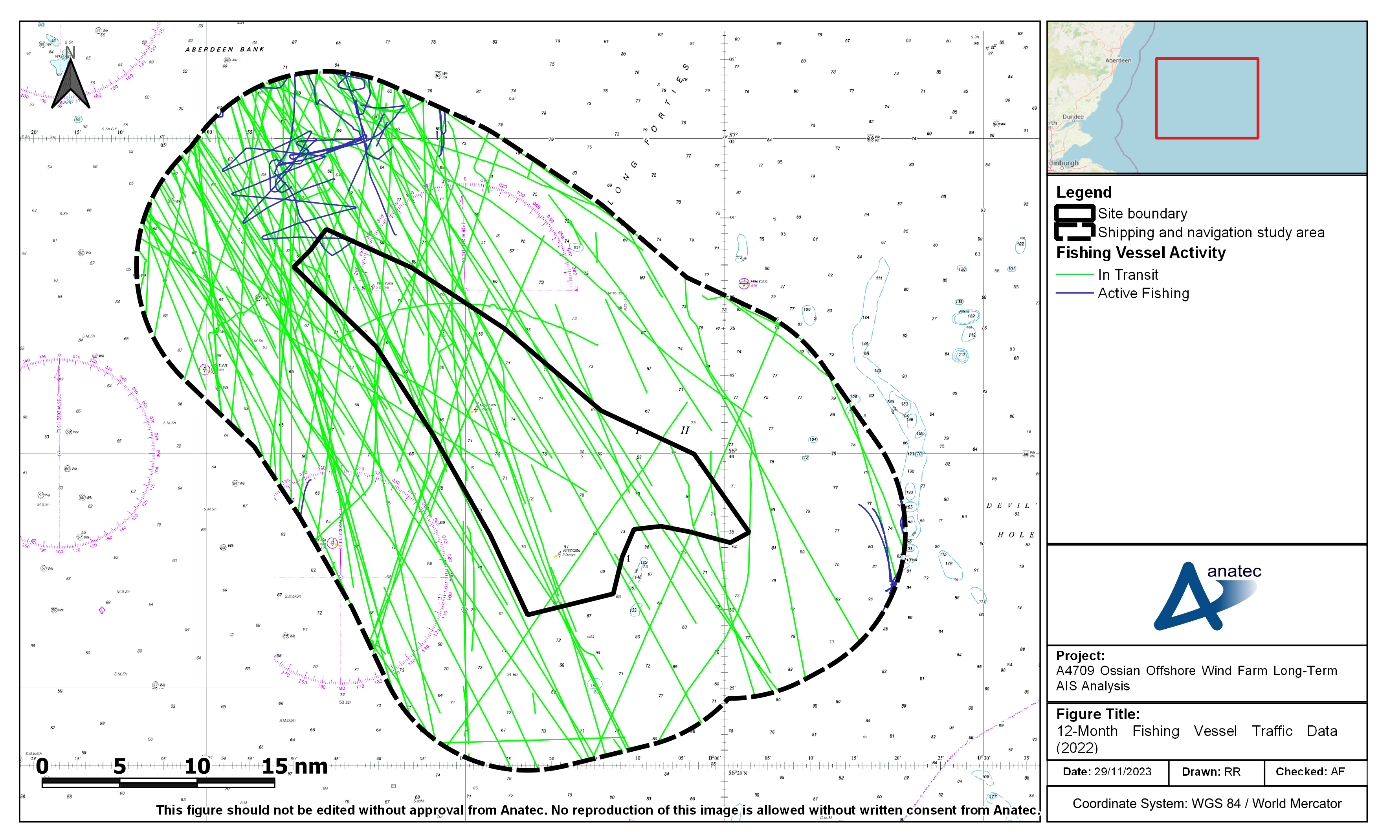
- Overall, fishing was relatively low in the shipping and navigation study area across 2022 with the majority of vessels in transit to/from fishing grounds notably transiting north-west/south-east. Only a small proportion of fishing vessels were considered to be involved in likely active fishing activity. These vessels were noted to the south-east extent and the north of the shipping and navigation study area, and only engaged in likely activity during the months of May, June, and September 2022. Approximately 32% of fishing vessels intersected the site boundary during 2022 and approximately 14% of all fishing vessels recorded were likely engaged in fishing activities.
- Figure E.16 presents the average number of unique fishing vessels recorded per month within the shipping and navigation study area during 2022.
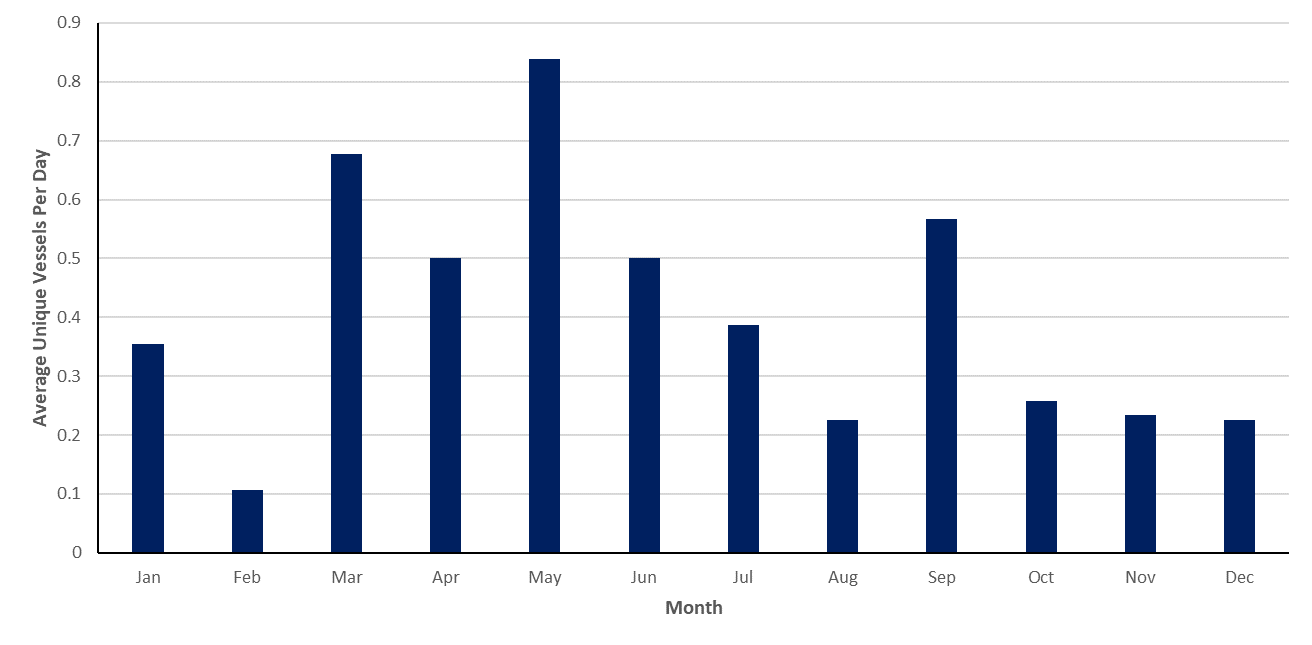
- Average Daily Fishing Vessels per Month Within the Shipping and Navigation Study Area (12 months, 2022)
- The presence of fishing vessels can be regarded as seasonal with a greater average of unique vessels per day being recorded across the spring and summer months when compared with winter. On average, one fishing vessel was seen within the shipping and navigation study area every two to three days across 2022. May 2022 was the busiest month for fishing vessels with an average of one vessel recorded per day within the shipping and navigation study area. February 2022 was the quietest month with only three unique vessels being recorded across the whole month, averaging at one vessel every nine days.
- Recreational vessels made up less than 1% of all vessels recorded on AIS during 2022. Figure E.17 presents all recreational vessels recorded on AIS within the shipping and navigation study area during 2022. Following this, the average number of unique recreational vessels recorded per month within the shipping and navigation study area during 2022 is presented in Figure E.18. It is noted that AIS data is likely to underrepresent recreational activity.
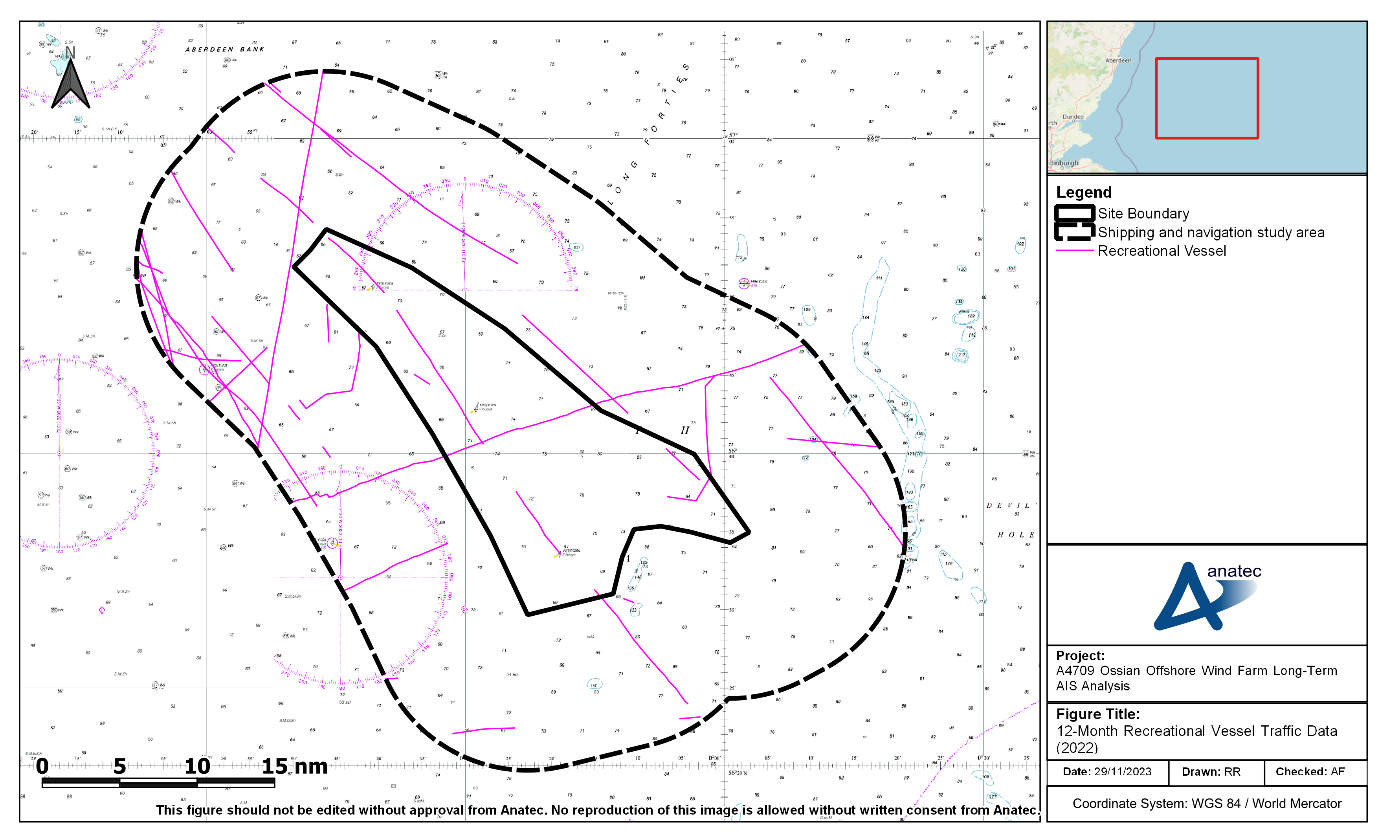
- Recreational Vessels Recorded Within the Shipping and Navigation Study Area Across 12 Months in 2022
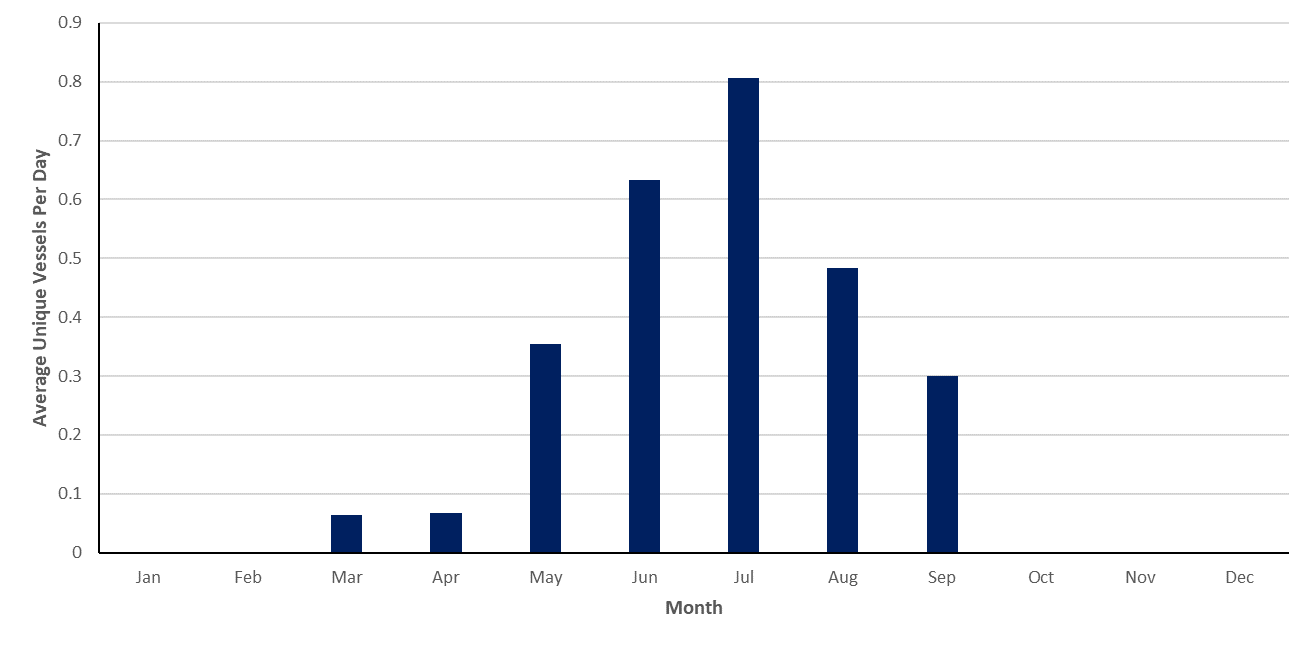
- Average Daily Recreational Vessels per Month Within the Shipping and Navigation Study Area (12 months, 2022)
- Recreational vessels were highly seasonal with vessels only recorded within the shipping and navigation study area from March to September 2022, noting this would be expected given recreational activity would generally tend to be most prevalent during summer conditions, particularly far offshore. An average of one recreational vessel was recorded within the shipping and navigation study area every five days. July 2022 was the busiest month for recreational vessels with an average of one unique vessel being recorded per day. Approximately 17% of recreational vessels intersected the site boundary, with north-west/south-east routeing most prominent.
- Figure E.19 presents the vessel tracks that intersected the site boundary during 2022.
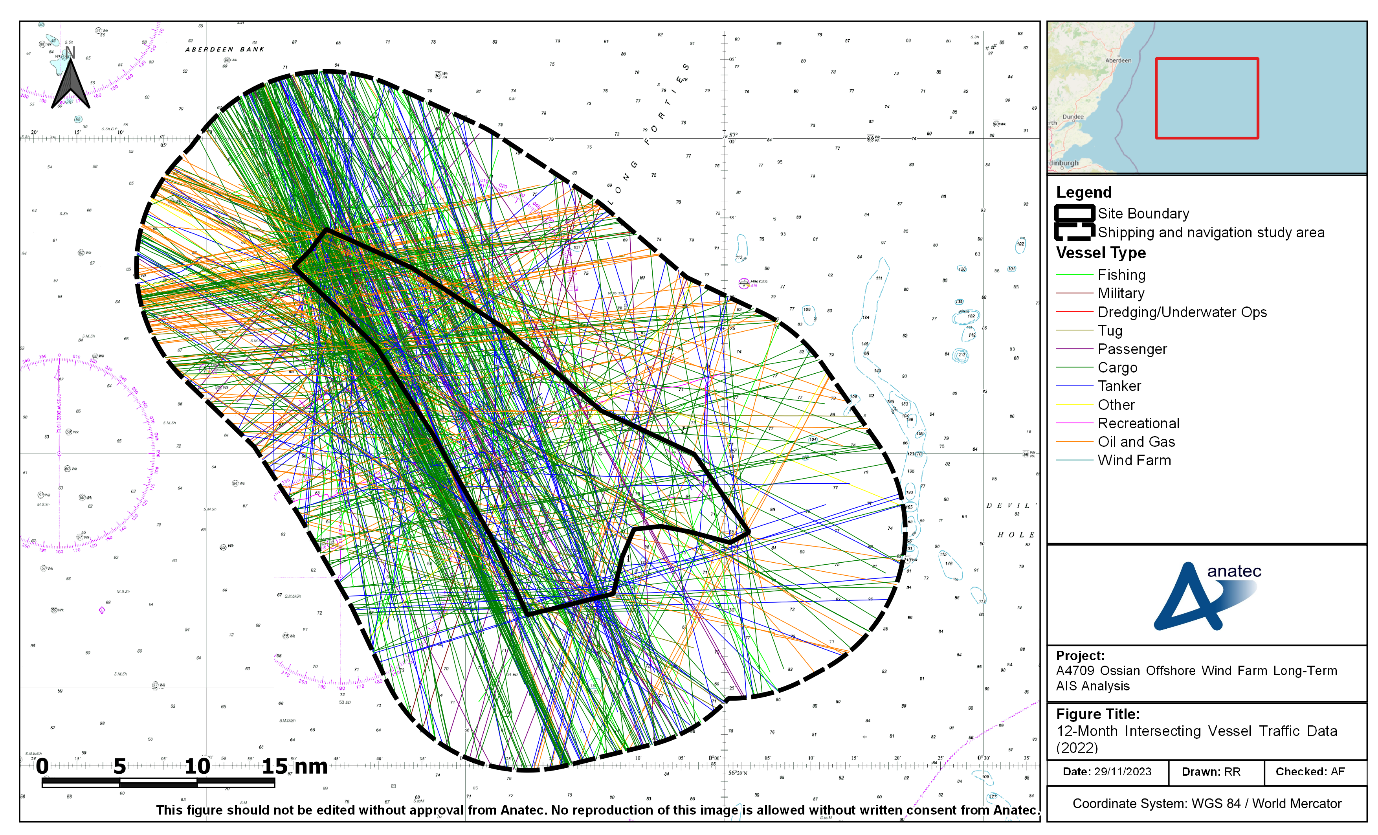
- On average, two unique vessels per day intersected the site boundary. The busiest month for intersecting vessel traffic was June 2022, when an average of three unique vessels per day were recorded, and the quietest month was January 2022, when one unique vessel per day intersected.
- The vessel type distribution of vessels which intersected the site boundary during 2022 is presented in Figure E.20.
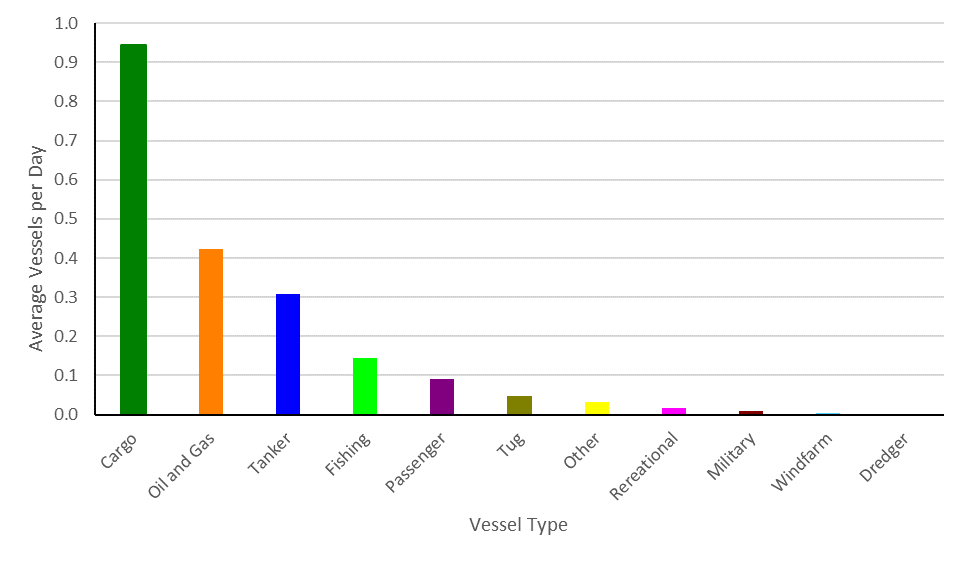
- The most common vessel type recorded intersecting the site boundary was cargo vessels (47%). Oil and gas vessels (21%) and tankers (15%) were also common vessel types. Overall, 21% of all vessels recorded within the shipping and navigation study area intersected the site boundary across 2022.
- Summary
Summary
- A summary of the average unique vessels counts per day for the main vessel types for the shipping and navigation study area during the long-term data period are presented in Table E.1. A comparison with the average unique vessels counts per day from the winter and summer vessel traffic survey datasets are also presented here.
Vessel Type | Average Vessels per Day within Shipping and Navigation Study Area | ||
|---|---|---|---|
Long-term Data Period | Winter 2022 Survey | Summer 2023 Survey | |
Oil and gas | 4 | 4 | 3-4 |
Cargo | 3-4 | 3-4 | 4-5 |
Tanker | 1 | 1 | 1-2 |
Fishing | 0-1 | 0-1 | 1-2 |
Recreational | 0-1 | 0 | 0-1 |
All Vessels | 9-10 | 9 | 11 |
- Unique vessel counts per day within the shipping and navigation study area from the long-term data generally align with those recorded from the winter survey carried out in December 2022 and the summer survey carried out in July 2023.
- Conclusion
Conclusion
- This appendix presents the analysis of the AIS data recorded during the entirety of 2022 within the shipping and navigation study area surrounding the site boundary. The aim of this appendix was to capture long-term activity within the area and to assess any seasonal variation in vessel volumes or behaviours.
- On average, nine to ten unique vessels per day were recorded within the shipping and navigation study area (excluding any temporary traffic). The most common vessel types recorded were oil and gas (44% of all vessels recorded), cargo vessels (36%), and tankers (10%). The average length of vessels recorded within the shipping and navigation study area during 2022 was 114 m.
- Overall, 21% of vessel traffic within the shipping and navigation study area intersected the site boundary. The most common vessel types to intersect was cargo vessels (47% of all intersecting vessel traffic), oil and gas vessels (21%), and tankers (15%).
- In terms of seasonal variation, seasonality was most prevalent in recreational vessels with no vessels being recorded during the months out with March to September 2022, and a peak in vessel numbers in July 2022.
- Fishing vessels were recorded all year round with higher volumes between March and September 2022. Fishing peaked in May 2022 with the quietest month being February 2022. Little active fishing was recorded within the shipping and navigation study area with activity only present to the south-east extent of the shipping and navigation study area and to the north of the site boundary. The vessels engaged in likely active fishing were only present during the months of May, June, and September 2022. Of all fishing vessels recorded, 14% were likely engaged in fishing activities.
- Oil and gas vessels showed seasonal variation with only slight seasonality present in cargo vessels and tankers.
- Given broad correlation between the datasets in terms of vessel numbers and routeing patterns, the 12 months AIS has been used as the primary dataset to assess vessel routeing in the NRA as it allows for definition of lower use routes.
[1] A figure was attached showing the routes relative to the Array that would be expected to be undertaken. This figure highlighted the route between Morven and Seagreen 1 Offshore Wind Farms and the route between Bellrock and Campion Offshore Wind Farms.
[2] It is noted that next to each of these aids to navigation on the Admiralty chart is the note “2 buoys”.
[3] A template is a large steel structure which is used as a base for various subsea structures, e.g. wellheads.
[4] Noted that mobilisation stations detailed as Tighnabruaich, Mallaig and Humber within the data, which may be an error in the data based on distance to site.
[5] Includes only incidents reported to an accident investigation branch or an anonymous reporting service. Unconfirmed incidents have not been considered, noting that to date (November 2023), only one further incident has been alleged but there is no evidence to confirm its occurrence.
[6] It is acknowledged that other theoretical analysis has been undertaken.
[7] Distance bordered on both sides by wind turbines is approximately 10 nm, which would require a distance of approximately 4nm between the Array and the Bellrock array under the MGN 654 20 degree corridor guidance. The actual width exceeds this, noting it also exceeds the minimum of 3.5 nm that would be required under the Shipping Template (Annex 2 to MGN 654)
[8] April 2022 was observed to be busiest month for fishing vessel numbers in the Array in the 12 months AIS – the AIS from this month was therefore used as the primary basis of the modelling assessment, with results then factored up to account for overall fishing vessel numbers recorded in 2022.
[9] As per SI 2007 No 1948 “The Electricity (Offshore Generating Stations) (Safety Zones) (Application Procedures and Control of Access) Regulations 2007
[10] For the purposes of this assessment, UK waters is defined as the UK European Economic Zone and UK territorial waters refers to the 12 nm limit from the British Isles, excluding the Republic of Ireland.
[11] Vessels included in the ‘All Other’ category include military, dredger/subsea operations, other, and wind farm.