1. Introduction
- This Socio-economic Technical Report provides the approach to the economic impact assessment associated with volume 2, chapter 18 of the Array Environmental Impact Assessment (EIA) Report for the Ossian Array (hereafter referred to as the ‘Array’), and, at a high level, Ossian as a whole (term used to refer to the Array, the Proposed offshore export cable(s) and the Proposed onshore transmission infrastructure (comprising the Proposed onshore export cable(s) and Proposed onshore converter station(s))). This document primarily focuses upon the economic impacts associated with the Array and Ossian as a whole, and determines the PDE Option which has the least beneficial economic impacts to be taken forward as the maximum design scenario (MDS) for the socio-economics assessment (volume 2, chapter 18). It should be noted that the social impacts associated with the Array are not specifically discussed within this technical report but are described and assessed within volume 2, chapter 18.
- It is expected that the capacity of Ossian will be up to 3.6 GW, dependent upon the number and capacity of wind turbines installed, within the parameters of the Project Design Envelope (PDE) (see volume 1, chapter 3). Four options, each with different numbers of wind turbines and capacities have been identified from the PDE, and the economic impact of each option has been estimated and presented within this technical report. Each option presented below is based upon a capacity of up to 3.6 GW:
- Option 1: up to 265 wind turbines;
- Option 2: up to 218 wind turbines;
- Option 3: up to 186 wind turbines; and
- Option 4: up to 130 wind turbines.
- The Array EIA Report is based on the consideration of the maximum design scenario, which for many topics involves assessing the design that has the largest adverse impacts. Many of the economic impacts assessed in the socio-economics EIA chapter are beneficial. This technical report therefore identifies the PDE Option that could generate the lowest beneficial impacts, so that those are the basis of the socio-economics impact assessment in the Array EIA Report.
- It should be noted that the PDE Option identified within this technical report is considered the MDS for the purposes of the socio-economics assessment only. The final detailed design of the Array may incorporate elements of more than one of the PDE Options presented here, depending upon factors such as available technology, supply chain capacity and cost, but will be within the maximum PDE parameters presented in volume 1, chapter 3. Further details on the overarching PDE and MDS approaches for the Array EIA Report are included within volume 1, chapter 3.
2. Methodology
2. Methodology
2.1. Study areas
2.1. Study areas
2.1.1. Approach
2.1.1. Approach
- While a significant proportion of the activity associated with the Array is expected to take place offshore, the relevant study areas for the socio-economic assessment are located onshore.
- The socio-economic study areas for the assessment of effects on employment and economy will be defined in line with the guidance on identification of ‘local areas’ for offshore developments published by the Scottish Government (Scottish Government, 2022a). This guidance identified six principles for identifying local study areas for offshore development:
- Principle 1 (Dual Geographies): The local area for the supply chain and investment impacts should be separate from the local area(s) for wider socio-economic impacts, including tourism and recreation.
- Principle 2 (Appropriate Impacts): The appropriate impacts to be considered for assessments should be identified before defining the local areas.
- Principle 3 (Epicentres): The local areas should include all the epicentres of the appropriate impacts.
- Principle 4 (Accountability): The local areas used in the assessment should comprise of pre-existing economic or political geographies (community councils, local authorities, development agencies) to enhance accountability.
- Principle 5 (Understandable): The local areas should be defined in such a way that they are understandable to the communities they describe.
- Principle 6 (Connected Geography): The local area(s) for the supply chain and investment impacts should consist of connected (including coastal) pre-existing economic or political geographies.
2.1.2. Study Areas for Economic Impact Assessment
2.1.2. Study Areas for Economic Impact Assessment
- The main local epicentres associated with potential socio-economic impacts are expected to be the ports that will be used for the Array. However, at the time of writing these ports are not known, and therefore the following socio-economic study areas have been considered:
- “the Construction Port”, which is the area around the expected construction port(s) (construction phase only);
- “the Operation Port”, which is the area around the expected operation and maintenance port(s) (operation and maintenance phase only);
- Scotland; and
- the United Kingdom (UK).
2.2. Types of Impact
2.2. Types of Impact
- There are three broad phases of the Array that are considered as part of the socio-economic impact assessment:
- construction;
- operation and maintenance; and
- decommissioning.
- For each phase there are three types of economic impact, as demonstrated in Figure 2.1:
- direct impact: this is associated with the direct activities of the Applicant as well as the activities of primary suppliers (e.g. wind turbine suppliers);
- indirect impact (supply chain): this is associated with spending in the wider supply chain of primary suppliers (e.g. secondary suppliers); and
- induced impact (staff spending): this is associated with staff spending their wages and creating impacts in the wider economy.
- Deadweight: this is the activity that would have taken place without Ossian proceeding. It was assumed that there would be no deadweight, i.e. no impact if Ossian didn’t go ahead.
- Leakage: the proportion of activity that might occur outside the socio-economic study areas. This is accounted for by considering the share of spend that occurs in each study area (see section 2.1.2).
- Displacement: the extent to which activity generated by Ossian might displace existing activity elsewhere in the socio-economic study areas. Whilst it is likely that Ossian would compete for resources with other proposed projects, such effects are more likely to relate to the timing of activity. This is discussed further within volume 2, chapter 18.
- Multipliers: this is the wider activity resulting from spending in the supply chain and spending by employees of the Applicant and primary suppliers. The multiplier effects are included in the analysis.
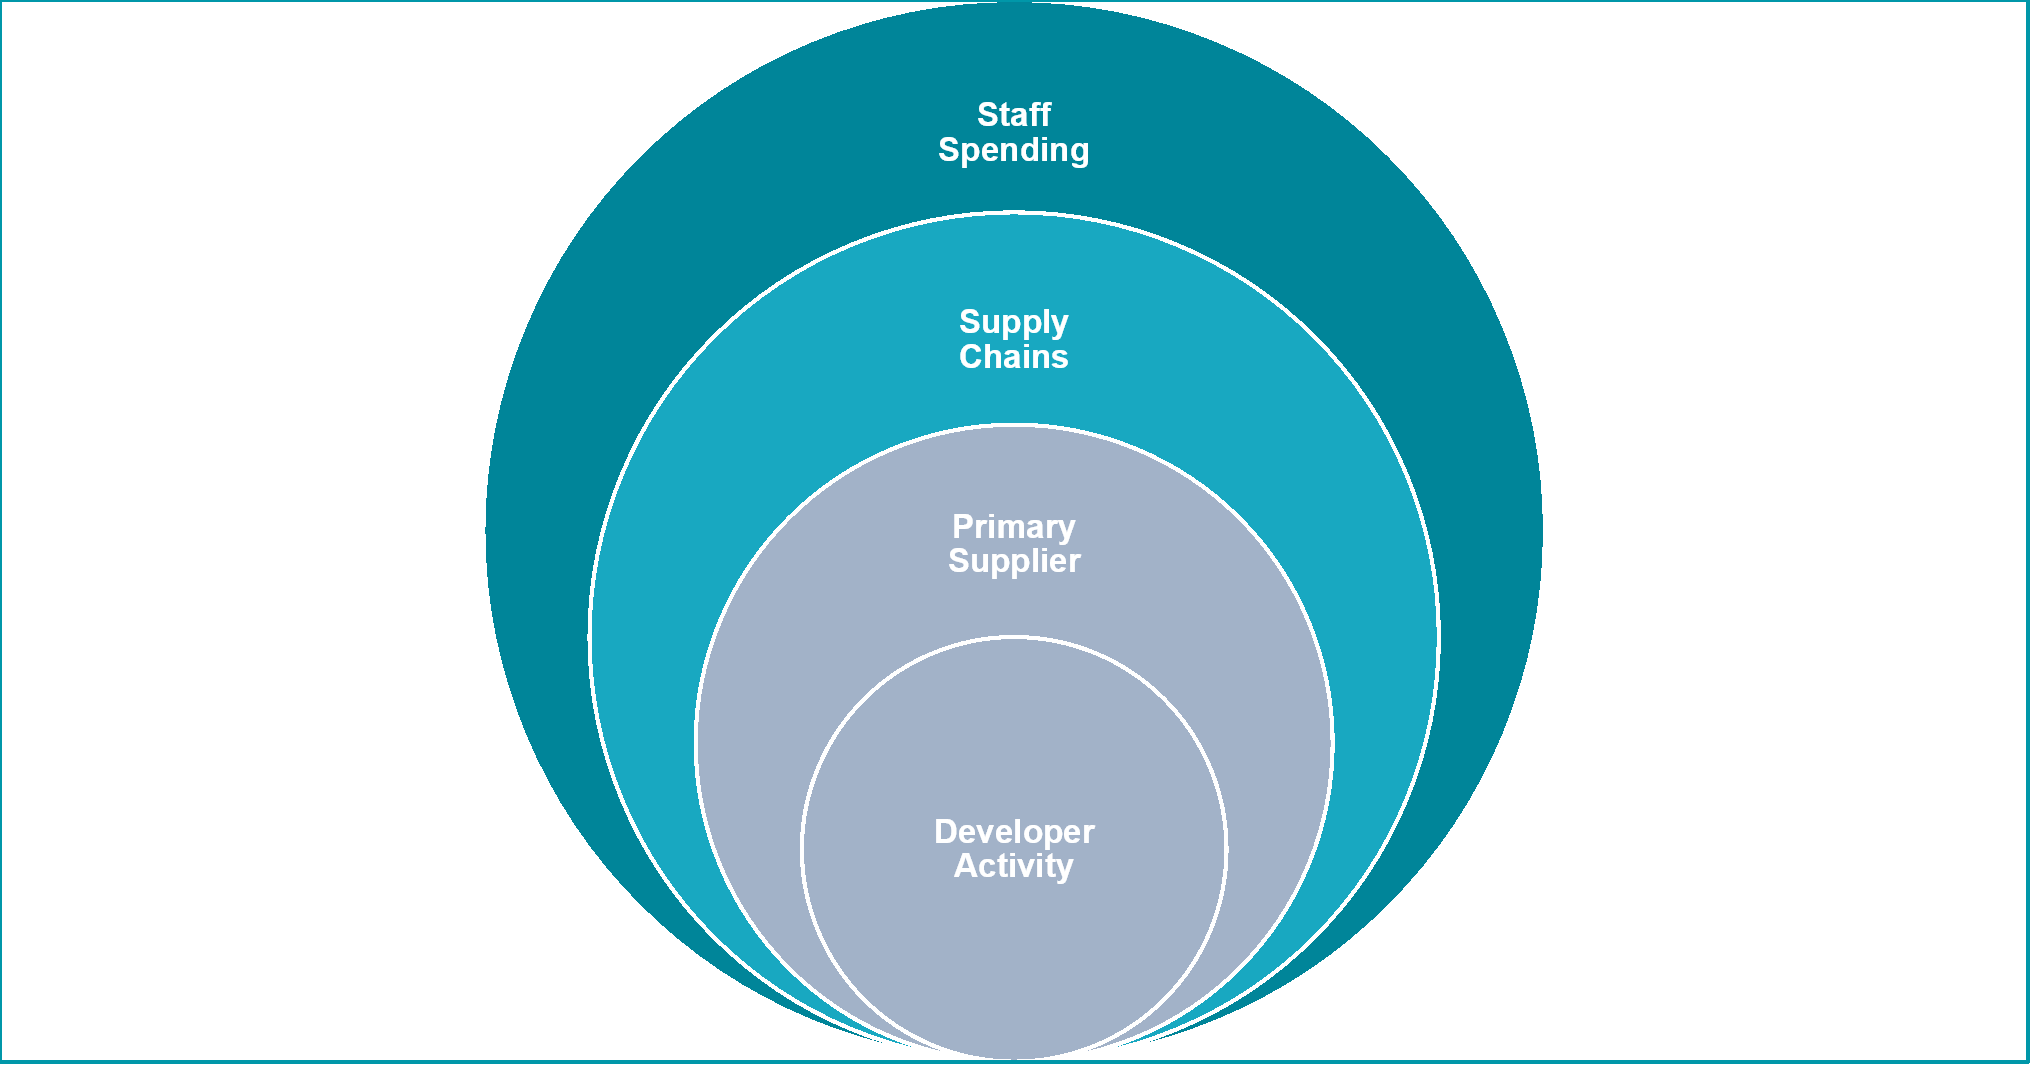
Figure 2.1: Types of Economic Impact
2.3. Metrics of assessment
2.3. Metrics of assessment
- The economic impact has been assessed using three common measures of economic activity, as determined by BiGGAR Economics (hereafter referred to as the “technical expert”) professional judgement and experience:
- Gross Value Added (GVA): this is a measure of economic output; the economic value added by an organisation or industry. It is typically estimated by subtracting the non-staff costs from the revenues of an organisation.
- Years of Employment: this is a measure of employment which is equivalent to one person being employed for an entire year and is typically used when considering short-term employment impact, such as construction employment. This is full-time equivalent (FTE) unless stated otherwise.
- Employment (Jobs): a measure of employment which considers the headcount employment in an organisation or industry. This is FTE unless stated otherwise.
2.4. Estimating Economic Impact
2.4. Estimating Economic Impact
- An offshore wind economic model has been designed by the technical expert to assess the economic impacts associated with offshore wind farms and has been applied to Ossian. The principle of this model has been applied to a number of onshore and offshore wind farm developments and is based on the level of expenditure expected to be associated with construction and with operation and maintenance. An overview of the model is provided in Figure 2.2.
- The first step in assessing the economic impact was estimating the total expenditure, which was based on the Applicant’s Supply Chain Development Statement (SCDS) and other information provided by the Applicant. This is discussed in more detail in section 3.
- Expenditure was broken down into detailed sub-categories, based on information from the Applicant, sector studies, such as BVG Associates Guide to a Floating Offshore Wind Farm (BVG Associates, 2023), and the technical expert’s modelling.
- Using data from the SCDS and technical expert’s own experience of the sector, assumptions were then made about the share of spend associated with each category of expenditure that could be secured in each socio-economic study area, which is also known as leakage (as discussed under paragraph 10).
- Each contract was also assigned to one or more relevant sectors of the economy. To estimate the direct GVA and direct employment impact, data was used from the UK Annual Business Statistics (ONS, 2023), which collects data on turnover, employment and GVA by sector. On this basis, it was possible to estimate the expected FTE employment supported by a given level of turnover in a sector (e.g. expenditure divided by the turnover per employee ratio). Similarly, GVA was estimated by dividing turnover by the turnover/GVA ratio.
- Indirect (supply chain) and induced (staff spending) impacts were then estimated by applying economic multipliers from the Scottish and UK Input Output Tables (Scottish Government, 2022b; ONS, 2022). This collects data on the linkages between different sectors of the economy which allows the wider effects in the economy to be captured, e.g. the impact of £1 million GVA in the construction sector may support impacts in the architecture and engineering sector. These figures are applied to the direct GVA and employment estimates.
- Direct, indirect and induced effects are then summed to estimate the total GVA and employment impacts associated with Ossian. Each sub-category of spend was also assigned to either the Array, or another element of Ossian, allowing for the Array-only economic impact to be estimated.
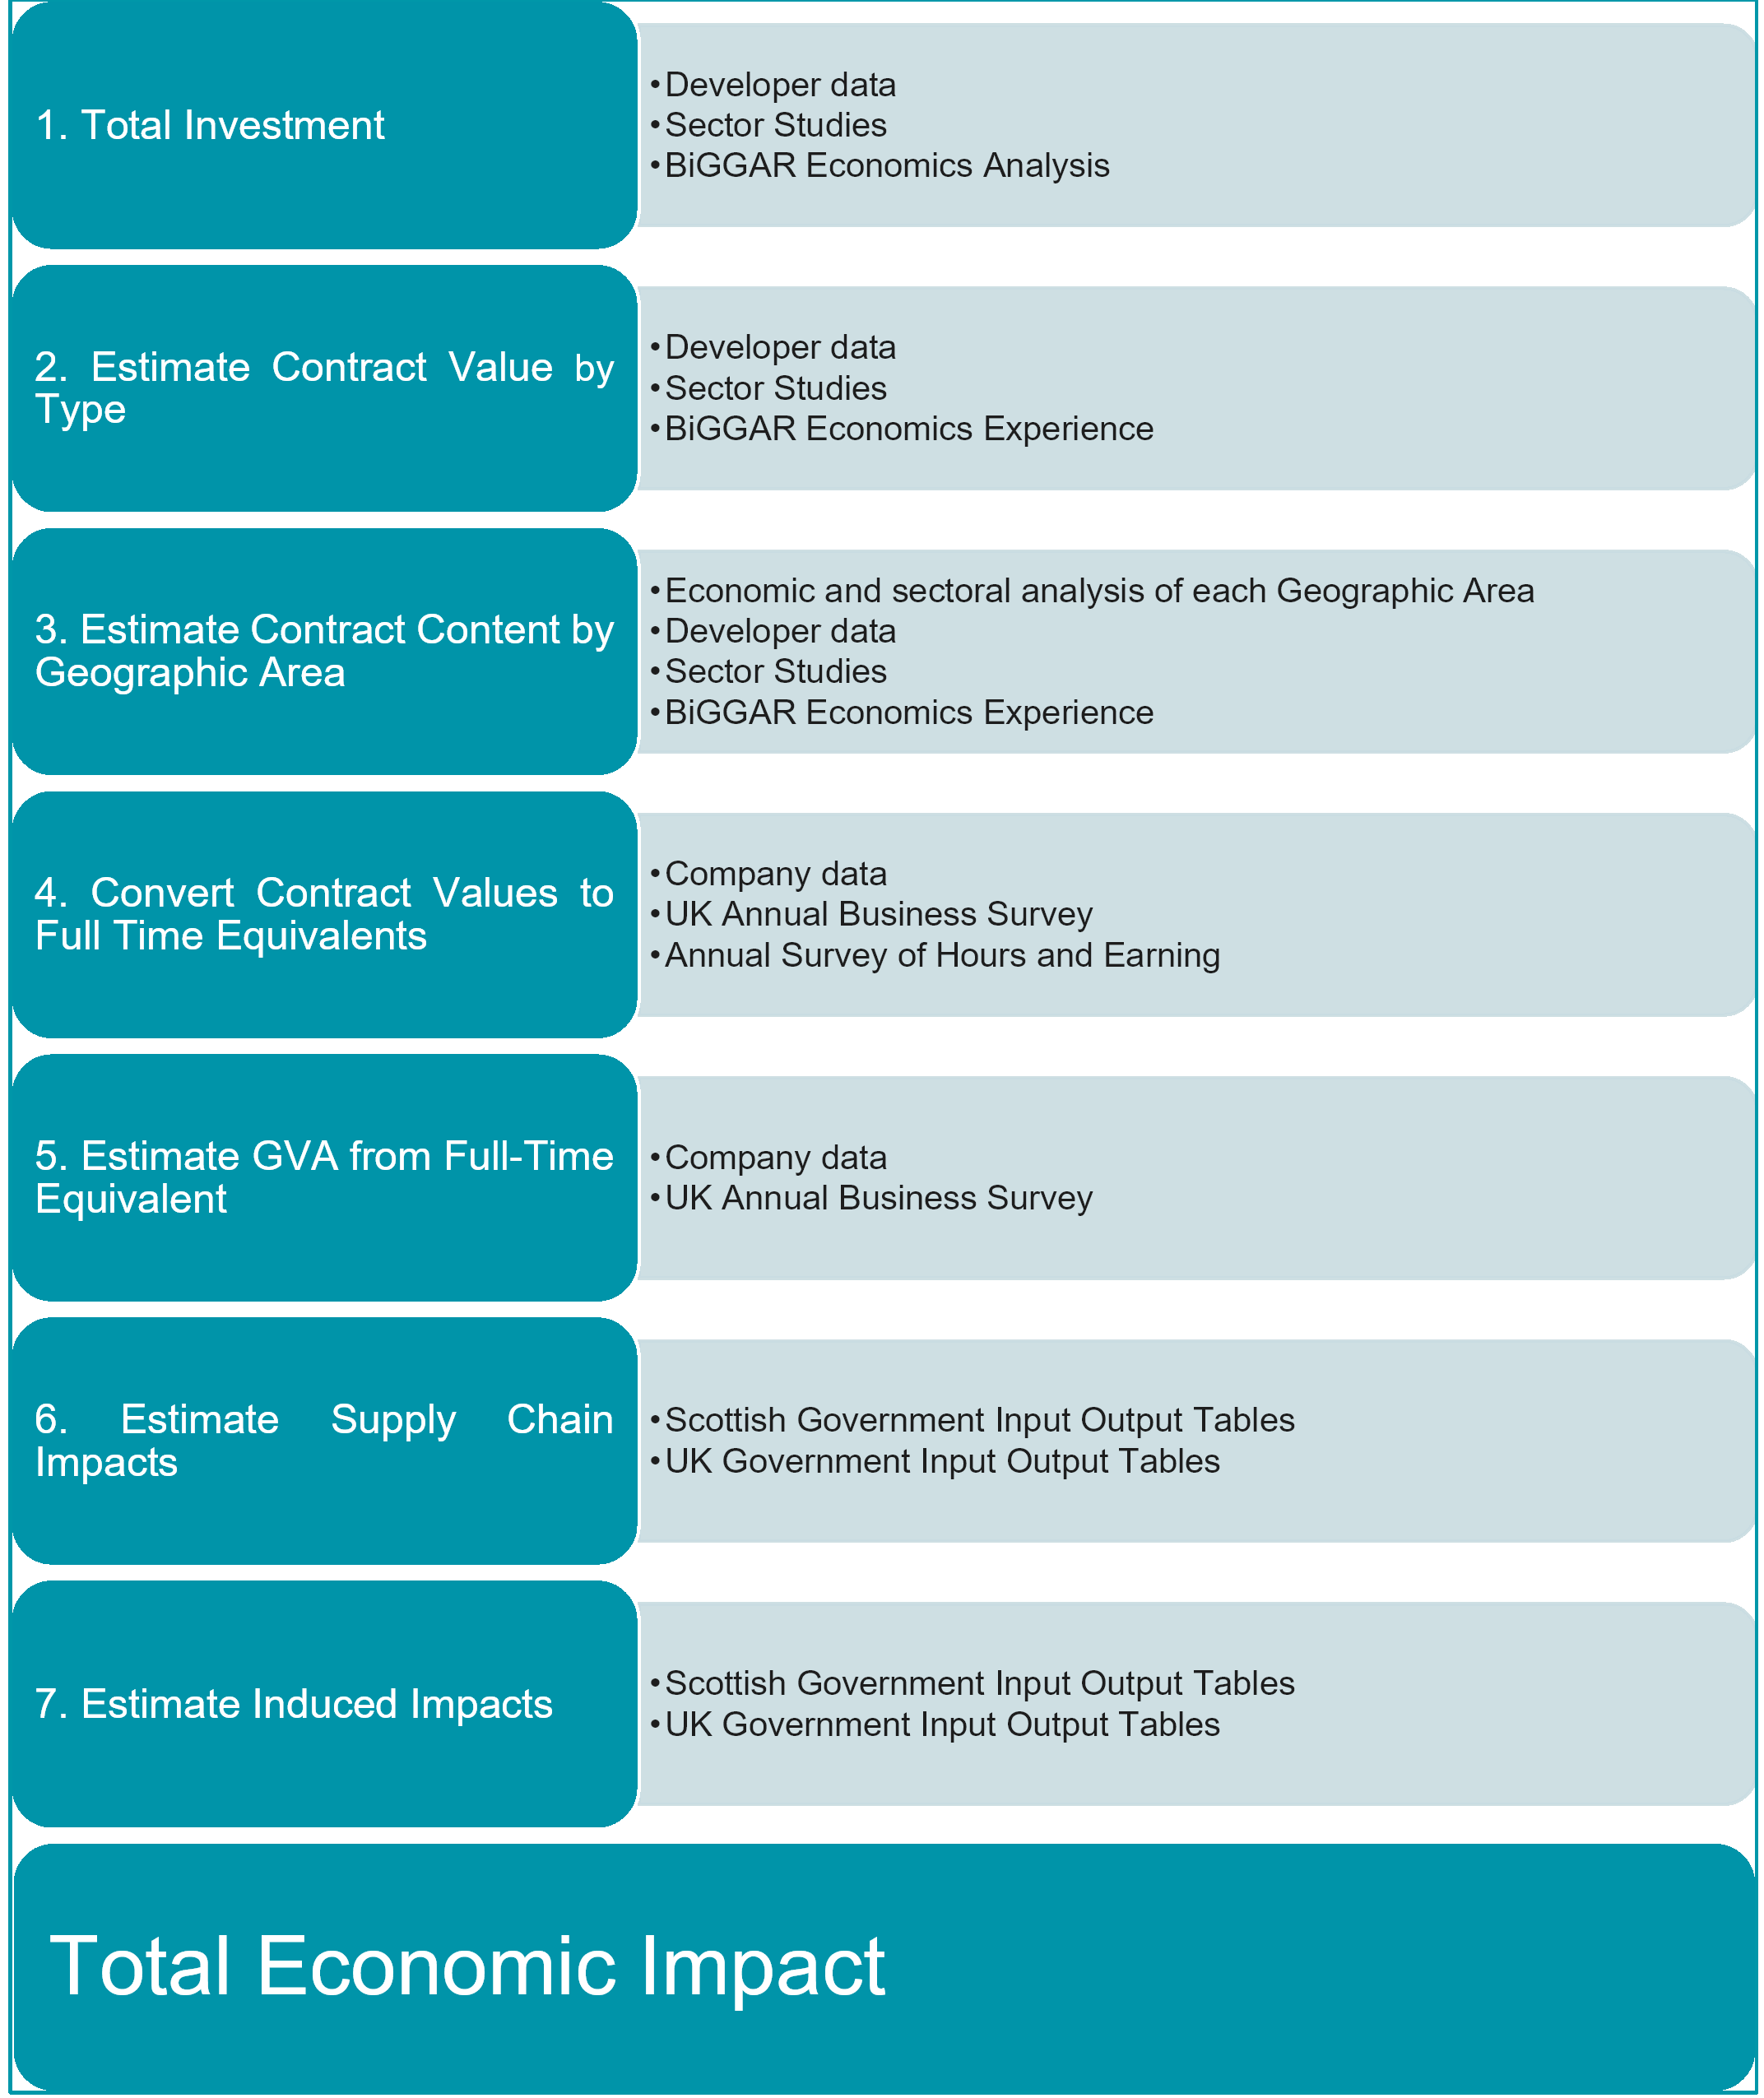
Figure 2.2: Economic Impact Methodology and Data Sources
3. Estimated Expenditure
3. Estimated Expenditure
3.1. Approach
3.1. Approach
- In order to estimate the economic impact of Ossian and the Array, it was first necessary to estimate the total expenditure expected to be associated with each, broken down by category of spend. This was primarily based on the Applicant’s SCDS (Ossian Offshore Wind Farm Limited (OWFL), 2023), which sets out the expected spending associated with Ossian, as well as the share of contracts secured in different study areas (including Scotland and the rest of the UK (rUK)).
- This was then adjusted to take account of a detailed expenditure breakdown, and also:
- a generating capacity of up to 3.6 GW (for each of the four options listed in section 1, and as per the parameters of PDE for the Array (see volume 1, chapter 3) rather than 2.6 GW as provided in the SCDS; and
- the location of the Proposed onshore grid connection, on the Lincolnshire coast.
- This approach has been implemented in the following sections. Section 3.2 discusses the original expenditure set out in the Applicant’s SCDS which was used as the starting point for establishing the economic impact associated with Ossian. In section 3.3, the adjustments made to the original expenditure due to changes to Ossian since publication of the SCDS (as detailed in paragraph 20) are discussed. Section 3.4 then presents the expenditure by PDE Option for Ossian and the Array based upon the adjustments made to the original SCDS expenditure.
3.2. SCDS
3.2. SCDS
- The starting point for establishing the economic impact was the expenditure that is expected to be associated with Ossian. The Applicant’s SCDS provides current estimates of the share of expenditure in Scotland, rUK, the EU, and elsewhere across two scenarios (commitment and ambition) associated with the following four categories of expenditure:
- development;
- manufacturing and fabrication;
- installation; and
- operation and maintenance (the first six years).
- The SCDS was submitted in July 2021 and updated in April 2023, although the update retained the same level of SCDS commitments and ambitions, based on the initial 2,610 MW installed capacity. It is anticipated that the next update of the SCDS will be published in 2026.
- In the commitment scenario presented in the SCDS, it was expected that the total expenditure during the development and construction (including manufacturing and fabrication and installation) phase would be £7.1 billion, including £3.0 billion in Scotland and £0.7 billion in rUK (at time of SCDS publication in 2021; Ossian OWFL, 2021). This includes:
- £362 million on development, such as studies, surveys, analysis and resources required to obtain planning consent;
- £5.2 billion on manufacturing and fabrication, including wind turbine engines, blades and towers, floating foundations, mooring and anchoring, inter-array and interconnector cables, onshore and offshore substation fabrication and the operation and maintenance base construction; and
- £1.5 billion on foundation and mooring installation, onshore wind turbine and foundation assembly works, onshore substation construction and installation and export cable route works.
- In addition, there is expected to be operation and maintenance spend of £196 million per year (on average over first six years of operation and maintenance), including £136 million per year in Scotland. This is expected to include operating and maintaining the offshore wind turbines and infrastructure associated with Ossian, inspections, rents and transmission charges. Ossian’s lifetime is expected to be 35 years.
Table 3.1: SCDS Commitment Scenario based on 2,610 MW
| Scotland | rUK | Total |
|---|---|---|---|
Development | £257 m | £93 m | £362 m |
Manufacturing and fabrication | £1,774 m | £537 m | £5,167 m |
Installation | £986 m | £57 m | £1,545 m |
Development and construction | £3,017 m | £687 m | £7,074 m |
Annual operation and maintenance | £136 m | £32 m | £196 m |
- Each of the categories of spend was then split into sub-categories (see Table 4.1) based on the technical expert’s offshore wind economic model (described in section 2.4), which incorporates a detailed breakdown of cost categories, based on industry data, including BVG Associates Guide to a Floating Offshore Wind Farm (BVG Associates, 2023).
3.3. Ossian Developments
3.3. Ossian Developments
- This section considers how developments since the publication of the SCDS have affected the expenditure associated with Ossian as a whole.
3.3.1. Generating Capacity
3.3.1. Generating Capacity
- Each of the four PDE Options are described below:
- Option 1: up to 265 wind turbines;
- Option 2: up to 218 wind turbines;
- Option 3: up to 186 wind turbines; and
- Option 4: up to 130 wind turbines.
- Each PDE Option has an expected generating capacity of up to 3.6 GW, compared with 2.6 GW as presented in the SCDS. It was assumed that under PDE Option 1 the per MW costs and share of contracts by socio-economic study area would be comparable to the SCDS.
- The effect of incorporating fewer, larger wind turbines than PDE Option 1, as PDE Options 2 to 4 do, are considered below.
Construction
- It is anticipated that fewer, larger capacity wind turbines would reduce some types of construction expenditure, particularly for the inter-array cable supply and installation, anchoring solutions, and the installation of floating foundations and wind turbines. Scottish and rUK-based companies are expected to secure contracts in a number of these categories, and therefore this will result in a comparatively lower share of spend being secured in these in Scotland and the UK, and a lower economic impact than would be the case for a greater number of smaller capacity wind turbines.
- Other areas, such as development, the manufacture of floating foundations and wind turbines, and the manufacture and installation of export cables, Offshore Substation Platforms (OSPs) and the operation and maintenance base are likely to be unaffected by the number and capacity of wind turbines in each of the PDE Options.
Operation and Maintenance
- For operation and maintenance expenditure, core operations are not expected to change, while expenditure on repairs and maintenance (in per MW terms) is expected to decrease due to the lower number of wind turbines. Expenditure associated with rents and transmission charges, which is based on either capacity or output, is expected to remain the same.
3.3.2. Proposed OfFshore Export Cable
3.3.2. Proposed OfFshore Export Cable
- The Proposed offshore export cable(s), which carries electricity to the grid, was originally assumed to connect on the east coast of Scotland. However, the Proposed offshore export cable corridor(s) will connect to an onshore converter station(s) in England, meaning that the Proposed offshore export cable(s) could be significantly longer, resulting in higher cable manufacturing and cable laying costs. It was therefore assumed that the cost would be two times greater than previously anticipated, which is equivalent to around an extra £1.1 billion across manufacturing and fabrication and installation.
- It was assumed that there would continue to be opportunities for cable laying for Scottish and rUK suppliers, although under the SCDS commitment scenario the offshore export cable(s) are expected to be manufactured outside of the UK.
3.3.3. Proposed Onshore Connection
3.3.3. Proposed Onshore Connection
- The Proposed landfall will be located in England, meaning that contracts associated with the Proposed onshore export cable(s) installation and Proposed onshore converter station(s) (collectively referred to as the “Proposed onshore transmission infrastructure”) would not be secured in Scotland as assumed within the SCDS. The total spending associated with these categories is not expected to change as a result of the potential relocation of the landfall.
3.3.4. Transmission Network Use of System
3.3.4. Transmission Network Use of System
- Transmission Network Use of System (TNUoS) charges are one of the main components of operation and maintenance spend associated with an offshore wind farm. Spending associated with TNUoS was estimated and an assumption was made about the share secured in Scotland and rUK.
- Based on the average TNUoS charge paid by offshore wind developers in 2023/24 (Electricity System Operator, 2023) and after excluding the share associated with the capital repayments, it was estimated that the annual operational costs associated with transmission could be £106 million.
- Under the original SCDS it was anticipated that 100% of this spending could be secured in Scotland. However, due to the uncertainty around landfall location as noted in sections 3.3.2 and 3.3.3, it is has been assumed within this technical report and within the socio-economics EIA chapter (volume 2, chapter 18) that this would be rUK spend.
3.4. Expenditure by PDE Option
3.4. Expenditure by PDE Option
- Based on the original expenditure assumptions set out in the SCDS and the adjustments discussed in section 3.3, the expenditure associated with each PDE Option is set out in Table 3.2, Table 3.3, Table 3.4 and Table 3.5. It should be noted that the operation and maintenance expenditure is an average of the first six years, which was included as part of the SCDS commitment scenario.
Table 3.2: PDE Option 1: Scotland, rUK and Total Spending
Up to 265 Wind Turbines | Scotland | rUK | Total |
|---|---|---|---|
Development | £358 m | £94 m | £471 m |
Manufacturing and fabrication | £2,555 m | £749 m | £7,823 m |
Installation | £1,148 m | £222 m | £2,748 m |
Construction | £4,061 m | £1,065 m | £11,042 m |
Annual operation and maintenance | £125 m | £131 m | £276 m |
Table 3.3: PDE Option 2: Scotland, rUK and Total Spending
Up to 218 Wind Turbines | Scotland | rUK | Total |
|---|---|---|---|
Development | £358 m | £94 m | £471 m |
Manufacturing and fabrication | £2,462 m | £728 m | £7,639 m |
Installation | £1,011 m | £222 m | £2,550 m |
Construction | £3,832 m | £1,044 m | £10,660 m |
Annual operation and maintenance | £113 m | £129 m | £259 m |
Table 3.4: PDE Option 3: Scotland, rUK and Total Spending
Up to 186 Wind Turbines | Scotland | rUK | Total |
|---|---|---|---|
Development | £358 m | £94 m | £471 m |
Manufacturing and fabrication | £2,457 m | £715 m | £7,596 m |
Installation | £919 m | £222 m | £2,416 m |
Construction | £3,734 m | £1,032 m | £10,483 m |
Annual operation and maintenance | £104 m | £127 m | £247 m |
Table 3.5: PDE Option 4: Scotland, rUK and Total Spending (£m)
Up to 130 Wind Turbines | Scotland | rUK | Total |
|---|---|---|---|
Development | £358 m | £94 m | £471 m |
Manufacturing and fabrication | £2,475 m | £687 m | £7,522 m |
Installation | £756 m | £222 m | £2,181 m |
Construction | £3,588 m | £1,004 m | £10,174 m |
Annual operation and maintenance | £90 m | £124 m | £227 m |
3.5. Decommissioning
3.5. Decommissioning
- The potential expenditure associated with decommissioning of Ossian and the share that could be secured in Scotland and the UK was not part of the SCDS process. It was assumed by the technical expert as part of the offshore wind economic model that there would be an expenditure of £150,000 per MW associated with decommissioning, based on the BVG Associates Guide to Floating Wind Farm (BVG Associates, 2023). This suggests that total spending would be £542 million.
- Additionally, it was assumed that 30% of this expenditure would be secured in Scotland and the UK and 70% elsewhere in the world (defined as “rWorld”), though there is potential for the Scottish and UK shares to be substantially higher, depending on development of the Scottish and UK economies over the next few decades (BVG Associates, 2021).
4. Economic Impact of PDE Option 1 (Commitment)
4. Economic Impact of PDE Option 1 (Commitment)
4.1. Construction
4.1. Construction
4.1.1. Ossian Impact
4.1.1. Ossian Impact
- Expenditure by socio-economic study area was estimated for Ossian based on the technical expert’s model of costs and the information provided in the SCDS. Therefore, it was assumed that under PDE Option 1, the total construction phase spend in Scotland could be £4.0 billion (37% of total expenditure) and total spend in the UK could be £5.1 billion (46% of total expenditure). The largest expenditure is associated with the manufacture of floating foundations, as shown in Table 4.1.
Table 4.1: PDE Option 1: Ossian Construction Spending by Category, Scotland and the UK
Parameters | Scotland | UK (Inc. Scotland) | Total (Scotland, rUK and rWorld) |
|---|---|---|---|
Wind Turbine | £885 m | £1,331 m | £3,785 m |
Floating Foundation Manufacturing | £1,916 m | £1,916 m | £2,335 m |
Cables Supply | £0 m | £166 m | £1,302 m |
Offshore Cable Installation | £187 m | £262 m | £1,249 m |
Floating Foundations Installation | £443 m | £443 m | £644 m |
OSP | £180 m | £215 m | £505 m |
Development and Consenting Services | £339 m | £433 m | £471 m |
Floating Mooring Systems | £86 m | £171 m | £429 m |
Onshore Substation | £0 m | £129 m | £280 m |
Onshore Cable Installation | £0 m | £34 m | £34 m |
Operation and Maintenance Base | £7 m | £7 m | £7 m |
Total expenditure | £4,043 m | £5,108 m | £11,042 m |
Percentage of total expenditure (%) | 37% | 46% | 100% |
- Applying turnover per employee and turnover/GVA ratios for the relevant sectors, it was estimated that the direct economic impact of Ossian could be £1.6 billion and 23,880 years of employment in Scotland and £2.0 billion GVA and 29,670 years of employment in the UK (Table 4.2).
Table 4.2: PDE Option 1: Ossian Construction Direct Economic Impact, Scotland and the UK
Parameters | Scotland | UK | ||
|---|---|---|---|---|
| GVA | Years of Employment | GVA | Years of Employment |
Wind Turbine | £348 m | 5,170 | £523 m | 7,760 |
Floating Foundation Manufacturing | £756 m | 10,900 | £756 m | 10,900 |
Cables Supply | £0 m | 0 | £61 m | 840 |
Offshore Cable Installation | £48 m | 590 | £67 m | 820 |
Floating Foundations Installation | £157 m | 2,440 | £157 m | 2,440 |
OSP | £74 m | 1,290 | £86 m | 1,450 |
Development and Consenting Services | £185 m | 2,890 | £236 m | 3,690 |
Floating Mooring Systems | £38 m | 580 | £77 m | 1,160 |
Onshore Substation | £0 m | 0 | £41 m | 470 |
Onshore Cable Installation | £0 m | 0 | £11 m | 120 |
Operation and Maintenance Base | £2 m | 30 | £2 m | 30 |
Total | £1,609 m | 23,880 | £2,017 m | 29,670 |
- Applying GVA and employment multipliers it was therefore estimated that the total economic impact could be £2.7 billion GVA and 40,110 years of employment in Scotland, and £5.3 billion GVA and 75,170 years of employment in the UK (Table 4.3) (Table 4.4).
Table 4.3: PDE Option 1: Ossian Construction GVA impact, Scotland and the UK
Parameters | Scotland | UK |
|---|---|---|
Direct GVA | £1,609 m | £2,017 m |
Indirect GVA | £611 m | £1,646 m |
Induced GVA | £498 m | £1,608 m |
Total GVA | £2,718 m | £5,271 m |
Table 4.4: PDE Option 1: Ossian Construction Employment impact, Scotland and the UK
Parameters | Scotland | UK |
|---|---|---|
Direct Years of Employment | 23,880 | 29,670 |
Indirect Years of Employment | 9,710 | 22,610 |
Induced Years of Employment | 6,520 | 22,890 |
Total Years of Employment | 40,110 | 75,170 |
4.1.2. Array Impact
4.1.2. Array Impact
- For the Array it was estimated that the total spend could be £8.5 billion, of which £3.8 billion (44%) could be secured in Scotland and £4.5 billion (53%) could be secured in the UK (Table 4.5).
Table 4.5: PDE Option 1: Array Construction Spending by Category, Scotland and the UK
Parameters | Scotland | UK (Inc. Scotland) | Total (Scotland, rUK and rWorld) |
|---|---|---|---|
Wind Turbine | £885 m | £1,331 m | £3,785 m |
Floating Foundation Manufacturing | £1,916 m | £1,916 m | £2,335 m |
Offshore Cable Installation | £47 m | £66 m | £312 m |
Cables Supply | £0 m | £106 m | £212 m |
OSP | £180 m | £215 m | £505 m |
Development and Consenting Services | £214 m | £273 m | £297 m |
Floating Mooring Systems | £86 m | £171 m | £429 m |
Floating Foundations Installation | £443 m | £443 m | £644 m |
Operation and Maintenance Base | £7 m | £7 m | £7 m |
Total | £3,777 m | £4,528 m | £8,527 m |
Percentage of total expenditure (%) | 44% | 53% | 100% |
- Applying turnover per employee and turnover/GVA ratios for the relevant sectors it was estimated that the direct economic impact of the Array could be £1.5 billion and 22,370 years of employment in Scotland and £1.8 billion GVA and 26,790 years of employment in the UK (Table 4.6).
Table 4.6: PDE Option 1: Array Construction Direct Economic Impact, Scotland and the UK
Parameters | Scotland | UK | ||
|---|---|---|---|---|
| GVA | Years of Employment | GVA | Years of Employment |
Wind Turbine | £348 m | 5,170 | £523 m | 7,760 |
Floating Foundation Manufacturing | £756 m | 10,900 | £756 m | 10,900 |
Offshore Cable Installation | £12 m | 150 | £17 m | 200 |
Cables Supply | £0 m | 0 | £39 m | 520 |
OSP | £74 m | 1,290 | £86 m | 1,450 |
Development and Consenting Services | £116 m | 1,820 | £149 m | 2,320 |
Floating Mooring Systems | £38 m | 580 | £77 m | 1,160 |
Floating Foundations Installation | £157 m | 2,440 | £157 m | 2,440 |
Operation and Maintenance Base | £2 m | 30 | £2 m | 30 |
Total | £1,505 m | 22,370 | £1,806 m | 26,790 |
- Applying GVA and employment multipliers it was therefore estimated that the Array’s economic impact could be £2.5 billion GVA and 37,690 years of employment in Scotland, and £4.7 billion GVA and 67,500 years of employment in the UK (Table 4.7; Table 4.8).
Table 4.7: PDE Option 1: Array Construction Total GVA impact, Scotland and the UK
Parameters | Scotland | UK |
|---|---|---|
Direct GVA | £1,505 m | £1,806 m |
Indirect GVA | £576 m | £1,458 m |
Induced GVA | £468 m | £1,440 m |
Total GVA | £2,549 m | £4,704 m |
Table 4.8: PDE Option 1: Array Construction Total Employment impact, Scotland and the UK
Parameters | Scotland | UK |
|---|---|---|
Direct Years of Employment | 22,370 | 26,790 |
Indirect Years of Employment | 9,180 | 20,120 |
Induced Years of Employment | 6,140 | 20,590 |
Total Years of Employment | 37,690 | 67,500 |
- The spend at the primary construction port(s) is expected to be around £305 million, of which the largest contract is expected to be associated with marshalling harbour (£229 million). This would require a significant workforce, with an estimated peak direct employment of 480 jobs (Table 4.9).
Table 4.9: PDE Option 1: Array Construction Port Impact by Category
Parameters | Total Investment | Port Spend | Employment | Peak Employment |
|---|---|---|---|---|
Wind Turbine Assembly | £156 m | £22 m | 110 | 20 |
Marshalling Harbour | £229 m | £229 m | 1,860 | 410 |
Offshore Logistics | £13 m | £13 m | 120 | 30 |
Anchor Installation | £201 m | £40 m | 90 | 20 |
Total | £599 m | £305 m | 2,180 | 480 |
4.2. Operation and Maintenance
4.2. Operation and Maintenance
4.2.1. Ossian Impact
4.2.1. Ossian Impact
- Based on the estimated annual expenditure for Ossian as a whole, the technical expert’s model of costs and the information provided in the SCDS it was assumed that under PDE Option 1 the annual operation and maintenance expenditure could be £276 million, of which £87 million (31%) could be secured in Scotland and £237 million in the UK (86%) as shown in Table 4.10.
Table 4.10: PDE Option 1: Ossian Operation and Maintenance Spending by Category, Scotland and the UK
Parameters | Scotland | UK (Inc. Scotland) | Total (Scotland, rUK and rWorld) |
|---|---|---|---|
Operational Training | £4 m | £4 m | £5 m |
Operational Onshore Logistics | £2 m | £2 m | £3 m |
Operational Offshore Logistics | £9 m | £13 m | £13 m |
Health and Safety Inspections | £1 m | £1 m | £1 m |
Seabed Lease | £17 m | £17 m | £17 m |
TNUoS Charges | £0 m | £106 m | £106 m |
Operational Insurance | £0 m | £13 m | £13 m |
Operations Centre and Support Staff | £14 m | £18 m | £18 m |
Wind Turbine Maintenance and Service | £23 m | £33 m | £67 m |
Balance of Plant Maintenance and Service | £14 m | £24 m | £28 m |
Maintenance Vessels | £2 m | £5 m | £5 m |
Maintenance Port | £1 m | £1 m | £1 m |
Total | £87 m | £237 m | £276 m |
Percentage of total expenditure (%) | 31% | 86% | 100% |
- Applying turnover per employee and turnover/GVA ratios for the relevant sectors it was estimated that Ossian’s direct annual economic impact could be £33 million GVA and 410 jobs in Scotland, and £71 million GVA and 680 jobs in the UK (Table 4.11).
Table 4.11: PDE Option 1: Ossian Operation and Maintenance Direct Economic Impact, Scotland and the UK
Parameters | Scotland | UK | ||
|---|---|---|---|---|
| GVA | Jobs | GVA | Jobs |
Operational Training | £2 m | 40 | £2 m | 40 |
Operational Onshore Logistics | £1 m | 10 | £1 m | 10 |
Operational Offshore Logistics | £2 m | 20 | £3 m | 30 |
Health and Safety Inspections | <£1 m | 0 | <£1 m | 0 |
Seabed Lease | £10 m | 100 | £10 m | 100 |
TNUoS Charges | £0 m | 0 | £22 m | 110 |
Operational Insurance | £0 m | 0 | £5 m | 20 |
Operations Centre and Support Staff | £3 m | 30 | £4 m | 40 |
Wind Turbine Maintenance and Service | £7 m | 80 | £10 m | 120 |
Balance of Plant Maintenance and Service | £6 m | 100 | £10 m | 160 |
Maintenance Vessels | £1 m | 20 | £3 m | 40 |
Maintenance Port | <£1 m | 10 | <£1 m | 10 |
Total | £33 m | 410 | £71 m | 680 |
- Applying GVA and employment multipliers it was therefore estimated that Ossian’s annual economic impact could be £55 million GVA and 660 jobs in Scotland, and £212 million GVA and 1,910 jobs in the UK (Table 4.12) (Table 4.13).
Table 4.12: PDE Option 1: Ossian Operation and Maintenance GVA impact, Scotland and the UK
Parameters | Scotland | UK |
|---|---|---|
Direct GVA | £33 m | £71 m |
Indirect GVA | £13 m | £91 m |
Induced GVA | £10 m | £51 m |
Total GVA | £55 m | £212 m |
Table 4.13: PDE Option 1: Ossian Operation and Maintenance Employment impact, Scotland and the UK
Parameters | Scotland | UK |
|---|---|---|
Direct Employment | 410 | 680 |
Indirect Employment | 180 | 900 |
Induced Employment | 80 | 330 |
Total Employment | 660 | 1,910 |
4.2.2. Array Impact
4.2.2. Array Impact
- For the Array it was estimated that the annual spend could be £276 million, of which £84 million (30%) could be secured in Scotland and £232 million (84%) could be secured in the UK (Table 4.14).
Table 4.14: PDE Option 1: Array Operation and Maintenance Spending by Category, Scotland and the UK
Parameters | Scotland | UK (Inc. Scotland) | Total (Scotland, rUK and rWorld) |
|---|---|---|---|
Operational Training | £4 m | £4 m | £5 m |
Operational Onshore Logistics | £2 m | £2 m | £3 m |
Operational Offshore Logistics | £8 m | £12 m | £13 m |
Health and Safety Inspections | £1 m | £1 m | £1 m |
Seabed Lease | £17 m | £17 m | £17 m |
TNUoS Charges | £0 m | £106 m | £106 m |
Operational Insurance | £0 m | £12 m | £13 m |
Operations Centre and Support Staff | £12 m | £16 m | £18 m |
Wind Turbine Maintenance and Service | £23 m | £33 m | £67 m |
Balance of Plant Maintenance and Service | £14 m | £24 m | £28 m |
Maintenance Vessels | £2 m | £4 m | £5 m |
Maintenance Port | £1 m | £1 m | £1 m |
Total | £84 m | £232 m | £276 m |
Percentage of total expenditure (%) | 30% | 84% | 100% |
- Applying turnover per employee and turnover/GVA ratios for the relevant sectors it was estimated that the Array’s direct annual economic impact could be £32 million GVA and 400 jobs in Scotland, and £69 million GVA and 670 jobs in the UK (Table 4.15).
Table 4.15: PDE Option 4: Array Operation and Maintenance Direct Economic Impact, Scotland and the UK
Parameters | Scotland | UK | ||
|---|---|---|---|---|
| GVA | Jobs | GVA | Jobs |
Operational Training | £2 m | 40 | £2 m | 40 |
Operational Onshore Logistics | £1 m | 10 | £1 m | 10 |
Operational Offshore Logistics | £2 m | 20 | £3 m | 30 |
Health and Safety Inspections | <£1 m | 0 | <£1 m | 0 |
Seabed Lease | £10 m | 100 | £10 m | 100 |
TNUoS Charges | £0 m | 0 | £22 m | 110 |
Operational Insurance | £0 m | 0 | £4 m | 20 |
Operations Centre and Support Staff | £3 m | 30 | £3 m | 40 |
Wind Turbine Maintenance and Service | £7 m | 80 | £10 m | 120 |
Balance of Plant Maintenance and Service | £6 m | 100 | £10 m | 160 |
Maintenance Vessels | £1 m | 20 | £2 m | 30 |
Maintenance Port | <£1 m | 10 | <£1 m | 10 |
Total | £32 m | 400 | £69 m | 670 |
- Applying GVA and employment multipliers it was therefore estimated that the Array’s annual economic impact could be £54 million GVA and 650 jobs in Scotland, and £208 million GVA and 1,880 jobs in the UK (Table 4.16) (Table 4.17).
Table 4.16: PDE Option 1: Array Operation and Maintenance GVA impact, Scotland and the UK
Parameters | Scotland | UK |
|---|---|---|
Direct GVA | £32 m | £69 m |
Indirect GVA | £13 m | £90 m |
Induced GVA | £9 m | £49 m |
Total GVA | £54 m | £208 m |
Table 4.17: PDE Option 1: Array Operation and Maintenance Employment impact, Scotland and the UK
Parameters | Scotland | UK |
|---|---|---|
Direct Employment | 400 | 670 |
Indirect Employment | 180 | 890 |
Induced Employment | 70 | 320 |
Total Employment | 650 | 1,880 |
- The spend at the primary operation and maintenance port(s) is expected to be around £28 million, directly employing 100 people (Table 4.18).
Table 4.18: PDE Option 1: Array Operation and Maintenance Port Impact by Category
Parameters | Total Investment | Port Spend | Employment |
|---|---|---|---|
Operational Offshore Logistics | £13 m | £6 m | 20 |
Operations Centre and Support Staff | £18 m | £12 m | 30 |
Wind Turbine Maintenance and Service | £67 m | £7 m | 20 |
Balance of Plant Maintenance and Service | £28 m | £3 m | 20 |
Maintenance Port | £1 m | £1 m | 10 |
Total | £126 m | £28 m | 100 |
4.3. Decommissioning
4.3. Decommissioning
4.3.1. Ossian Impact
4.3.1. Ossian Impact
- For decommissioning, which is expected to take place after the operation and maintenance lifespan of Ossian, it was estimated that the cost could be £542 million, of which £162 million (30%) could be secured in the UK (all of which could be secured in Scotland). It is assumed that the remaining 70% could be secured elsewhere in the world (Table 4.19).
Table 4.19: PDE Option 1: Ossian Decommissioning Spending by Category, Scotland and the UK
Parameters | Scotland | UK (Inc. Scotland) | Total (Scotland, rUK and rWorld) |
|---|---|---|---|
Wind Turbine Decommissioning | £8 m | £8 m | £26 m |
Mooring and Anchoring Decommissioning | £45 m | £45 m | £148 m |
Cable Decommissioning | £81 m | £81 m | £271 m |
OSP Decommissioning | £29 m | £29 m | £96 m |
Total | £162 m | £162 m | £542 m |
Percentage of total expenditure (%) | 30% | 30% | 100% |
- Applying turnover per employee and turnover/GVA ratios for the relevant sectors it was estimated that Ossian’s direct economic impact could be £49 million GVA and 580 years of employment in the UK, all of which could be secured in Scotland (Table 4.20).
Table 4.20: PDE Option 1: Ossian Decommissioning Direct Economic Impact, Scotland and the UK
Parameters | Scotland | UK | ||
|---|---|---|---|---|
| GVA | Jobs | GVA | Jobs |
Wind Turbine Decommissioning | £2 m | 30 | £2 m | 30 |
Mooring and Anchoring Decommissioning | £14 m | 160 | £14 m | 160 |
Cable Decommissioning | £25 m | 290 | £25 m | 290 |
OSP Decommissioning | £9 m | 100 | £9 m | 100 |
Total | £49 m | 580 | £49 m | 580 |
- Applying GVA and employment multipliers it was therefore estimated that Ossian’s economic impact could be £90 million GVA and 1,040 years of employment in Scotland, and £130 million GVA and 1,580 years of employment in the UK (Table 4.21) (Table 4.22).
Table 4.21: PDE Option 1: Ossian Decommissioning GVA impact, Scotland and the UK
Parameters | Scotland | UK |
|---|---|---|
Direct GVA | £49 m | £49 m |
Indirect GVA | £22 m | £44 m |
Induced GVA | £15 m | £37 m |
Total GVA | £90 m | £130 m |
Table 4.22: PDE Option 1: Ossian Decommissioning Employment impact, Scotland and the UK
Parameters | Scotland | UK |
|---|---|---|
Direct Years of Employment | 580 | 580 |
Indirect Years of Employment | 290 | 560 |
Induced Years of Employment | 170 | 450 |
Total Years of Employment | 1,040 | 1,580 |
4.3.2. Array Impact
4.3.2. Array Impact
- The decommissioning spend associated with the Array was estimated to be £174 million, of which £52 million (30%) could be secured in Scotland and the UK (Table 4.23).
Table 4.23: PDE Option 1: Array Decommissioning Spending by Category, Scotland and the UK
Parameters | Scotland | UK (Inc. Scotland) | Total (Scotland, rUK and rWorld) |
|---|---|---|---|
Wind Turbine Decommissioning | £8 m | £8 m | £26 m |
Mooring and Anchoring Decommissioning | £45 m | £45 m | £148 m |
Total | £52 m | £52 m | £174 m |
Total (%) | 30% | 30% | 100% |
- Applying turnover per employee and turnover/GVA ratios for the relevant sectors it was estimated that the Array’s direct economic impact could be £16 million GVA and 190 years of employment in Scotland and the UK (Table 4.24).
Table 4.24: PDE Option 1: Array Decommissioning Direct Economic Impact, Scotland and the UK
Parameters | Scotland | UK | ||
|---|---|---|---|---|
| GVA | Jobs | GVA | Jobs |
Wind Turbine Decommissioning | £2 m | 30 | £2 m | 30 |
Mooring and Anchoring Decommissioning | £14 m | 160 | £14 m | 160 |
Total | £16 m | 190 | £16 m | 190 |
- Applying GVA and employment multipliers it was therefore estimated that the economic impact of decommissioning the Array could be £30 million GVA and 330 years of employment in Scotland, and £40 million GVA and 510 years of employment in the UK (Table 4.25) (Table 4.26).
Table 4.25: PDE Option 1: Array Decommissioning GVA impact, Scotland and the UK
Parameters | Scotland | UK |
|---|---|---|
Direct GVA | £16 m | £16 m |
Indirect GVA | £7 m | £14 m |
Induced GVA | £5 m | £12 m |
Total GVA | £30 m | £40 m |
Table 4.26: PDE Option 1: Array Decommissioning Employment impact, Scotland and the UK
Parameters | Scotland | UK |
|---|---|---|
Direct Years of Employment | 190 | 190 |
Indirect Years of Employment | 90 | 180 |
Induced Years of Employment | 60 | 140 |
Total Years of Employment | 330 | 510 |
5. Economic Impact of PDE Option 2 (Commitment)
5. Economic Impact of PDE Option 2 (Commitment)
5.1. Construction
5.1. Construction
5.1.1. Ossian Impact
5.1.1. Ossian Impact
- Based on the estimated expenditure for Ossian as a whole, the technical expert’s model of costs and the information provided in the SCDS it was assumed that under PDE Option 2 the total construction phase spend in Scotland could be £3.8 billion (36% of total expenditure) and total spend in the UK could be £4.9 billion (46%), as shown in Table 5.1. The largest expenditure is associated with the manufacture of floating foundations.
Table 5.1: PDE Option 2: Ossian Construction Spending by Category, Scotland and the UK
Parameters | Scotland | UK (Inc. Scotland) | Total (Scotland, rUK and rWorld) |
|---|---|---|---|
Wind Turbine | £819 m | £1,260 m | £3,663 m |
Floating Foundation Manufacturing | £1,833 m | £1,833 m | £2,235 m |
Cables Supply | £0 m | £155 m | £1,280 m |
Offshore Cable Installation | £187 m | £262 m | £1,249 m |
Floating Foundations Installation | £366 m | £366 m | £532 m |
OSP | £180 m | £215 m | £505 m |
Development and Consenting Services | £339 m | £433 m | £471 m |
Floating Mooring Systems | £81 m | £162 m | £405 m |
Onshore Substation | £0 m | £129 m | £280 m |
Onshore Cable Installation | £0 m | £34 m | £34 m |
Operation and Maintenance Base | £7 m | £7 m | £7 m |
Total | £3,813 m | £4,857 m | £10,660 m |
Total (%) | 36% | 46% | 100% |
- Applying turnover per employee and turnover/GVA ratios for the relevant sectors it was estimated that the direct economic impact of Ossian could be £1.5 billion and 22,670 years of employment in Scotland and £1.9 billion GVA and 28,350 years of employment in the UK (Table 5.2).
Table 5.2: PDE Option 2: Ossian Construction Direct Economic Impact, Scotland and the UK
Parameters | Scotland | UK | ||
|---|---|---|---|---|
| GVA | Years of Employment | GVA | Years of Employment |
Wind Turbine | £327 m | 4,880 | £500 m | 7,450 |
Floating Foundation Manufacturing | £724 m | 10,430 | £724 m | 10,430 |
Cables Supply | £0 m | 0 | £57 m | 790 |
Offshore Cable Installation | £48 m | 590 | £67 m | 820 |
Floating Foundations Installation | £130 m | 2,020 | £130 m | 2,020 |
OSP | £74 m | 1,290 | £86 m | 1,450 |
Development and Consenting Services | £185 m | 2,890 | £236 m | 3,690 |
Floating Mooring Systems | £36 m | 550 | £73 m | 1,090 |
Onshore Substation | £0 m | 0 | £41 m | 470 |
Onshore Cable Installation | £0 m | 0 | £11 m | 120 |
Operation and Maintenance Base | £2 m | 30 | £2 m | 30 |
Total | £1,526 m | 22,670 | £1,926 m | 28,350 |
- Applying GVA and employment multipliers it was therefore estimated that the total economic impact could be £2.6 billion GVA and 38,030 years of employment in Scotland, and £5.0 billion GVA and 71,780 years of employment in the UK (Table 5.3) (Table 5.4).
Table 5.3: PDE Option 2: Ossian Construction GVA impact, Scotland and the UK
Parameters | Scotland | UK |
|---|---|---|
Direct GVA | £1,526 m | £1,926 m |
Indirect GVA | £577 m | £1,571 m |
Induced GVA | £472 m | £1,537 m |
Total GVA | £2,575 m | £5,034 m |
Table 5.4: PDE Option 2: Ossian Construction Employment impact, Scotland and the UK
Parameters | Scotland | UK |
|---|---|---|
Direct Years of Employment | 22,670 | 28,350 |
Indirect Years of Employment | 9,180 | 21,560 |
Induced Years of Employment | 6,180 | 21,870 |
Total Years of Employment | 38,030 | 71,780 |
5.1.2. Array Impact
5.1.2. Array Impact
- For the Array it was estimated that the total spend could be £8.1 billion, of which £3.5 billion (44%) could be secured in Scotland and £4.3 billion (53%) could be secured in the UK (Table 5.5).
Table 5.5: PDE Option 2: Array Construction Spending by Category, Scotland and the UK
Parameters | Scotland | UK (Inc. Scotland) | Total (Scotland, rUK and rWorld) |
|---|---|---|---|
Wind Turbine | £819 m | £1,260 m | £3,663 m |
Floating Foundation Manufacturing | £1,833 m | £1,833 m | £2,235 m |
Offshore Cable Installation | £47 m | £66 m | £312 m |
Cables Supply | £0 m | £95 m | £190 m |
OSP | £180 m | £215 m | £505 m |
Development and Consenting Services | £214 m | £273 m | £297 m |
Floating Mooring Systems | £81 m | £162 m | £405 m |
Floating Foundations Installation | £366 m | £366 m | £532 m |
Operation and Maintenance Base | £7 m | £7 m | £7 m |
Total | £3,547 m | £4,278 m | £8,145 m |
Total (%) | 44% | 53% | 100% |
- Applying turnover per employee and turnover/GVA ratios for the relevant sectors it was estimated that the direct economic impact of the Array could be £1.4 billion and 21,160 years of employment in Scotland and £1.7 billion GVA and 25,460 years of employment in the UK (Table 5.6).
Table 5.6: PDE Option 2: Array Construction Direct Economic Impact, Scotland and the UK
Parameters | Scotland | UK | ||
|---|---|---|---|---|
| GVA | Years of Employment | GVA | Years of Employment |
Wind Turbine | £327 m | 4,880 | £500 m | 7,450 |
Floating Foundation Manufacturing | £724 m | 10,430 | £724 m | 10,430 |
Offshore Cable Installation | £12 m | 150 | £17 m | 200 |
Cables Supply | £0 m | 0 | £35 m | 470 |
OSP | £74 m | 1,290 | £86 m | 1,450 |
Development and Consenting Services | £116 m | 1,820 | £149 m | 2,320 |
Floating Mooring Systems | £36 m | 550 | £73 m | 1,090 |
Floating Foundations Installation | £130 m | 2,020 | £130 m | 2,020 |
Operation and Maintenance Base | £2 m | 30 | £2 m | 30 |
Total | £1,422 m | 21,160 | £1,715 m | 25,460 |
- Applying GVA and employment multipliers it was therefore estimated that the Array’s economic impact could be £2.4 billion GVA and 35,600 years of employment in Scotland, and £4.5 billion GVA and 64,110 years of employment in the UK (Table 5.7; Table 5.8).
Table 5.7: PDE Option 2: Array Construction Total GVA impact, Scotland and the UK
Parameters | Scotland | UK |
|---|---|---|
Direct GVA | £1,422 m | £1,715 m |
Indirect GVA | £543 m | £1,383 m |
Induced GVA | £442 m | £1,369 m |
Total GVA | £2,406 m | £4,466 m |
Table 5.8: PDE Option 2: Array Construction Total Employment impact, Scotland and the UK
Parameters | Scotland | UK |
|---|---|---|
Direct Years of Employment | 21,160 | 25,460 |
Indirect Years of Employment | 8,650 | 19,070 |
Induced Years of Employment | 5,790 | 19,580 |
Total Years of Employment | 35,600 | 64,110 |
- The spend at the primary construction port(s) is expected to be around £252 million, of which the largest contract is expected to be associated with marshalling harbour (£189 million). This would require a significant workforce, with an estimated peak direct employment of 400 jobs (Table 5.9).
Table 5.9: PDE Option 2: Array Construction Port Impact by Category
Parameters | Total Investment | Port Spend | Employment | Peak Employment |
|---|---|---|---|---|
Wind Turbine Assembly | £135 m | £19 m | 90 | 20 |
Marshalling Harbour | £189 m | £189 m | 1,530 | 340 |
Offshore Logistics | £11 m | £11 m | 100 | 20 |
Anchor Installation | £166 m | £33 m | 80 | 20 |
Total | £501 m | £252 m | 1,800 | 400 |
5.2. Operation and Maintenance
5.2. Operation and Maintenance
5.2.1. Ossian Impact
5.2.1. Ossian Impact
- Based on the estimated annual expenditure for Ossian as a whole, the technical expert’s model of costs and the information provided in the SCDS it was assumed that under PDE Option 2 the annual operation and maintenance expenditure could be £259 million, of which £80 million (31%) could be secured in Scotland and £226 million in the UK (87%). This is shown in Table 5.10.
Table 5.10: PDE Option 2: Ossian Operation and Maintenance Spending by Category, Scotland and the UK
Parameters | Scotland | UK (Inc. Scotland) | Total (Scotland, rUK and rWorld) |
|---|---|---|---|
Operational Training | £4 m | £4 m | £5 m |
Operational Onshore Logistics | £2 m | £2 m | £3 m |
Operational Offshore Logistics | £9 m | £13 m | £13 m |
Health and Safety Inspections | £1 m | £1 m | £1 m |
Seabed Lease | £17 m | £17 m | £17 m |
TNUoS Charges | £0 m | £106 m | £106 m |
Operational Insurance | £0 m | £12 m | £12 m |
Operations Centre and Support Staff | £14 m | £18 m | £18 m |
Wind Turbine Maintenance and Service | £19 m | £27 m | £55 m |
Balance of Plant Maintenance and Service | £12 m | £20 m | £24 m |
Maintenance Vessels | £2 m | £4 m | £4 m |
Maintenance Port | £1 m | £1 m | £1 m |
Total | £80 m | £226 m | £259 m |
Total (%) | 31% | 87% | 100% |
- Applying turnover per employee and turnover/GVA ratios for the relevant sectors it was estimated that Ossian’s direct annual economic impact could be £31 million GVA and 370 jobs in Scotland, and £67 million GVA and 630 years of employment in the UK (Table 5.11).
Table 5.11: PDE Option 2: Ossian Operation and Maintenance Direct Economic Impact, Scotland and the UK
Parameters | Scotland | UK | ||
|---|---|---|---|---|
| GVA | Jobs | GVA | Jobs |
Operational Training | £2 m | 40 | £2 m | 40 |
Operational Onshore Logistics | £1 m | 10 | £1 m | 10 |
Operational Offshore Logistics | £2 m | 20 | £3 m | 30 |
Health and Safety Inspections | <£1 m | 0 | <£1 m | 0 |
Seabed Lease | £10 m | 100 | £10 m | 100 |
TNUoS Charges | £0 m | 0 | £22 m | 110 |
Operational Insurance | £0 m | 0 | £5 m | 20 |
Operations Centre and Support Staff | £3 m | 30 | £4 m | 40 |
Wind Turbine Maintenance and Service | £6 m | 70 | £8 m | 100 |
Balance of Plant Maintenance and Service | £5 m | 80 | £9 m | 140 |
Maintenance Vessels | £1 m | 20 | £2 m | 30 |
Maintenance Port | <£1 m | 10 | <£1 m | 10 |
Total | £31 m | 370 | £67 m | 630 |
- Applying GVA and employment multipliers it was therefore estimated that Ossian’s annual economic impact could be £51 million GVA and 610 jobs in Scotland, and £202 million GVA and 1,770 years of employment in the UK (Table 5.12; Table 5.13).
Table 5.12: PDE Option 2: Ossian Operation and Maintenance GVA impact, Scotland and the UK
Parameters | Scotland | UK |
|---|---|---|
Direct GVA | £31 m | £67 m |
Indirect GVA | £12 m | £87 m |
Induced GVA | £9 m | £48 m |
Total GVA | £51 m | £202 m |
Table 5.13: PDE Option 2: Ossian Operation and Maintenance Employment impact, Scotland and the UK
Parameters | Scotland | UK |
|---|---|---|
Direct Employment | 370 | 630 |
Indirect Employment | 170 | 850 |
Induced Employment | 70 | 290 |
Total Employment | 610 | 1,770 |
5.2.2. Array Impact
5.2.2. Array Impact
- For the Array it was estimated that the annual spend could be £259 million, of which £78 million (30%) could be secured in Scotland and £221 million (86%) could be secured in the UK (Table 5.14).
Table 5.14: PDE Option 2: Array Operation and Maintenance Spending by Category, Scotland and the UK
Parameters | Scotland | UK (Inc. Scotland) | Total (Scotland, rUK and rWorld) |
|---|---|---|---|
Operational Training | £4 m | £4 m | £5 m |
Operational Onshore Logistics | £2 m | £2 m | £3 m |
Operational Offshore Logistics | £8 m | £12 m | £13 m |
Health and Safety Inspections | £1 m | £1 m | £1 m |
Seabed Lease | £17 m | £17 m | £17 m |
TNUoS Charges | £0 m | £106 m | £106 m |
Operational Insurance | £0 m | £11 m | £12 m |
Operations Centre and Support Staff | £12 m | £16 m | £18 m |
Wind Turbine Maintenance and Service | £19 m | £27 m | £55 m |
Balance of Plant Maintenance and Service | £12 m | £20 m | £24 m |
Maintenance Vessels | £2 m | £4 m | £4 m |
Maintenance Port | £1 m | £1 m | £1 m |
Total | £78 m | £221 m | £259 m |
Total (%) | 30% | 86% | 100% |
- Applying turnover per employee and turnover/GVA ratios for the relevant sectors it was estimated that the Array’s direct annual economic impact could be £30 million GVA and 370 jobs in Scotland, and £65 million GVA and 620 years of employment in the UK (Table 5.15).
Table 5.15: PDE Option 2: Array Operation and Maintenance Direct Economic Impact, Scotland and the UK
Parameters | Scotland | UK | ||
|---|---|---|---|---|
| GVA | Jobs | GVA | Jobs |
Operational Training | £2 m | 40 | £2 m | 40 |
Operational Onshore Logistics | £1 m | 10 | £1 m | 10 |
Operational Offshore Logistics | £2 m | 20 | £3 m | 30 |
Health and Safety Inspections | <£1 m | 0 | <£1 m | 0 |
Seabed Lease | £10 m | 100 | £10 m | 100 |
TNUoS Charges | £0 m | 0 | £22 m | 110 |
Operational Insurance | £0 m | 0 | £4 m | 20 |
Operations Centre and Support Staff | £3 m | 30 | £3 m | 40 |
Wind Turbine Maintenance and Service | £6 m | 70 | £8 m | 100 |
Balance of Plant Maintenance and Service | £5 m | 80 | £9 m | 140 |
Maintenance Vessels | £1 m | 10 | £2 m | 30 |
Maintenance Port | <£1 m | 10 | <£1 m | 10 |
Total | £30 m | 370 | £65 m | 620 |
- Applying GVA and employment multipliers it was therefore estimated that the Array’s annual economic impact could be £50 million GVA and 590 jobs in Scotland, and £198 million GVA and 1,740 years of employment in the UK (Table 5.16; Table 5.17).
Table 5.16: PDE Option 2: Array Operation and Maintenance GVA impact, Scotland and the UK
Parameters | Scotland | UK |
|---|---|---|
Direct GVA | £30 m | £65 m |
Indirect GVA | £12 m | £86 m |
Induced GVA | £9 m | £46 m |
Total GVA | £50 m | £198 m |
Table 5.17: PDE Option 2: Array Operation and Maintenance Employment impact, Scotland and the UK
Parameters | Scotland | UK |
|---|---|---|
Direct Employment | 370 | 620 |
Indirect Employment | 160 | 840 |
Induced Employment | 70 | 280 |
Total Employment | 590 | 1,740 |
- The spend at the primary operation and maintenance port(s) is expected to be around £27 million, directly employing 100 people (Table 5.18).
Table 5.18: PDE Option 2: Ossian Operation and Maintenance Port Impact by Category
Parameters | Total Investment | Port Spend | Employment |
|---|---|---|---|
Operational Offshore Logistics | £13 m | £6 m | 20 |
Operations Centre and Support Staff | £18 m | £12 m | 30 |
Wind Turbine Maintenance and Service | £55 m | £5 m | 20 |
Balance of Plant Maintenance and Service | £24 m | £2 m | 20 |
Maintenance Port | £1 m | £1 m | 10 |
Total | £111 m | £27 m | 100 |
5.3. Decommissioning
5.3. Decommissioning
5.3.1. Ossian Impact
5.3.1. Ossian Impact
- For decommissioning, which is expected to take place after the operation and maintenance lifespan of Ossian, it was estimated that the cost could be £542 million, of which £162 million (30%) could be secured in the UK (all of which could be secured in Scotland). It is assumed that the remaining 70% could be secured elsewhere in the world (Table 5.19).
Table 5.19: PDE Option 2: Ossian Decommissioning Spending by Category, Scotland and the UK
Parameters | Scotland | UK (Inc. Scotland) | Total (Scotland, rUK and rWorld) |
|---|---|---|---|
Wind Turbine Decommissioning | £8 m | £8 m | £26 m |
Mooring and Anchoring Decommissioning | £45 m | £45 m | £148 m |
Cable Decommissioning | £81 m | £81 m | £271 m |
OSP Decommissioning | £29 m | £29 m | £96 m |
Total | £162 m | £162 m | £542 m |
Total (%) | 30% | 30% | 100% |
- Applying turnover per employee and turnover/GVA ratios for the relevant sectors it was estimated that Ossian’s direct economic impact could be £49 million GVA and 580 years of employment in the UK, all of which could be secured in Scotland (Table 5.20).
Table 5.20: PDE Option 2: Ossian Decommissioning Direct Economic Impact, Scotland and the UK
Parameters | Scotland | UK | ||
|---|---|---|---|---|
| GVA | Jobs | GVA | Jobs |
Wind Turbine Decommissioning | £2 m | 30 | £2 m | 30 |
Mooring and Anchoring Decommissioning | £14 m | 160 | £14 m | 160 |
Cable Decommissioning | £25 m | 290 | £25 m | 290 |
OSP Decommissioning | £9 m | 100 | £9 m | 100 |
Total | £49 m | 580 | £49 m | 580 |
- Applying GVA and employment multipliers it was therefore estimated that Ossian’s economic impact could be £90 million GVA and 1,040 years of employment in Scotland, and £130 million GVA and 1,580 years of employment in the UK (Table 5.21; Table 5.22).
Table 5.21: PDE Option 2: Ossian Decommissioning GVA impact, Scotland and the UK
Parameters | Scotland | UK |
|---|---|---|
Direct GVA | £49 m | £49 m |
Indirect GVA | £22 m | £44 m |
Induced GVA | £15 m | £37 m |
Total GVA | £90 m | £130 m |
Table 5.22: PDE Option 2: Ossian Decommissioning Employment impact, Scotland and the UK
Parameters | Scotland | UK |
|---|---|---|
Direct Years of Employment | 580 | 580 |
Indirect Years of Employment | 290 | 560 |
Induced Years of Employment | 170 | 450 |
Total Years of Employment | 1,040 | 1,580 |
5.3.2. Array Impact
5.3.2. Array Impact
- The decommissioning spend associated with the Array was estimated to be £174 million, of which £52 million (30%) could be secured in Scotland and the UK (Table 5.23).
Table 5.23: PDE Option 2: Array Decommissioning Spending by Category, Scotland and the UK
Parameters | Scotland | UK (Inc. Scotland) | Total (Scotland, rUK and rWorld) |
|---|---|---|---|
Wind Turbine Decommissioning | £8 m | £8 m | £26 m |
Mooring and Anchoring Decommissioning | £45 m | £45 m | £148 m |
Total | £52 m | £52 m | £174 m |
Total (%) | 30% | 30% | 100% |
- Applying turnover per employee and turnover/GVA ratios for the relevant sectors it was estimated that the Array’s direct economic impact could be £16 million GVA and 190 years of employment in Scotland and the UK (Table 5.24).
Table 5.24: PDE Option 2: Array Decommissioning Direct Economic Impact, Scotland and the UK
Parameters | Scotland | UK | ||
|---|---|---|---|---|
| GVA | Jobs | GVA | Jobs |
Wind Turbine Decommissioning | £2 m | 30 | £2 m | 30 |
Mooring and Anchoring Decommissioning | £14 m | 160 | £14 m | 160 |
Total | £16 m | 190 | £16 m | 190 |
- Applying GVA and employment multipliers it was therefore estimated that the economic impact of decommissioning the Array could be £30 million GVA and 330 years of employment in Scotland, and £40 million GVA and 510 years of employment in the UK (Table 5.25) (Table 5.26).
Table 5.25: PDE Option 2: Array Decommissioning GVA impact, Scotland and the UK
Parameters | Scotland | UK |
|---|---|---|
Direct GVA | £16 m | £16 m |
Indirect GVA | £7 m | £14 m |
Induced GVA | £5 m | £12 m |
Total GVA | £30 m | £40 m |
Table 5.26: PDE Option 2: Array Decommissioning Employment impact, Scotland and the UK
Parameters | Scotland | UK |
|---|---|---|
Direct Years of Employment | 190 | 190 |
Indirect Years of Employment | 90 | 180 |
Induced Years of Employment | 60 | 140 |
Total Years of Employment | 330 | 510 |
6. Economic Impact of PDE Option 3 (Commitment)
6. Economic Impact of PDE Option 3 (Commitment)
6.1. Construction
6.1. Construction
6.1.1. Ossian Impact
6.1.1. Ossian Impact
- Based on the estimated expenditure for Ossian as a whole, the technical expert’s model of costs and the information provided in the SCDS it was assumed that under PDE Option 3 the construction phase spend in Scotland could be £3.7 billion (35% of total expenditure) and in the UK it could be £4.7 billion (45%), which is shown in Table 6.1. The largest expenditure is associated with the manufacture of floating foundations.
Table 6.1: PDE Option 3: Ossian Construction Spending by Category, Scotland and the UK
Parameters | Scotland | UK (Inc. Scotland) | Total (Scotland, rUK and rWorld) |
|---|---|---|---|
Wind Turbine | £777 m | £1,217 m | £3,593 m |
Floating Foundation Manufacturing | £1,833 m | £1,833 m | £2,234 m |
Cables Supply | £0 m | £147 m | £1,265 m |
Offshore Cable Installation | £187 m | £262 m | £1,249 m |
Floating Foundations Installation | £180 m | £215 m | £505 m |
OSP | £339 m | £433 m | £471 m |
Development and Consenting Services | £313 m | £313 m | £455 m |
Floating Mooring Systems | £78 m | £156 m | £390 m |
Onshore Substation | £0 m | £129 m | £280 m |
Onshore Cable Installation | £0 m | £34 m | £34 m |
Operation and Maintenance Base | £7 m | £7 m | £7 m |
Total | £3,715 m | £4,747 m | £10,483 m |
Total (%) | 35% | 45% | 100% |
- Applying turnover per employee and turnover/GVA ratios for the relevant sectors it was estimated that the direct economic of the Array could be £1.5 billion and 22,180 years of employment in Scotland and £1.9 billion GVA and 27,790 years of employment in the UK (Table 6.2).
Table 6.2: PDE Option 3: Ossian Construction Direct Economic Impact, Scotland and the UK
Parameters | Scotland | UK | ||
|---|---|---|---|---|
| GVA | Years of Employment | GVA | Years of Employment |
Wind Turbine | £314 m | 4,710 | £486 m | 7,260 |
Floating Foundation Manufacturing | £723 m | 10,430 | £723 m | 10,430 |
Cables Supply | £0 m | 0 | £54 m | 750 |
Offshore Cable Installation | £48 m | 590 | £67 m | 820 |
Floating Foundations Installation | £74 m | 1,290 | £86 m | 1,450 |
OSP | £185 m | 2,890 | £236 m | 3,690 |
Development and Consenting Services | £111 m | 1,730 | £111 m | 1,730 |
Floating Mooring Systems | £35 m | 530 | £70 m | 1,050 |
Onshore Substation | £0 m | 0 | £41 m | 470 |
Onshore Cable Installation | £0 m | 0 | £11 m | 120 |
Operation and Maintenance Base | £2 m | 30 | £2 m | 30 |
Total | £1,493 m | 22,180 | £1,887 m | 27,790 |
- Applying GVA and employment multipliers it was therefore estimated that the total economic impact could be £2.5 billion GVA and 37,170 years of employment in Scotland, and £4.9 billion GVA and 70,310 years of employment in the UK (Table 6.3) (Table 6.4).
Table 6.3: PDE Option 3: Ossian Construction GVA impact, Scotland and the UK
Parameters | Scotland | UK |
|---|---|---|
Direct GVA | £1,493 m | £1,887 m |
Indirect GVA | £562 m | £1,537 m |
Induced GVA | £462 m | £1,507 m |
Total GVA | £2,517 m | £4,932 m |
Table 6.4: PDE Option 3: Ossian Construction Employment impact, Scotland and the UK
Parameters | Scotland | UK |
|---|---|---|
Direct Years of Employment | 22,180 | 27,790 |
Indirect Years of Employment | 8,950 | 21,080 |
Induced Years of Employment | 6,040 | 21,440 |
Total Years of Employment | 37,170 | 70,310 |
6.1.2. Array Impact
6.1.2. Array Impact
- For the Array it was estimated that the total spend could be £8.0 billion, of which £3.4 billion (43%) could be secured in Scotland and £4.2 billion (52%) could be secured in the UK (Table 6.5).
Table 6.5: PDE Option 3: Array Construction Spending by Category, Scotland and the UK
Parameters | Scotland | UK (Inc. Scotland) | Total (Scotland, rUK and rWorld) |
|---|---|---|---|
Wind Turbine | £777 m | £1,217 m | £3,593 m |
Floating Foundation Manufacturing | £1,833 m | £1,833 m | £2,234 m |
Offshore Cable Installation | £47 m | £66 m | £312 m |
Cables Supply | £0 m | £87 m | £175 m |
OSP | £180 m | £215 m | £505 m |
Development and Consenting Services | £214 m | £273 m | £297 m |
Floating Mooring Systems | £78 m | £156 m | £390 m |
Floating Foundations Installation | £313 m | £313 m | £455 m |
Operation and Maintenance Base | £7 m | £7 m | £7 m |
Total | £3,449 m | £4,167 m | £7,968 m |
Total (%) | 43% | 52% | 100% |
- Applying turnover per employee and turnover/GVA ratios for the relevant sectors it was estimated that the direct economic impact of the Array could be £1.4 billion and 20,680 years of employment in Scotland and £1.7 billion GVA and 24,910 years of employment in the UK (Table 6.6).
Table 6.6: PDE Option 3: Array Construction Direct Economic Impact, Scotland and the UK
Parameters | Scotland | UK | ||
|---|---|---|---|---|
| GVA | Years of Employment | GVA | Years of Employment |
Wind Turbine | £314 m | 4,710 | £486 m | 7,260 |
Floating Foundation Manufacturing | £723 m | 10,430 | £723 m | 10,430 |
Offshore Cable Installation | £12 m | 150 | £17 m | 200 |
Cables Supply | £0 m | 0 | £32 m | 430 |
OSP | £74 m | 1,290 | £86 m | 1,450 |
Development and Consenting Services | £116 m | 1,820 | £149 m | 2,320 |
Floating Mooring Systems | £35 m | 530 | £70 m | 1,050 |
Floating Foundations Installation | £111 m | 1,730 | £111 m | 1,730 |
Operation and Maintenance Base | £2 m | 30 | £2 m | 30 |
Total | £1,388 m | 20,680 | £1,676 m | 24,910 |
- Applying GVA and employment multipliers it was therefore estimated that the Array’s economic impact could be £2.3 billion GVA and 34,750 years of employment in Scotland, and £4.4 billion GVA and 62,640 years of employment in the UK (Table 6.7) (Table 6.8).
Table 6.7: PDE Option 3: Array Construction Total GVA impact, Scotland and the UK
Parameters | Scotland | UK |
|---|---|---|
Direct GVA | £1,388 m | £1,676 m |
Indirect GVA | £528 m | £1,349 m |
Induced GVA | £432 m | £1,339 m |
Total GVA | £2,348 m | £4,365 m |
Table 6.8: PDE Option 3: Array Construction Total Employment impact, Scotland and the UK
Parameters | Scotland | UK |
|---|---|---|
Direct Years of Employment | 20,680 | 24,910 |
Indirect Years of Employment | 8,420 | 18,590 |
Induced Years of Employment | 5,660 | 19,150 |
Total Years of Employment | 34,750 | 62,640 |
- The spend at the primary construction port(s) is expected to be around £217 million, which would require a significant workforce, with an estimated peak direct employment of 340 jobs (Table 6.9). The largest contract is expected to be associated with marshalling harbour (£162 million).
Table 6.9: PDE Option 3: Array Construction Port Impact by Category
Parameters | Total Investment | Port Spend | Employment | Peak Employment |
|---|---|---|---|---|
Wind Turbine Assembly | £121 m | £17 m | 80 | 20 |
Marshalling Harbour | £162 m | £162 m | 1,310 | 290 |
Offshore Logistics | £9 m | £9 m | 80 | 20 |
Anchor Installation | £142 m | £28 m | 70 | 10 |
Total | £434 m | £217 m | 1,540 | 340 |
6.2. Operation and Maintenance
6.2. Operation and Maintenance
6.2.1. Ossian Impact
6.2.1. Ossian Impact
- Based on the estimated annual expenditure for Ossian as a whole, the technical expert’s model of costs and the information provided in the SCDS it was assumed that under PDE Option 3 the annual operation and maintenance expenditure could be £247 million, of which £76 million (31%) could be secured in Scotland and £219 million in the UK (89%). This is shown in Table 6.10.
Table 6.10: PDE Option 3: Ossian Operation and Maintenance Spending by Category, Scotland and the UK
Parameters | Scotland | UK (Inc. Scotland) | Total (Scotland, rUK and rWorld) |
|---|---|---|---|
Operational Training | £4 m | £4 m | £5 m |
Operational Onshore Logistics | £2 m | £2 m | £3 m |
Operational Offshore Logistics | £9 m | £13 m | £13 m |
Health and Safety Inspections | £1 m | £1 m | £1 m |
Seabed Lease | £17 m | £17 m | £17 m |
TNUoS Charges | £0 m | £106 m | £106 m |
Operational Insurance | £0 m | £12 m | £12 m |
Operations Centre and Support Staff | £14 m | £18 m | £18 m |
Wind Turbine Maintenance and Service | £16 m | £23 m | £47 m |
Balance of Plant Maintenance and Service | £11 m | £18 m | £21 m |
Maintenance Vessels | £2 m | £4 m | £4 m |
Maintenance Port | £1 m | £1 m | £1 m |
Total | £76 m | £219 m | £247 m |
Total (%) | 31% | 89% | 100% |
- Applying turnover per employee and turnover/GVA ratios for the relevant sectors it was estimated that Array’s direct annual economic impact could be £29 million GVA and 350 jobs in Scotland, and £64 million GVA and 600 years of employment in the UK (Table 6.11).
Table 6.11: PDE Option 3: Ossian Operation and Maintenance Direct Economic Impact, Scotland and the UK
Parameters | Scotland | UK | ||
|---|---|---|---|---|
| GVA | Jobs | GVA | Jobs |
Operational Training | £2 m | 40 | £2 m | 40 |
Operational Onshore Logistics | £1 m | 10 | £1 m | 10 |
Operational Offshore Logistics | £2 m | 20 | £3 m | 30 |
Health and Safety Inspections | <£1 m | 0 | <£1 m | 0 |
Seabed Lease | £10 m | 100 | £10 m | 100 |
TNUoS Charges | £0 m | 0 | £22 m | 110 |
Operational Insurance | £0 m | 0 | £4 m | 20 |
Operations Centre and Support Staff | £3 m | 30 | £4 m | 40 |
Wind Turbine Maintenance and Service | £5 m | 60 | £7 m | 80 |
Balance of Plant Maintenance and Service | £4 m | 70 | £8 m | 120 |
Maintenance Vessels | £1 m | 10 | £2 m | 30 |
Maintenance Port | <£1 m | 0 | <£1 m | 0 |
Total | £29 m | 350 | £64 m | 600 |
- Applying GVA and employment multipliers it was therefore estimated that the Array’s annual economic impact could be £49 million GVA and 570 jobs in Scotland, and £195 million GVA and 1,670 years of employment in the UK (Table 6.12) (Table 6.13).
Table 6.12: PDE Option 3: Ossian Operation and Maintenance GVA impact, Scotland and the UK
Parameters | Scotland | UK |
|---|---|---|
Direct GVA | £29 m | £64 m |
Indirect GVA | £11 m | £85 m |
Induced GVA | £8 m | £46 m |
Total GVA | £49 m | £195 m |
Table 6.13: PDE Option 3: Ossian Operation and Maintenance Employment impact, Scotland and the UK
Parameters | Scotland | UK |
|---|---|---|
Direct Employment | 350 | 600 |
Indirect Employment | 160 | 810 |
Induced Employment | 60 | 260 |
Total Employment | 570 | 1,670 |
6.2.2. Array Impact
6.2.2. Array Impact
- For the Array it was estimated that the annual spend could be £247 million, of which £73 million (30%) could be secured in Scotland and £214 million (87%) could be secured in the UK (Table 6.14).
Table 6.14: PDE Option 3: Array Operation and Maintenance Spending by Category, Scotland and the UK
Parameters | Scotland | UK (Inc. Scotland) | Total (Scotland, rUK and rWorld) |
|---|---|---|---|
Operational Training | £4 m | £4 m | £5 m |
Operational Onshore Logistics | £2 m | £2 m | £3 m |
Operational Offshore Logistics | £8 m | £12 m | £13 m |
Health and Safety Inspections | £1 m | £1 m | £1 m |
Seabed Lease | £17 m | £17 m | £17 m |
TNUoS Charges | £0 m | £106 m | £106 m |
Operational Insurance | £0 m | £11 m | £12 m |
Operations Centre and Support Staff | £12 m | £16 m | £18 m |
Wind Turbine Maintenance and Service | £16 m | £23 m | £47 m |
Balance of Plant Maintenance and Service | £11 m | £18 m | £21 m |
Maintenance Vessels | £2 m | £3 m | £4 m |
Maintenance Port | £1 m | £1 m | £1 m |
Total | £73 m | £214 m | £247 m |
Total (%) | 30% | 87% | 100% |
- Applying turnover per employee and turnover/GVA ratios for the relevant sectors it was estimated that the Array’s direct annual economic impact could be £28 million GVA and 350 jobs in Scotland, and £63 million GVA and 590 years of employment in the UK (Table 6.15).
Table 6.15: PDE Option 3: Array Operation and Maintenance Direct Economic Impact, Scotland and the UK
Parameters | Scotland | UK | ||
|---|---|---|---|---|
| GVA | Jobs | GVA | Jobs |
Operational Training | £2 m | 40 | £2 m | 40 |
Operational Onshore Logistics | £1 m | 10 | £1 m | 10 |
Operational Offshore Logistics | £2 m | 20 | £3 m | 30 |
Health and Safety Inspections | <£1 m | 0 | <£1 m | 0 |
Seabed Lease | £10 m | 100 | £10 m | 100 |
TNUoS Charges | £0 m | 0 | £22 m | 110 |
Operational Insurance | £0 m | 0 | £4 m | 10 |
Operations Centre and Support Staff | £3 m | 30 | £3 m | 40 |
Wind Turbine Maintenance and Service | £5 m | 60 | £7 m | 80 |
Balance of Plant Maintenance and Service | £4 m | 70 | £8 m | 120 |
Maintenance Vessels | £1 m | 10 | £2 m | 20 |
Maintenance Port | <£1 m | 0 | <£1 m | 0 |
Total | £28 m | 350 | £63 m | 590 |
- Applying GVA and employment multipliers it was therefore estimated that the Array’s annual economic impact could be £48 million GVA and 560 jobs in Scotland, and £191 million GVA and 1,650 years of employment in the UK (Table 6.16) (Table 6.17).
Table 6.16: PDE Option 3: Array Operation and Maintenance GVA impact, Scotland and the UK
Parameters | Scotland | UK |
|---|---|---|
Direct GVA | £28 m | £63 m |
Indirect GVA | £11 m | £84 m |
Induced GVA | £8 m | £45 m |
Total GVA | £48 m | £191 m |
Table 6.17: PDE Option 3: Array Operation and Maintenance Employment impact, Scotland and the UK
Parameters | Scotland | UK |
|---|---|---|
Direct Employment | 350 | 590 |
Indirect Employment | 150 | 800 |
Induced Employment | 60 | 260 |
Total Employment | 560 | 1,650 |
- The spend at the primary operation and maintenance port(s) is expected to be around £25 million, directly employing 80 people (Table 6.18).
Table 6.18: PDE Option 3: Array Operation and Maintenance Port Impact by Category
Parameters | Total Investment | Port Spend | Employment |
|---|---|---|---|
Operational Offshore Logistics | £13 m | £6 m | 20 |
Operations Centre and Support Staff | £18 m | £12 m | 30 |
Wind Turbine Maintenance and Service | £47 m | £5 m | 20 |
Balance of Plant Maintenance and Service | £21 m | £2 m | 10 |
Maintenance Port | £1 m | £1 m | 0 |
Total | £100 m | £25 m | 80 |
6.3. Decommissioning
6.3. Decommissioning
6.3.1. Ossian Impact
6.3.1. Ossian Impact
- For decommissioning, which is expected to take place after the operation and maintenance lifespan of the Array, it was estimated that the cost could be £542 million, of which £162 million (30%) could be secured in the UK (all of which could be secured in Scotland). It is assumed that the remaining 70% could be secured elsewhere in the world (Table 6.19).
Table 6.19: PDE Option 3: Ossian Decommissioning Spending by Category, Scotland and the UK
Parameters | Scotland | UK (Inc. Scotland) | Total (Scotland, rUK and rWorld) |
|---|---|---|---|
Wind Turbine Decommissioning | £8 m | £8 m | £26 m |
Mooring and Anchoring Decommissioning | £45 m | £45 m | £148 m |
Cable Decommissioning | £81 m | £81 m | £271 m |
OSP Decommissioning | £29 m | £29 m | £96 m |
Total | £162 m | £162 m | £542 m |
Total (%) | 30% | 30% | 100% |
- Applying turnover per employee and turnover/GVA ratios for the relevant sectors it was estimated that the Array’s direct economic impact could be £49 million GVA and 580 years of employment i in the UK, all of which could be secured in Scotland (Table 6.20).
Table 6.20: PDE Option 3: Ossian Decommissioning Direct Economic Impact, Scotland and the UK
Parameters | Scotland | UK | ||
|---|---|---|---|---|
| GVA | Jobs | GVA | Jobs |
Wind Turbine Decommissioning | £2 m | 30 | £2 m | 30 |
Mooring and Anchoring Decommissioning | £14 m | 160 | £14 m | 160 |
Cable Decommissioning | £25 m | 290 | £25 m | 290 |
OSP Decommissioning | £9 m | 100 | £9 m | 100 |
Total | £49 m | 580 | £49 m | 580 |
- Applying GVA and employment multipliers it was therefore estimated that the Array’s economic impact could be £90 million GVA and 1,040 years of employment in Scotland, and £130 million GVA and 1,580 years of employment in the UK (Table 6.21; Table 6.22).
Table 6.21: PDE Option 3: Ossian Decommissioning GVA impact, Scotland and the UK
Parameters | Scotland | UK |
|---|---|---|
Direct GVA | £49 m | £49 m |
Indirect GVA | £22 m | £44 m |
Induced GVA | £15 m | £37 m |
Total GVA | £90 m | £130 m |
Table 6.22: PDE Option 3: Ossian Decommissioning Employment impact, Scotland and the UK
Parameters | Scotland | UK |
|---|---|---|
Direct Years of Employment | 580 | 580 |
Indirect Years of Employment | 290 | 560 |
Induced Years of Employment | 170 | 450 |
Total Years of Employment | 1,040 | 1,580 |
6.3.2. Array Impact
6.3.2. Array Impact
- The decommissioning spend associated with the Array was estimated to be £174 million, of which £52 million (30%) could be secured in Scotland and the UK (Table 6.23).
Table 6.23: PDE Option 3: Array Decommissioning Spending by Category, Scotland and the UK
Parameters | Scotland | UK (Inc. Scotland) | Total (Scotland, rUK and rWorld) |
|---|---|---|---|
Wind Turbine Decommissioning | £8 m | £8 m | £26 m |
Mooring and Anchoring Decommissioning | £45 m | £45 m | £148 m |
Total | £52 m | £52 m | £174 m |
Total (%) | 30% | 30% | 100% |
- Applying turnover per employee and turnover/GVA ratios for the relevant sectors it was estimated that the Array’s direct economic impact could be £16 million GVA and 190 years of employment in Scotland and the UK (Table 6.24).
Table 6.24: PDE Option 3: Array Decommissioning Direct Economic Impact, Scotland and the UK
Parameters | Scotland | UK | ||
|---|---|---|---|---|
| GVA | Jobs | GVA | Jobs |
Wind Turbine Decommissioning | £2 m | 30 | £2 m | 30 |
Mooring and Anchoring Decommissioning | £14 m | 160 | £14 m | 160 |
Total | £16 m | 190 | £16 m | 190 |
- Applying GVA and employment multipliers it was therefore estimated that the economic impact of decommissioning the Array could be £30 million GVA and 330 years of employment in Scotland, and £40 million GVA and 510 years of employment in the UK (Table 6.25; Table 6.26).
Table 6.25: PDE Option 3: Array Decommissioning GVA impact, Scotland and the UK
Parameters | Scotland | UK |
|---|---|---|
Direct GVA | £16 m | £16 m |
Indirect GVA | £7 m | £14 m |
Induced GVA | £5 m | £12 m |
Total GVA | £30 m | £40 m |
Table 6.26: PDE Option 3: Array Decommissioning Employment impact, Scotland and the UK
Parameters | Scotland | UK |
|---|---|---|
Direct Years of Employment | 190 | 190 |
Indirect Years of Employment | 90 | 180 |
Induced Years of Employment | 60 | 140 |
Total Years of Employment | 330 | 510 |
7. Economic Impact of PDE Option 4 (Commitment)
7. Economic Impact of PDE Option 4 (Commitment)
7.1. Construction
7.1. Construction
7.1.1. Ossian Impact
7.1.1. Ossian Impact
- Based on the estimated expenditure for the Ossian as a whole, the technical expert’s model of costs and the information provided in the SCDS it was assumed that under PDE Option 4 the total construction phase spend in Scotland could £3.6 billion (35% of total expenditure) and total spend in the UK could be £4.6 billion (45%), which is shown in Table 7.1. The largest expenditure is associated with the manufacture of floating foundations.
Table 7.1: PDE Option 4: Ossian Construction Spending by Category, Scotland and the UK
Parameters | Scotland | UK (Inc. Scotland) | Total (Scotland, rUK and rWorld) |
|---|---|---|---|
Wind Turbine | £698 m | £1,130 m | £3,438 m |
Floating Foundation Manufacturing | £1,865 m | £1,865 m | £2,273 m |
Cables Supply | £187 m | £262 m | £1,249 m |
Offshore Cable Installation | £0 m | £133 m | £1,235 m |
Floating Foundations Installation | £180 m | £215 m | £505 m |
OSP | £339 m | £433 m | £471 m |
Development and Consenting Services | £72 m | £144 m | £360 m |
Floating Mooring Systems | £221 m | £221 m | £321 m |
Onshore Substation | £0 m | £129 m | £280 m |
Onshore Cable Installation | £0 m | £34 m | £34 m |
Operation and Maintenance Base | £7 m | £7 m | £7 m |
Total | £3,570 m | £4,573 m | £10,174 m |
Total (%) | 35% | 45% | 100% |
- Applying turnover per employee and turnover/GVA ratios for the relevant sectors it was estimated that the direct economic of the Array could be £1.4 billion and 21,470 years of employment in Scotland and £1.8 billion GVA and 26,930 years of employment in the UK (Table 7.2).
Table 7.2: PDE Option 4: Ossian Construction Direct Economic Impact, Scotland and the UK
Parameters | Scotland | UK | ||
|---|---|---|---|---|
| GVA | Years of Employment | GVA | Years of Employment |
Wind Turbine | £288 m | 4,360 | £457 m | 6,870 |
Floating Foundation Manufacturing | £736 m | 10,610 | £736 m | 10,610 |
Cables Supply | £48 m | 590 | £67 m | 820 |
Offshore Cable Installation | £0 m | 0 | £49 m | 680 |
Floating Foundations Installation | £74 m | 1,290 | £86 m | 1,450 |
OSP | £185 m | 2,890 | £236 m | 3,690 |
Development and Consenting Services | £32 m | 490 | £65 m | 970 |
Floating Mooring Systems | £78 m | 1,220 | £78 m | 1,220 |
Onshore Substation | £0 m | 0 | £41 m | 470 |
Onshore Cable Installation | £0 m | 0 | £11 m | 120 |
Operation and Maintenance Base | £2 m | 30 | £2 m | 30 |
Total | £1,444 m | 21,470 | £1,828 m | 26,930 |
- Applying GVA and employment multipliers it was therefore estimated that the total economic impact could be £2.4 billion GVA and 35,920 years of employment in Scotland, and £4.8 billion GVA and 67,980 years of employment in the UK (Table 7.3; Table 7.4).
Table 7.3: PDE Option 4: Ossian Construction GVA impact, Scotland and the UK
Parameters | Scotland | UK |
|---|---|---|
Direct GVA | £1,444 m | £1,828 m |
Indirect GVA | £541 m | £1,483 m |
Induced GVA | £448 m | £1,461 m |
Total GVA | £2,433 m | £4,772 m |
Table 7.4: PDE Option 4: Ossian Construction Employment impact, Scotland and the UK
Parameters | Scotland | UK |
|---|---|---|
Direct Years of Employment | 21,470 | 26,930 |
Indirect Years of Employment | 8,610 | 20,290 |
Induced Years of Employment | 5,840 | 20,760 |
Total Years of Employment | 35,920 | 67,980 |
7.1.2. Array Impact
7.1.2. Array Impact
- For the Array it was estimated that the total spend could be £7.7 billion, of which £3.3 billion (43%) could be secured in Scotland and £4.0 billion (52%) could be secured in the UK (Table 7.5).
Table 7.5: PDE Option 4: Array Construction Spending by Category, Scotland and the UK
Parameters | Scotland | UK (Inc. Scotland) | Total (Scotland, rUK and rWorld) |
|---|---|---|---|
Wind Turbine | £698 m | £1,130 m | £3,438 m |
Floating Foundation Manufacturing | £1,865 m | £1,865 m | £2,273 m |
Offshore Cable Installation | £47 m | £66 m | £312 m |
Cables Supply | £0 m | £73 m | £145 m |
OSP | £180 m | £215 m | £505 m |
Development and Consenting Services | £214 m | £273 m | £297 m |
Floating Mooring Systems | £72 m | £144 m | £360 m |
Floating Foundations Installation | £221 m | £221 m | £321 m |
Operation and Maintenance Base | £7 m | £7 m | £7 m |
Total | £3,304 m | £3,994 m | £7,659 m |
Total (%) | 43% | 52% | 100% |
- Applying turnover per employee and turnover/GVA ratios for the relevant sectors it was estimated that the direct economic impact of the Array could be £1.3 billion and 19,960 years of employment in Scotland and £1.6 billion GVA and 24,040 years of employment in the UK (Table 7.6).
Table 7.6: PDE Option 4: Array Construction Direct Economic Impact, Scotland and the UK
Parameters | Scotland | UK | ||
|---|---|---|---|---|
| GVA | Years of Employment | GVA | Years of Employment |
Wind Turbine | £288 m | 4,360 | £457 m | 6,870 |
Floating Foundation Manufacturing | £736 m | 10,610 | £736 m | 10,610 |
Offshore Cable Installation | £12 m | 150 | £17 m | 200 |
Cables Supply | £0 m | 0 | £27 m | 360 |
OSP | £74 m | 1,290 | £86 m | 1,450 |
Development and Consenting Services | £116 m | 1,820 | £149 m | 2,320 |
Floating Mooring Systems | £32 m | 490 | £65 m | 970 |
Floating Foundations Installation | £78 m | 1,220 | £78 m | 1,220 |
Operation and Maintenance Base | £2 m | 30 | £2 m | 30 |
Total | £1,340 m | 19,960 | £1,617 m | 24,040 |
- Applying GVA and employment multipliers it was therefore estimated that the Array’s economic impact could be £2.3 billion GVA and 33,500 years of employment in Scotland, and £4.2 billion GVA and 60,310 years of employment in the UK (Table 7.7; Table 7.8).
Table 7.7: PDE Option 4: Array Construction Total GVA impact, Scotland and the UK
Parameters | Scotland | UK |
|---|---|---|
Direct GVA | £1,340 m | £1,617 m |
Indirect GVA | £506 m | £1,295 m |
Induced GVA | £418 m | £1,293 m |
Total GVA | £2,264 m | £4,205 m |
Table 7.8: PDE Option 4: Array Construction Total Employment impact, Scotland and the UK
Parameters | Scotland | UK |
|---|---|---|
Direct Years of Employment | 19,960 | 24,040 |
Indirect Years of Employment | 8,080 | 17,800 |
Induced Years of Employment | 5,460 | 18,470 |
Total Years of Employment | 33,500 | 60,310 |
- The spend at the primary construction port(s) is expected to be around £154 million, which would require a significant workforce, with an estimated peak direct employment of 240 jobs (Table 7.9). The largest contract is expected to be associated with marshalling harbour (£114 million).
Table 7.9: PDE Option 4: Array Construction Port Impact by Category
Parameters | Total Investment | Port Spend | Employment | Peak Employment |
|---|---|---|---|---|
Wind Turbine Assembly | £96 m | £14 m | 70 | 10 |
Marshalling Harbour | £114 m | £114 m | 930 | 210 |
Offshore Logistics | £6 m | £6 m | 60 | 10 |
Anchor Installation | £100 m | £20 m | 50 | 10 |
Total | £317 m | £154 m | 1,110 | 240 |
7.2. Operation and Maintenance
7.2. Operation and Maintenance
7.2.1. Ossian Impact
7.2.1. Ossian Impact
- Based on the estimated annual expenditure for Ossian as a whole, the technical expert’s model of costs and the information provided in the SCDS it was assumed that under PDE Option 4 the annual operation and maintenance expenditure could be £227 million, of which £68 million (30%) could be secured in Scotland and £207 million in the UK (91%). This is shown in Table 7.10.
Table 7.10: PDE Option 4: Ossian Operation and Maintenance Spending by Category, Scotland and the UK
Parameters | Scotland | UK (Inc. Scotland) | Total (Scotland, rUK and rWorld) |
|---|---|---|---|
Operational Training | £4 m | £4 m | £5 m |
Operational Onshore Logistics | £2 m | £2 m | £3 m |
Operational Offshore Logistics | £9 m | £13 m | £13 m |
Health and Safety Inspections | £1 m | £1 m | £1 m |
Seabed Lease | £17 m | £17 m | £17 m |
TNUoS Charges | £0 m | £106 m | £106 m |
Operational Insurance | £0 m | £12 m | £12 m |
Operations Centre and Support Staff | £14 m | £18 m | £18 m |
Wind Turbine Maintenance and Service | £11 m | £16 m | £33 m |
Balance of Plant Maintenance and Service | £8 m | £14 m | £17 m |
Maintenance Vessels | £1 m | £3 m | £3 m |
Maintenance Port | £1 m | £1 m | £1 m |
Total | £68 m | £207 m | £227 m |
Total (%) | 30% | 91% | 100% |
- Applying GVA and employment ratios it was therefore estimated that the Array’s direct annual economic could be £26 million GVA and 320 jobs in Scotland, and £60 million GVA and 540 years of employment in the UK (Table 7.11).
Table 7.11: PDE Option 4: Ossian Operation and Maintenance Direct Economic Impact, Scotland and the UK
Parameters | Scotland | UK | ||
|---|---|---|---|---|
| GVA | Jobs | GVA | Jobs |
Operational Training | £2 m | 40 | £2 m | 40 |
Operational Onshore Logistics | £1 m | 10 | £1 m | 10 |
Operational Offshore Logistics | £2 m | 20 | £3 m | 30 |
Health and Safety Inspections | <£1 m | 0 | <£1 m | 0 |
Seabed Lease | £10 m | 100 | £10 m | 100 |
TNUoS Charges | £0 m | 0 | £22 m | 110 |
Operational Insurance | £0 m | 0 | £4 m | 20 |
Operations Centre and Support Staff | £3 m | 30 | £4 m | 40 |
Wind Turbine Maintenance and Service | £3 m | 40 | £5 m | 60 |
Balance of Plant Maintenance and Service | £4 m | 60 | £6 m | 100 |
Maintenance Vessels | £1 m | 10 | £2 m | 20 |
Maintenance Port | <£1 m | 0 | <£1 m | 0 |
Total | £26 m | 320 | £60 m | 540 |
- Applying GVA and employment multipliers it was therefore estimated that the Array’s annual economic impact could be £44 million GVA and 500 jobs in Scotland, and £183 million GVA and 1,510 years of employment in the UK(Table 7.12; Table 7.13).
Table 7.12: PDE Option 4: Ossian Operation and Maintenance GVA impact, Scotland and the UK
Parameters | Scotland | UK |
|---|---|---|
Direct GVA | £26 m | £60 m |
Indirect GVA | £10 m | £81 m |
Induced GVA | £8 m | £42 m |
Total GVA | £44 m | £183 m |
Table 7.13: PDE Option 4: Ossian Operation and Maintenance Employment impact, Scotland and the UK
Parameters | Scotland | UK |
|---|---|---|
Direct Employment | 320 | 540 |
Indirect Employment | 140 | 750 |
Induced Employment | 50 | 220 |
Total Employment | 500 | 1,510 |
7.2.2. Array Impact
7.2.2. Array Impact
- For the Array it was estimated that the annual spend could be £227 million, of which £65 million (29%) could be secured in Scotland and £202 million (89%) could be secured in the UK (Table 7.14).
Table 7.14: PDE Option 4: Array Operation and Maintenance Spending by Category, Scotland and the UK
Parameters | Scotland | UK (Inc. Scotland) | Total (Scotland, rUK and rWorld) |
|---|---|---|---|
Operational Training | £4 m | £4 m | £5 m |
Operational Onshore Logistics | £2 m | £2 m | £3 m |
Operational Offshore Logistics | £8 m | £12 m | £13 m |
Health and Safety Inspections | £1 m | £1 m | £1 m |
Seabed Lease | £17 m | £17 m | £17 m |
TNUoS Charges | £0 m | £106 m | £106 m |
Operational Insurance | £0 m | £11 m | £12 m |
Operations Centre and Support Staff | £12 m | £16 m | £18 m |
Wind Turbine Maintenance and Service | £11 m | £16 m | £33 m |
Balance of Plant Maintenance and Service | £8 m | £14 m | £17 m |
Maintenance Vessels | £1 m | £3 m | £3 m |
Maintenance Port | <£1 m | <£1 m | £1 m |
Total | £65 m | £202 m | £227 m |
Total (%) | 29% | 89% | 100% |
- Applying turnover per employee and turnover/GVA ratios for the relevant sectors it was estimated that the Array’s direct annual economic impact could be £26 million GVA and 310 jobs in Scotland, and £58 million GVA and 530 years of employment in the UK (Table 7.15).
Table 7.15: PDE Option 4: Array Operation and Maintenance Direct Economic Impact, Scotland and the UK
Parameters | Scotland | UK | ||
|---|---|---|---|---|
| GVA | Jobs | GVA | Jobs |
Operational Training | £2 m | 40 | £2 m | 40 |
Operational Onshore Logistics | £1 m | 10 | £1 m | 10 |
Operational Offshore Logistics | £2 m | 20 | £3 m | 30 |
Health and Safety Inspections | <£1 m | 0 | <£1 m | 0 |
Seabed Lease | £10 m | 100 | £10 m | 100 |
TNUoS Charges | £0 m | 0 | £22 m | 110 |
Operational Insurance | £0 m | 0 | £4 m | 10 |
Operations Centre and Support Staff | £3 m | 30 | £3 m | 40 |
Wind Turbine Maintenance and Service | £3 m | 40 | £5 m | 60 |
Balance of Plant Maintenance and Service | £4 m | 60 | £6 m | 100 |
Maintenance Vessels | £1 m | 10 | £1 m | 20 |
Maintenance Port | <£1 m | 0 | <£1 m | 0 |
Total | £26 m | 310 | £58 m | 530 |
- Applying GVA and employment multipliers it was therefore estimated that the Array’s annual economic impact could be £43 million GVA and 490 jobs in Scotland, and £179 million GVA and 1,480 years of employment in the UK (Table 7.16; Table 7.17).
Table 7.16: PDE Option 4: Array Operation and Maintenance GVA impact, Scotland and the UK
Parameters | Scotland | UK |
|---|---|---|
Direct GVA | £26 m | £58 m |
Indirect GVA | £10 m | £80 m |
Induced GVA | £7 m | £41 m |
Total GVA | £43 m | £179 m |
Table 7.17: PDE Option 4: Array Operation and Maintenance Employment impact, Scotland and the UK
Parameters | Scotland | UK |
|---|---|---|
Direct Employment | 310 | 530 |
Indirect Employment | 130 | 750 |
Induced Employment | 50 | 210 |
Total Employment | 490 | 1,480 |
- The spend at the primary operation and maintenance port(s) is expected to be around £23 million, directly employing 70 people (Table 7.18).
Table 7.18: PDE Option 4: Array Operation and Maintenance Port Impact by Category
Parameters | Total Investment | Port Spend | Employment |
|---|---|---|---|
Operational Offshore Logistics | £13 m | £6 m | 20 |
Operations Centre and Support Staff | £18 m | £12 m | 30 |
Wind Turbine Maintenance and Service | £33 m | £3 m | 10 |
Balance of Plant Maintenance and Service | £17 m | £2 m | 10 |
Maintenance Port | £1 m | <£1 m | 0 |
Total | £81 m | £23 m | 70 |
7.3. Decommissioning
7.3. Decommissioning
7.3.1. Ossian Impact
7.3.1. Ossian Impact
- For decommissioning, which is expected to take place after the operation and maintenance lifespan of the Array, it was estimated that the cost could be £542 million, of which £162 million (30%) could be secured in the UK (all of which could be secured in Scotland). It is assumed that the remaining 70% could be secured elsewhere in the world (Table 7.19).
Table 7.19: PDE Option 4: Ossian Decommissioning Spending by Category, Scotland and the UK
Parameters | Scotland | UK (Inc. Scotland) | Total (Scotland, rUK and rWorld) |
|---|---|---|---|
Wind Turbine Decommissioning | £8 m | £8 m | £26 m |
Mooring and Anchoring Decommissioning | £45 m | £45 m | £148 m |
Cable Decommissioning | £81 m | £81 m | £271 m |
OSP Decommissioning | £29 m | £29 m | £96 m |
Total | £162 m | £162 m | £542 m |
Total (%) | 30% | 30% | 100% |
- Applying turnover per employee and turnover/GVA ratios for the relevant sectors it was estimated that the Array’s direct economic impact could be £49 million GVA and 580 years of employment in the UK, all of which could be secured in Scotland (Table 7.20).
Table 7.20: PDE Option 4: Ossian Decommissioning Direct Economic Impact, Scotland and the UK
Parameters | Scotland | UK | ||
|---|---|---|---|---|
| GVA | Jobs | GVA | Jobs |
Wind Turbine Decommissioning | £2 m | 30 | £2 m | 30 |
Mooring and Anchoring Decommissioning | £14 m | 160 | £14 m | 160 |
Cable Decommissioning | £25 m | 290 | £25 m | 290 |
OSP Decommissioning | £9 m | 100 | £9 m | 100 |
Total | £49 m | 580 | £49 m | 580 |
- Applying GVA and employment multipliers it was therefore estimated that ’s economic impact could be £90 million GVA and 1,040 years of employment in Scotland, and £130 million GVA and 1,580 years of employment in the UK (Table 7.21; Table 7.22).
Table 7.21: PDE Option 4: Ossian Decommissioning GVA impact, Scotland and the UK
Parameters | Scotland | UK |
|---|---|---|
Direct GVA | £49 m | £49 m |
Indirect GVA | £22 m | £44 m |
Induced GVA | £15 m | £37 m |
Total GVA | £90 m | £130 m |
Table 7.22: PDE Option 4: Ossian Decommissioning Employment impact, Scotland and the UK
Parameters | Scotland | UK |
|---|---|---|
Direct Years of Employment | 580 | 580 |
Indirect Years of Employment | 290 | 560 |
Induced Years of Employment | 170 | 450 |
Total Years of Employment | 1,040 | 1,580 |
7.3.2. Array Impact
7.3.2. Array Impact
- The decommissioning spend associated with the Array was estimated to be £174 million, of which £52 million (30%) could be secured in Scotland and the UK (Table 7.23).
Table 7.23: PDE Option 4: Array Decommissioning Spending by Category, Scotland and the UK
Parameters | Scotland | UK (Inc. Scotland) | Total (Scotland, rUK and rWorld) |
|---|---|---|---|
Wind Turbine Decommissioning | £8 m | £8 m | £26 m |
Mooring and Anchoring Decommissioning | £45 m | £45 m | £148 m |
Total | £52 m | £52 m | £174 m |
Total (%) | 30% | 30% | 100% |
- Applying turnover per employee and turnover/GVA ratios for the relevant sectors it was estimated that the Array’s direct economic impact could be £16 million GVA and 190 years of employment in Scotland and the UK (Table 7.24).
Table 7.24: PDE Option 4: Array Decommissioning Direct Economic Impact, Scotland and the UK
Parameters | Scotland | UK | ||
|---|---|---|---|---|
| GVA | Jobs | GVA | Jobs |
Wind Turbine Decommissioning | £2 m | 30 | £2 m | 30 |
Mooring and Anchoring Decommissioning | £14 m | 160 | £14 m | 160 |
Total | £16 m | 190 | £16 m | 190 |
- Applying GVA and employment multipliers it was therefore estimated that the economic impact of decommissioning the Array could be £30 million GVA and 330 years of employment in Scotland, and £40 million GVA and 510 years of employment in the UK (Table 7.25; Table 7.26).
Table 7.25: PDE Option 4: Array Decommissioning GVA impact, Scotland and the UK
Parameters | Scotland | UK |
|---|---|---|
Direct GVA | £16 m | £16 m |
Indirect GVA | £7 m | £14 m |
Induced GVA | £5 m | £12 m |
Total GVA | £30 m | £40 m |
Table 7.26: PDE Option 4: Array Decommissioning Employment impact, Scotland and the UK
Parameters | Scotland | UK |
|---|---|---|
Direct Years of Employment | 190 | 190 |
Indirect Years of Employment | 90 | 180 |
Induced Years of Employment | 60 | 140 |
Total Years of Employment | 330 | 510 |
8. Maximum Design Scenario
8. Maximum Design Scenario
8.1. Summary of Impact by PDE Option
8.1. Summary of Impact by PDE Option
- The maximum design scenario is the PDE Option that is expected to generate least beneficial impacts. For each of the four PDE Options of Ossian, Table 8.1 and Table 8.2 summarise the economic impacts in Scotland and Table 8.3 and Table 8.4 summarise the economic impacts in the UK. As the PDE Option with the lowest economic impacts, PDE Option 4 has been identified as the maximum design scenario and has therefore been assessed as part of the socio-economics EIA chapter (volume 2, chapter 18).
Table 8.1: Economic Impact of Construction by PDE Option, Scotland
Parameters | PDE Option 1 | PDE Option 2 | PDE Option 3 | PDE Option 4 |
|---|---|---|---|---|
Supply Chain Spending (Scotland) | £4,043 m | £3,813 m | £3,715 m | £3,570 m |
Total GVA | £2,718 m | £2,575 m | £2,517 m | £2,433 m |
Total Years of Employment | 40,110 | 38,030 | 37,170 | 35,920 |
Table 8.2: Economic Impact of Operation and Maintenance by PDE Option, Scotland
Parameters | PDE Option 1 | PDE Option 2 | PDE Option 3 | PDE Option 4 |
|---|---|---|---|---|
Supply Chain Spending (Scotland) | £87 m | £80 m | £76 m | £68 m |
Total Annual GVA | £55 m | £51 m | £49 m | £44 m |
Total Jobs | 660 | 610 | 570 | 500 |
Table 8.3: Economic Impact of Construction by PDE Option, UK
Parameters | PDE Option 1 | PDE Option 2 | PDE Option 3 | PDE Option 4 |
|---|---|---|---|---|
Supply Chain Spending (UK) | £5,108 m | £4,857 m | £4,747 m | £4,573 m |
Total GVA | £5,271 m | £5,034 m | £4,932 m | £4,772 m |
Total Years of Employment | 75,170 | 71,780 | 70,310 | 67,980 |
Table 8.4: Economic Impact of Operation and Maintenance by PDE Option, UK
Parameters | PDE Option 1 | PDE Option 2 | PDE Option 3 | PDE Option 4 |
|---|---|---|---|---|
Supply Chain Spending (UK) | £237 m | £226 m | £219 m | £207 m |
Total Annual GVA | £212 m | £202 m | £195 m | £183 m |
Total Jobs | 1,910 | 1,770 | 1,670 | 1,510 |
8.2. Ambition Scenario
8.2. Ambition Scenario
- As part of the SCDS, developers also provide the spending associated with an ambition scenario, which sets out a higher share of contracts being secured in Scotland if certain conditions are met, e.g. the further development of the Scottish supply chain.
- Under the ambition scenario, the share of spending in Scotland would be expected to increase from 35% to 41%. The main driver of this increase is the assumption that the offshore export cables and inter-array cables could be manufactured in Scotland, and that a higher share of blade manufacturing could take place in the UK.
- On this basis, the total spend in Scotland could increase from £3.7 billion to £4.2 billion, supporting £2.8 billion GVA and 40,900 years of employment. In the UK spending could increase from £4.6 billion to £5.3 billion, supporting £5.5 billion GVA and 77,120 years of employment (Table 8.5).
Table 8.5: Economic Impact of Construction, Ambition Scenario (PDE Option 4)
Parameters | Scotland | UK |
|---|---|---|
Supply Chain Spending | £4,202 m | £5,306 m |
Total GVA | £2,825 m | £5,501 m |
Total Years of Employment | 40,900 | 77,120 |
- Under the ambition scenario it was assumed that there would be an incremental increase in the share of operation and maintenance contracts secured in Scotland and the UK.
- On this basis, it was estimated that the share of operation and maintenance contracts in Scotland could increase from £68 million to £75 million, supporting £47 million GVA and 540 jobs. In the UK, spending could increase from £207 million to £209 million, supporting £186 million GVA and 1,570 jobs (Table 8.6).
Table 8.6: Economic Impact of Operation and Maintenance, Ambition Scenario (PDE Option 4)
Parameters | Scotland | UK |
|---|---|---|
Supply Chain Spending | £75 m | £209 m |
Total GVA | £47 m | £186 m |
Total Jobs | 540 | 1,570 |
9. Summary
9. Summary
- This socio-economics technical report has outlined in detail the approach to the economic impact assessment that has been used to quantify the total expenditure and economic impact of the Array and Ossian across the construction, operation and maintenance and decommissioning phases, and identified the PDE Option with the least beneficial effects.
- On this basis, this technical report has identified PDE Option 4 as the least beneficial option and it has therefore been identified as the MDS for the purposes of the socio-economics EIA chapter (volume 2, chapter 18). This is expected to consist of up to 130 wind turbines with a generating capacity of up to 3.6 GW.
- It should be noted that the PDE Option identified within this technical report is considered the MDS for the purposes of the socio-economic assessment only and the final detailed design of the Array will depend upon factors such as available technology, supply chain capacity and cost.
9.1. Ossian Impact Summary (PDE Option 4)
9.1. Ossian Impact Summary (PDE Option 4)
- For Ossian as a whole (i.e. the Array, the Proposed offshore export cable(s) and the Proposed onshore transmission infrastructure), it was estimated, based on the SCDS commitment scenario and the technical expert’s modelling, that during the construction phase the total investment associated with PDE Option 4 could be £10.2 billion, supporting an impact of:
- £2.4 billion GVA and 35,920 years of employment in Scotland;
- £4.8 billion GVA and 67,980 years of employment in the UK; and
- 240 peak jobs at the main construction port(s).
- In addition, it was estimated, based on the SCDS commitment scenario and the technical expert’s modelling, that during each year of operation and maintenance the total expenditure associated with PDE Option 4 could be £227 million, supporting a total impact of:
- £44 million GVA and 500 jobs in Scotland;
- £183 million GVA and 1,510 jobs in the UK; and
- 70 jobs at the main operation and maintenance port(s).
- It was estimated, based on the technical expert’s modelling, that during the decommissioning phase, the total expenditure associated with PDE Option 4 could be £542 million, supporting a total impact of:
- £90 million GVA and 1,040 years of employment in Scotland; and
- £130 million GVA and 1,580 years of employment in the UK.
9.2. Array Impact Summary (PDE Option 4)
9.2. Array Impact Summary (PDE Option 4)
- For the Array, it was estimated, based on the SCDS commitment scenario and the technical expert’s modelling, that during the construction phase the total investment associated with PDE Option 4 could be £7.7 billion, supporting an impact of:
- £2.3 billion GVA and 33,500 years of employment in Scotland;
- £4.2 billion GVA and 60,310 years of employment in the UK; and
- 240 peak jobs at the main construction port(s).
- In addition, it was estimated, based on the SCDS commitment scenario and the technical expert’s modelling, that during each year of operation and maintenance the total expenditure associated with PDE Option 4 could be £227 million, supporting an Array impact of:
- £43 million GVA and 490 jobs in Scotland;
- £179 million GVA and 1,480 jobs in the UK; and
- 70 jobs at the main operation and maintenance port(s).
- It was estimated, based on the technical expert’s modelling, that during the decommissioning phase, the total expenditure associated with PDE Option 4 could be £174 million, supporting an Array impact of:
- £30 million GVA and 330 years of employment in Scotland; and
- £40 million GVA and 510 years of employment in the UK.
10. References
10. References
BVG Associates (2021). UK and Scottish content baseline and roadmap.
BVG Associates (2023). Guide to a Floating Offshore Wind Farm.
Electricity System Operator (2023). Final TNUoS Tariffs for 2023/24.
Marine Analytical Unit (2022). General Advice for Offshore Socio-economics Impact Assessment (SEIA).
ONS (2022). Supply and Use Tables 2019.
ONS (2023). Annual Business Survey 2020.
Ossian OWFL (2021). Scotwind Leasing Application SCDS Outlook: E1 East Floating Offshore Wind Farm. Available at https://www.crownestatescotland.com/sites/default/files/2023-07/scotwind-area-2-scds-outlook.pdf. Accessed on: 17 June 2024.
Scottish Government (2022a). Defining 'local area' for assessing impact of offshore renewables and other marine developments: guidance principles.
Scottish Government (2022b). Scottish Input Output Tables 2019.