

Appendix 10 Commercial Fisheries – Baseline Environment
10.1. Desktop Study
- An initial desk-based review of literature and data sources to support this Scoping Report has identified a number of baseline data sources ( Apx Table 10.1 Open ▸ ).
Apx Table 10.1: Summary of Key Desktop Datasets
10.2. Site-specific Survey Data
- In respect of commercial fisheries, no site-specific surveys have been undertaken to inform this Scoping Report. Nonetheless, extensive consultation with relevant stakeholders within the fisheries sector will be undertaken throughout the Environmental Impact Assessment (EIA) process, to help inform the commercial fisheries baseline further.
- However, the results from site-specific surveys from the epibenthic beam trawl surveys conducted as part of the benthic ecology baseline (Appendix 6) will be included to inform the commercial fisheries baseline, where relevant.
- Shipping and navigation Automatic Identification Systems (AIS) and Radar surveys have taken place in December 2022 and are planned to be undertaken in the summer of 2023. In addition, scouting surveys prior to the pre-construction geophysical surveys are likely to be conducted in 2023.
10.3. Baseline Characterisation
- The Array is situated within ICES division 4b: Central North Sea. Each ICES Division is divided up into statistical rectangles, allowing fisheries data to be presented on a finer scale. The Array is mainly situated within ICES rectangle 42E9 with small corners overlapping with 42F0 and 41E9. The Array overlaps with 25% of 42E9 (see section 7.1, Figure 7.1 Open ▸ ).
- Therefore, at this stage, the commercial fisheries baseline is mainly influenced by commercial fisheries data within ICES rectangle 42E9, presented here in terms of first sales value (£) and landed weight (tonnes).
- Stakeholder feedback from the Scottish White Fish Producers Association (SWFPA) received at the Commercial Fisheries Scoping Workshop on 15 November 2022 noted that 42E9 was historically a high intensity fishery for small haddock, however, it became uneconomical for fish for haddock within this area in the mid-2010s and as a result, fishing intensity in 42E9 has decreased in recent years. As a result of this feedback, commercial fisheries data are presented between 2011 to 2021, to provide a comprehensive baseline that spans multiple years of fisheries data, and to review historical data from the 42E9 area. The commercial fisheries baseline has been mainly characterised by publicly available Marine Management Organisation (MMO) data for ICES rectangle 42E9 (MMO, 2017; MMO, 2022). These MMO data presented in section 8.4.10.3.1 are for UK vessels only, however, Vessel Monitoring System (VMS) data from EU vessels (including the UK) between 2016 and 2020 has been analysed. These data are presented as average total fishing effort and average SARs for a range of gear types in Apx Figure 10.5 Open ▸ and Apx Figure 10.7 Open ▸ , respectively.
- Species of commercial importance recorded during site-specific surveys include queen scallop Aequipecten opercularis, plaice Pleuronectes platessa, lemon sole Microstomus kitt, long rough dab Hippoglossoides platessoides, common dab Limanda limanda, Norway pout Trisopterus esmarkii, and grey gurnard Eutrigla gurnardus (Appendix 6).
10.3.1 Fisheries Statistics
Fisheries data between 2011 and 2015
- The average annual landed weight average first sales value across the period of 2011 to 2015 was 777.8 tonnes and £809,399, respectively, with variation in the total landed weight and value across years ( Apx Table 10.2 Open ▸ ). For comparison, the weight and value of all ICES Rectangles within the UK EEZ are also shown in Apx Table 10.2 Open ▸ . Between 2011 and 2013, haddock Melanogrammus aeglefinus, contributed the highest landings weight and first sales value. In 2014, herring Clupea harengus dominated landed weight (262.8 tonnes at a value of £63,576), however, haddock continued to dominate first sales value, despite lower landed weight in comparison to herring (203.3 tonnes at a value of £273,483). In 2015, haddock, again, dominated both landed weight and first sales value (106.8 tonnes at a value of £148,629). Other key species caught across the period of 2011 to 2015 include scallops (Pectinidae), cod Gadus morhua, Nephrops Nephrops norvegicus, whiting Merlangius merlangus, squid (Loligo spp.), plaice, hake Merluccius merluccius, and monks/anglers. Apx Figure 10.1 Open ▸ shows the first sales value (£,000) for these species across the period of 2011 to 2015.
- For demersal species, haddock had highest annual average landings of 618.7 tonnes (£669,343), followed by whiting (26.4 tonnes = £27,642), and plaice (7.4 tonnes = £5,252). Scallops contributed the highest annual average landings of shellfish (13.0 tonnes = £24,573), followed by Nephrops (6.0 tonnes = £36,378), and squid (1.6 tonnes = £7,228).
- For pelagic species, herring had the highest annual average landings of 150.3 tonnes (£23,288), followed by mackerel Scomber scombrus (5.0 tonnes = £3,916). It should be noted, however, that herring was only landed within the years 2012 to 2014, whereas mackerel was landed each year across 2011 to 2015.
- The UK Sea Fisheries Statistics 2015 (MMO, 2017) note that the large majority of demersal and pelagic fish landed by UK vessels were caught using demersal trawls and seines, which encompasses otter, Nephrops, shrimp and pair trawls, and all demersal seines. Shellfish species were caught using dredges, as well as demersal trawls/seines, and pots and traps.
Apx Table 10.2: Summary of Key Fisheries Statistics for ICES Rectangle 42E9 and all ICES Rectangles in the UK EEZ between 2011 and 2015 (Source: MMO, 2017)
Apx Figure 10.1: First Sales Value (£,000) between 2011 to 2015 for Key Species in 42E9 (Source: MMO, 2017)
Fisheries data between 2016 and 2021
- The total landed weight and first sales value recorded each year varied between 2016 and 2021, with an average of 131.4 tonnes and value of £122,836 ( Apx Table 10.3 Open ▸ ). For comparison, the weight and value for all ICES Rectangles in the UK EEZ has also been included in Apx Table 10.3 Open ▸ . High landings of herring (399.5 tonnes at a value of £195,592) were recorded in 2016 only and not recorded at all in subsequent years. Due to this, landings of pelagic species were significantly higher than for demersal or shellfish species in 2016 (420.8 tonnes), however this dropped to 0.1 tonnes in 2018 and 2020, 1.1 tonnes in 2021, and no pelagic species recorded in 2017 and 2019. This is not surprising, as pelagic fisheries typically catch large quantities of fish (such as herring) in distinct locations which vary annually as a result of the species’ migration.
- Haddock contributed the highest proportion of landed weight and value for each year except 2016, where herring was dominating. Other key species throughout 2016 to 2021 include scallops, mackerel, Nephrops, squid, and mixed demersal species, including plaice, whiting, grey gurnard, dabs, monkfish/anglerfish, hake, and lemon sole. The first sales value (£,000) for these species is illustrated in Apx Figure 10.2 Open ▸ .
Apx Table 10.3: Summary of Key Fisheries Statistics for ICES Rectangle 42E9 and all ICES Rectangles in the UK EEZ between 2016 to 2021 (Source: MMO, 2022)
Apx Figure 10.2: First Sales Value (£,000) Between 2016 to 2021 for Key Species in 42E9 (Source: MMO, 2022)
- For demersal species, haddock had highest annual average landings of 40.1 tonnes (£45,631), followed by plaice (4.8 tonnes = £4,220), whiting (2.5 tonnes = £3,354), grey gurnards (1.8 tonnes = £900), monkfish/anglerfish (0.8 tonnes = £2,196), and dabs (4.8 tonnes = £4,126). Scallops contributed the highest annual average landings of shellfish (5.9 tonnes = £13,949), followed by Nephrops (2.6 tonnes = £11,062), brown crab Cancer pagurus (1.4 tonnes = £3,410), and squid (0.3 tonnes = £1,335).
- A seasonal trend was observed, with the highest landings recorded in between May to September, as illustrated in Apx Figure 10.3 Open ▸ . The peaks, albeit smaller, in November and December are representative of haddock catches. Similarly, the highest landing was recorded in June 2021 (37.3 tonnes = £43,233) and is predominantly comprised of haddock. The high landings of herring observed in August (255.1 tonnes = £126,997) and September 2016 (144.4 tonnes = £68,596) are not included in the figure to allow the significantly lower landings of all other species to be visualised.
- Five different gear types were recorded: otter trawls, demersal seine, demersal trawls, dredges, and pots and traps. Between 2016 to 2021, otter trawls targeted herring, haddock, mackerel, Nephrops and other mixed demersal species, while demersal seines mainly targeted haddock and lower volumes of mixed demersal species. Demersal trawls predominantly targeting haddock and Nephrops were reported in 2021 only. Dredges targeted scallops exclusively and in 2021 only, there were low landings of brown crab (1.4 tonnes = £3,410) reported for pots and traps.
Apx Figure 10.3: Summary of Landed Weight (tonnes) per Month in 42E9 Between 2016 to 2021 (Excluding Herring; Source: MMO, 2022)
Summary of fisheries data between 2011 and 2021
- As noted above, haddock has contributed the highest proportion of landed weight and value for each year across the period of 2011 to 2021, apart from 2014 and 2016, where herring dominated. Herring dominated landed weight only in 2014 and both landed weight and value in 2016. Across the whole period of 2011 to 2021, demersal species dominated landed weight and value, using otter trawls, demersal seine and demersal trawls, followed by shellfish species using mainly dredges as well as pots and traps.
- Apx Table 10.4 Open ▸ shows the percentage contribution of haddock to the total landed weight and first sales value for each year between 2011 and 2021. Haddock has continued to make a large contribution to landed weight and value (apart from 2014 and 2016), however, it is apparent that the percentage contribution of haddock to total landed weight and value year-on-year has declined since 2014. This is also apparent in Apx Figure 10.1 Open ▸ and Apx Figure 10.2 Open ▸ which show the decline in first sales value (£,000) of haddock across the period of 2011 to 2015 and 2016 to 2021, indicating the long term decline in economic viability of this species. This is likely to be related to trends in Total Allowable Catches (TACs) for this species.
- This corroborates feedback provided by the SWFPA, which identified the area as being more important historically, particularly for catches of ‘small’ haddock. It should be noted that the economic viability of ICES Rectangle 42E9 for haddock could increase in future, for example, in the instance that the spawning stock biomass of haddock increases in abundance, leading to an associated TAC increase.
Apx Table 10.4: Contribution of Haddock to Total Landed Weight and Total First Sales Value for ICES Rectangle 42E9 Between 2011 and 2021
10.3.2 Fishing Vessel Presence and Fishing Intensity
- The total fishing effort within ICES Rectangle 42E9 is low in comparison with other areas of the North Sea, which highlights the comparatively low levels of fishing activity withing 42E9. As illustrated in Apx Figure 10.4 Open ▸ , fishing effort of UK vessels (>15 m) is minimal within the area of the commercial fisheries study area that overlaps with the site boundary, with considerably higher effort reported for ICES Rectangle 42F0, and areas nearer the coast and to the north. Similarly, the average total fishing effort of vessels (>12 m) from 13 EU countries (including the UK) within the site boundary was low in comparison to the elsewhere in the North Sea ( Apx Figure 10.5 Open ▸ ). These 13 countries are: Belgium, Denmark, Estonia, France, Germany, Latvia, Lithuania, The Netherlands, Poland, Republic of Ireland, Spain, Sweden, and the UK.
Apx Figure 10.4: Total Fishing Effort of UK Vessels (>15 m) in 2020 (kW/h) (Source: Marine Scotland, 2021)
Apx Figure 10.5: Average Total Fishing Effort for EU Vessels (Including UK) (>12 m) between from 2016 to 2020 (kW/h) (Source: ICES, 2021)
- As illustrated in section 10.3.1 above, commercial fishing activity is relatively low within ICES rectangle 42E9 and has decreased on average between 2011 to 2021. Similarly, the density of commercial fishing vessel traffic through the commercial fisheries study area in 2021 was low compared to other areas, as illustrated in Apx Figure 10.6.
- Finally, VMS data on the average SAR for a range of gear types on EU vessels (including the UK) (>12 m) has been assessed. Average SARs between 2016 and 2020 for four gear types is low within the site boundary, in comparison to other areas of the North Sea ( Apx Figure 10.7 Open ▸ ). These gear types are demersal otter trawls (targeting Nephrops, whitefish (e.g. gadoids), and flatfish), dredges, beam trawls, and demersal seines. These VMS data are from 13 countries, which are listed in paragraph 279. Additional non-UK fisheries data has been requested and consultation with other jurisdictions will be undertaken and presented in the Array EIA Report. This includes fisheries data requested from Norwegian vessels and obtained from the EU Data Collection Framework (DCF) database, which was unavailable at the time of writing.
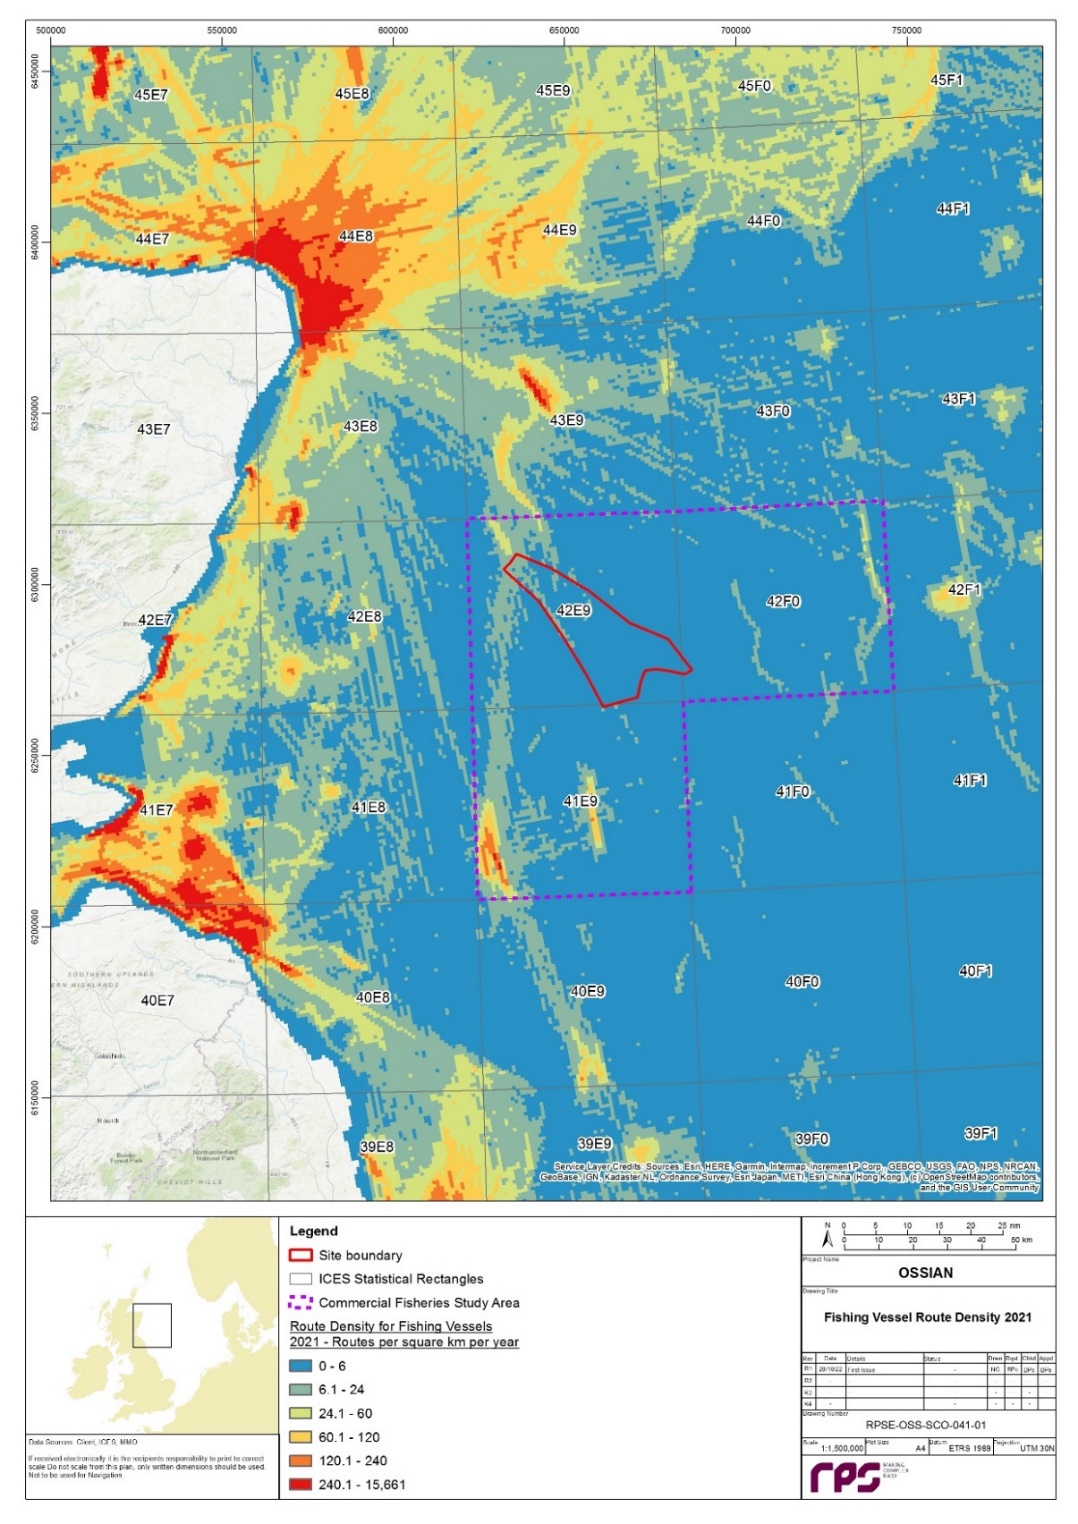
Apx Figure 10.6: Density of Fishing Vessel Routes Within the Commercial Fisheries Study Area in 2021 (Source: EMODnet, 2022)
Apx Figure 10.7: Average SAR for EU Vessels (including UK) (>12 m) Between 2016 to 2020 in the Vicinity of the Commercial Fisheries Study Area (Source: ICES, 2021)