8 Meteorological Ocean Data
- This section presents meteorological and oceanographic statistics local to the site boundary. The data presented in this section is used as input to the collision and allision risk modelling (see section 14).
8.1 Wind Direction Probabilities
- The distribution of wind direction is presented in Figure 8.1, in the form of a wind rose. The associated data was collected from metocean buoys deployed on site between August 2022 and August 2023.
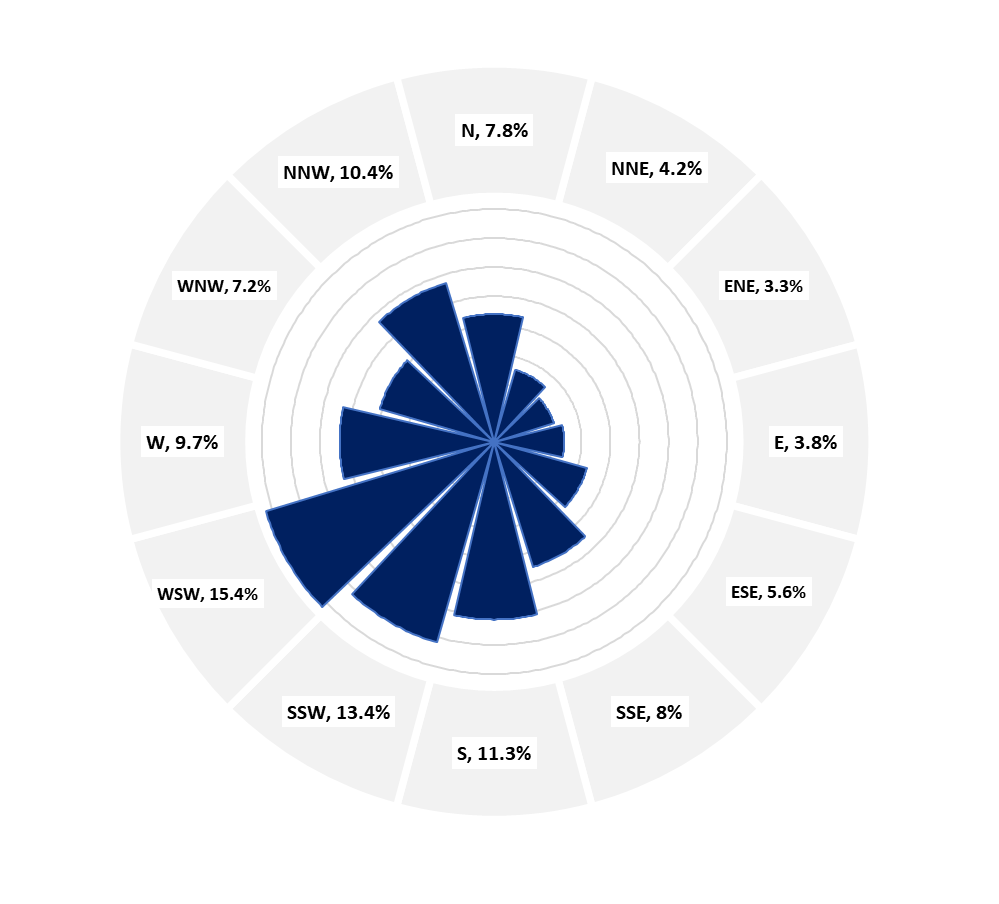
Figure 8.1: Wind Direction Distribution in Proximity to the Site Boundary
- It can be seen that the predominant wind directions at the site boundary are broadly from the south-west.
8.2 Significant Wave Height
- The significant wave height proportions are derived from the site-specific hindcast dataset, validated on regional level. The associated data was collected from metocean buoys deployed on site between August 2022 and August 2023. The data is selected from the part of the Array with most onerous wave conditions. Table 8.1 presents the proportion of the sea state within each of three defined ranges.
Sea State | Proportion (%) |
|---|---|
Calm (< 1 m) | 18.98% |
Moderate (1–5 m) | 79.42% |
Severe (> 5 m) | 1.60% |
8.3 Visibility
- The annual average incidence of poor visibility in the general region (defined as the proportion of a year where the visibility can be expected to be less than 1 km) is 3% (UKHO, 2021).
8.4 Tidal
- The tidal information is derived from a site-specific hydrodynamic hindcast dataset, where the model was driven by tidal and meteorological forcing. The tidal current speeds and directions were derived using harmonic analysis of the total current speeds and subsequent prediction for 20 years to cover full nodal period. Note that the provided current speeds are depth-average values. The current speeds were derived from the region of the Array with the strongest current speeds at the north of the site boundary.
- Table 8.2 presents the peak flood and ebb direction and speed values. The directions broadly align with the admiralty charts while the speeds are greater and therefore more conservative.
Table 8.2: Peak Flood and Ebb Speed and Direction Data (Assumed for Array)
Tidal Current Point Coordinates | Flood | Ebb | ||
|---|---|---|---|---|
Direction (°) | Speed (knots) | Direction (°) | Speed (knots) | |
56° 53' 60.0" N, 000° 45' 57.6" W | 11 | 1.30 | 193 | 1.36 |
- Based upon the available data, no impacts are expected at high water that would not also be expected at low water, and vice versa. The infrastructure associated with the Array are not expected to have any additional impact on the existing tidal streams in relation to their effect on existing shipping and navigation users.