10 Vessel Traffic Movements
- This section presents an overview of vessel traffic movements within the shipping and navigation study area, primarily based upon the findings of the winter and summer vessel traffic surveys undertaken in December 2022 and July 2023, respectively (see section 5.2). All vessels were recorded on AIS during the winter period and all vessels during the summer period were recorded on AIS except for one (which was recorded on Radar).
10.1 Overview
- A plot of the vessel tracks recorded during the 14-day winter survey period within the shipping and navigation study area, colour-coded by vessel type, is presented in Figure 10.1. Following this, Figure 10.2 presents the same data converted to a density heat map. All vessels were of a known type.
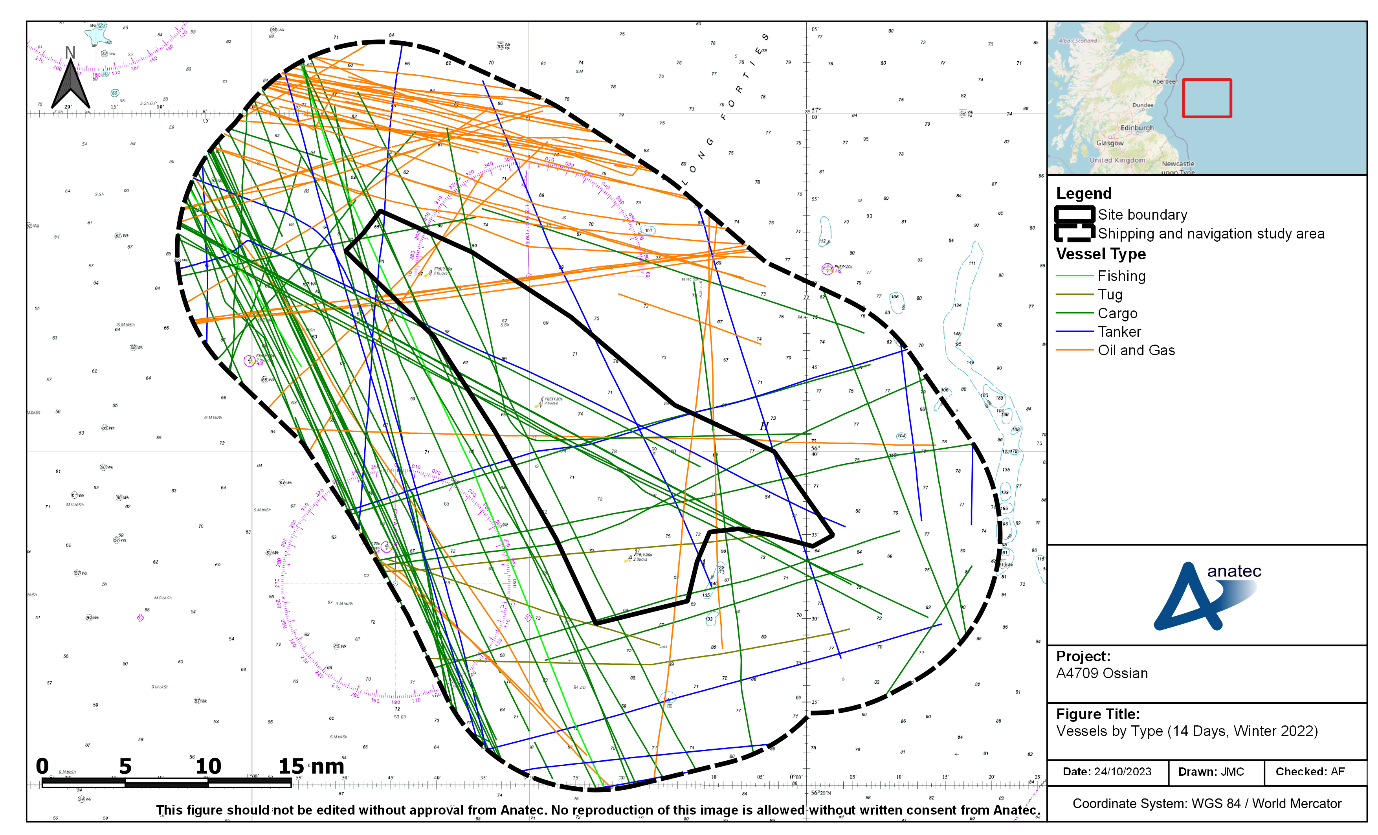
Figure 10.1: Vessels by Type Recorded During the Winter Vessel Traffic Survey (14 Days; December 2022)
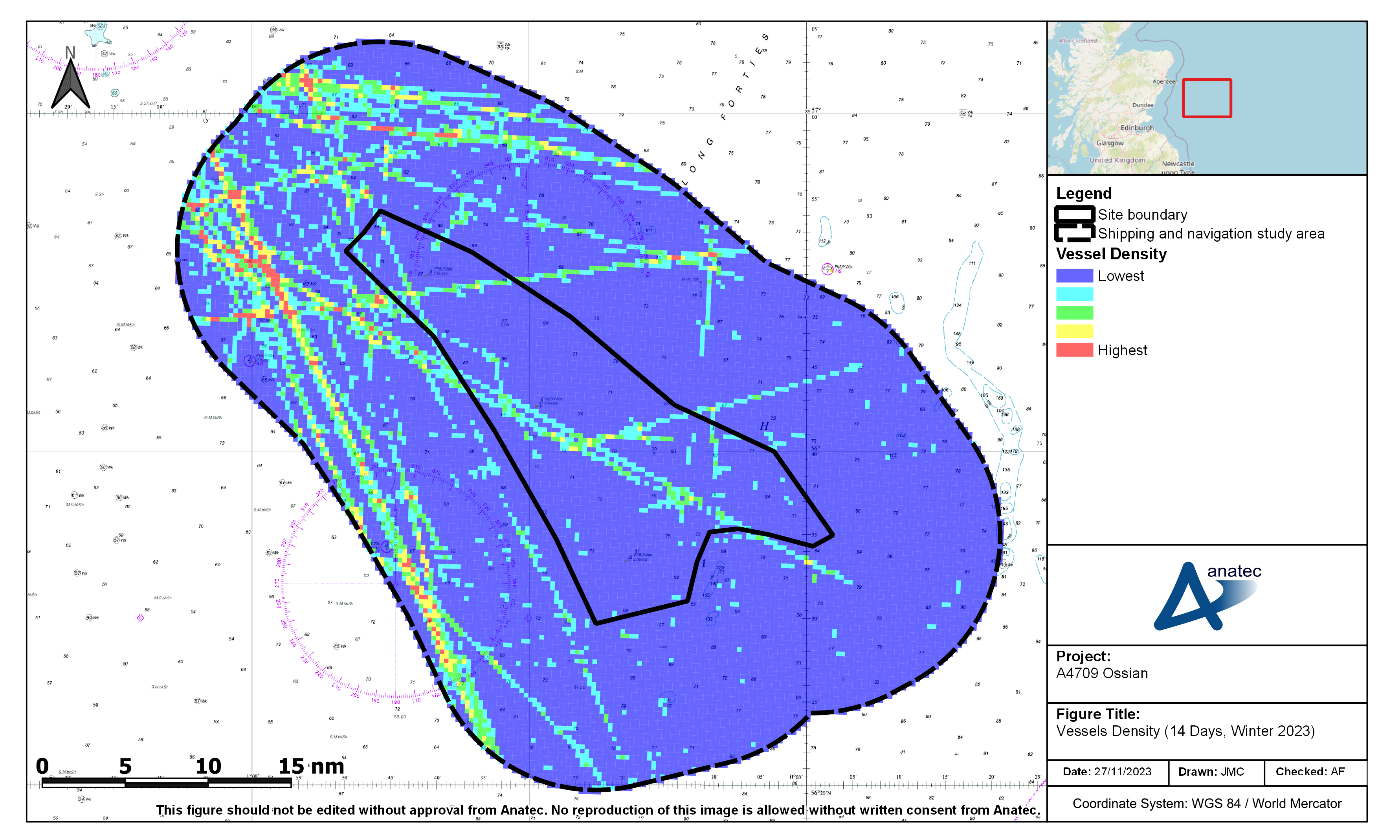
Figure 10.2: Density of Vessels Recorded During the Winter Vessel Traffic Survey (14 Days; December 2022)
- A plot of the vessel tracks recorded during the 14-day summer survey period within the shipping and navigation study area, colour-coded by vessel type, is presented in Figure 10.3. Following this, Figure 10.4: presents the same data converted to a density heat map. All vessels were of a known type, except for a single vessel which was recorded via Radar (the only non-AIS vessel).
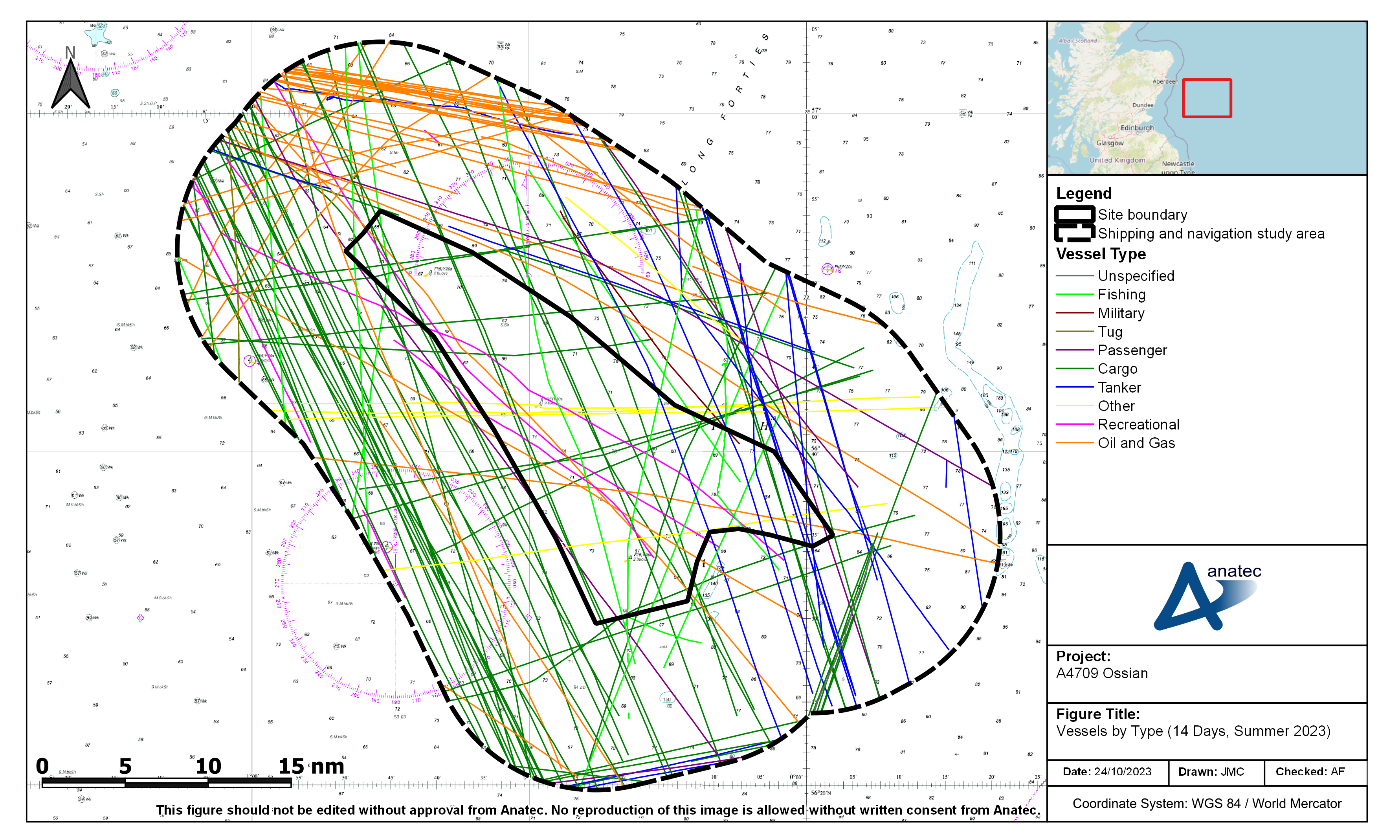
Figure 10.3: Vessels by Type Recorded During the Summer Vessel Traffic Survey (14 Days; July 2023)
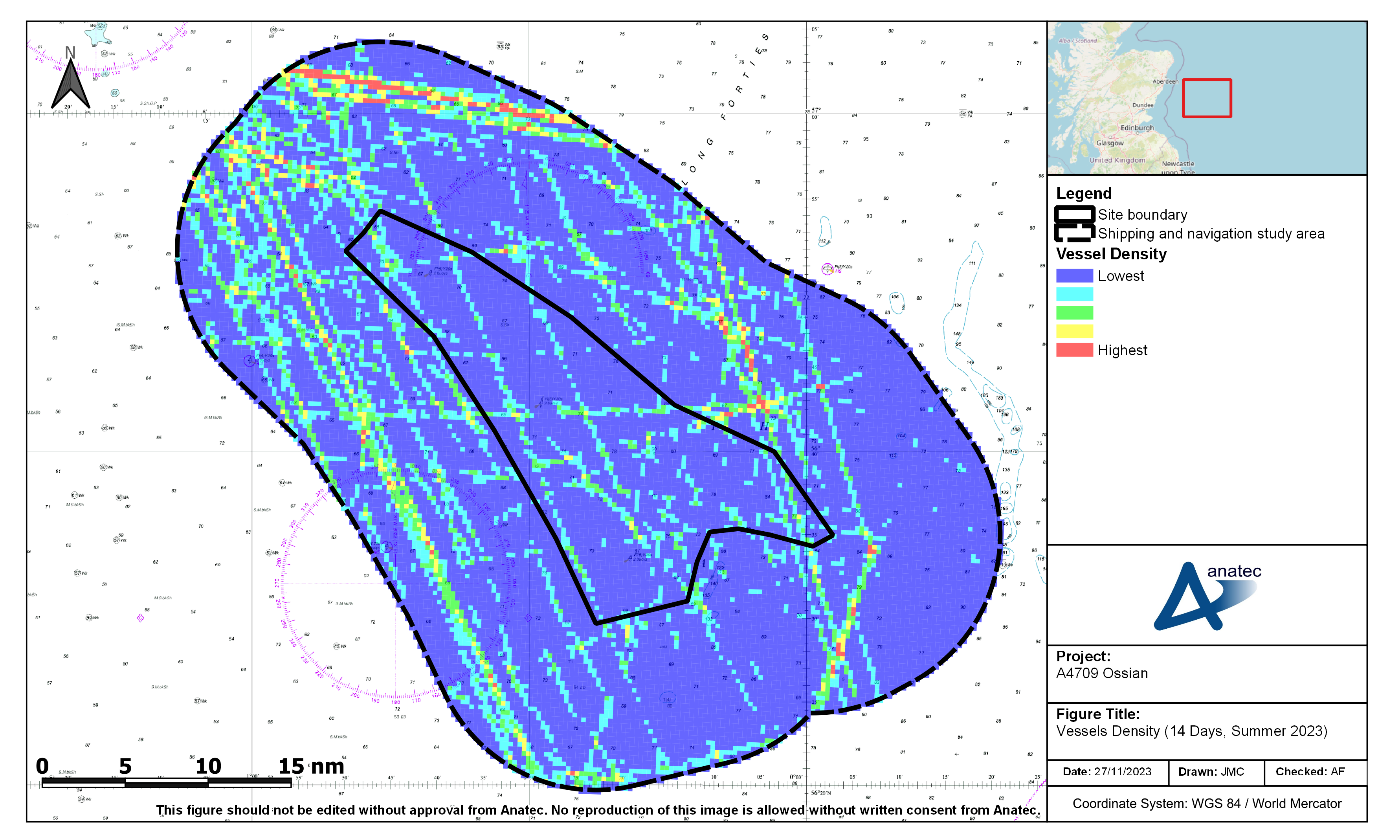
Figure 10.4: Density of Vessels Recorded During the Summer Vessel Traffic Survey (14 Days; July 2023)
10.2 Vessel Counts
10.2.1 Winter
- Figure 10.5 illustrates the daily number of unique vessels recorded within the shipping and navigation study area, as well as intersecting the site boundary, during the winter vessel traffic survey period.
Figure 10.5: Number of Vessels per Day Recorded During the Winter Vessel Traffic Survey (14 Days; December 2022)
- During the winter vessel traffic survey period, there was an average of nine unique vessels per day recorded within the shipping and navigation study area, with two to three per day within the site boundary.
- The busiest full days within the shipping and navigation study area were the 10 December 2022, 12 December 2022, 16 December 2022, and 17 December 2022; on each of these days, 12 unique vessels were recorded. The quietest full day within the shipping and navigation study area was 15 December 2022, on which five unique vessels were recorded.
- The busiest full day within the site boundary was the 16 December 2022, on which eight unique vessels were recorded. The quietest full days within the site boundary were the 08 December 2022, 15 December 2022, 18 December 2022, and 19 December 2022; on each of these days, a single unique vessel was recorded.
10.2.2 Summer
- Figure 10.6 illustrates the daily number of unique vessels recorded within the shipping and navigation study area, as well as intersecting the site boundary, during the summer vessel traffic survey period.
Figure 10.6: Number of Vessels per Day Recorded During the Summer Vessel Traffic Survey (14 Days; July 2023)
- During the summer vessel traffic survey period, there was an average of 11 unique vessels per day recorded within the shipping and navigation study area, with three to four per day within the site boundary.
- The busiest full day within the shipping and navigation study area was the 15 July 2023, on which 16 unique vessels were recorded. The quietest full days within the shipping and navigation study area were the 16 July 2023 and 17 July 2023; on each of these days, eight unique vessels were recorded.
- The busiest full day within the site boundary was the 05 July 2023, on which seven unique vessels were recorded. The quietest full day within the site boundary was the 17 July 2023, on which no vessels were recorded.