10.3.5 Recreational Vessels
- Figure 10.13 presents the recreational recorded within the shipping and navigation study area during the combined 28-day survey period.
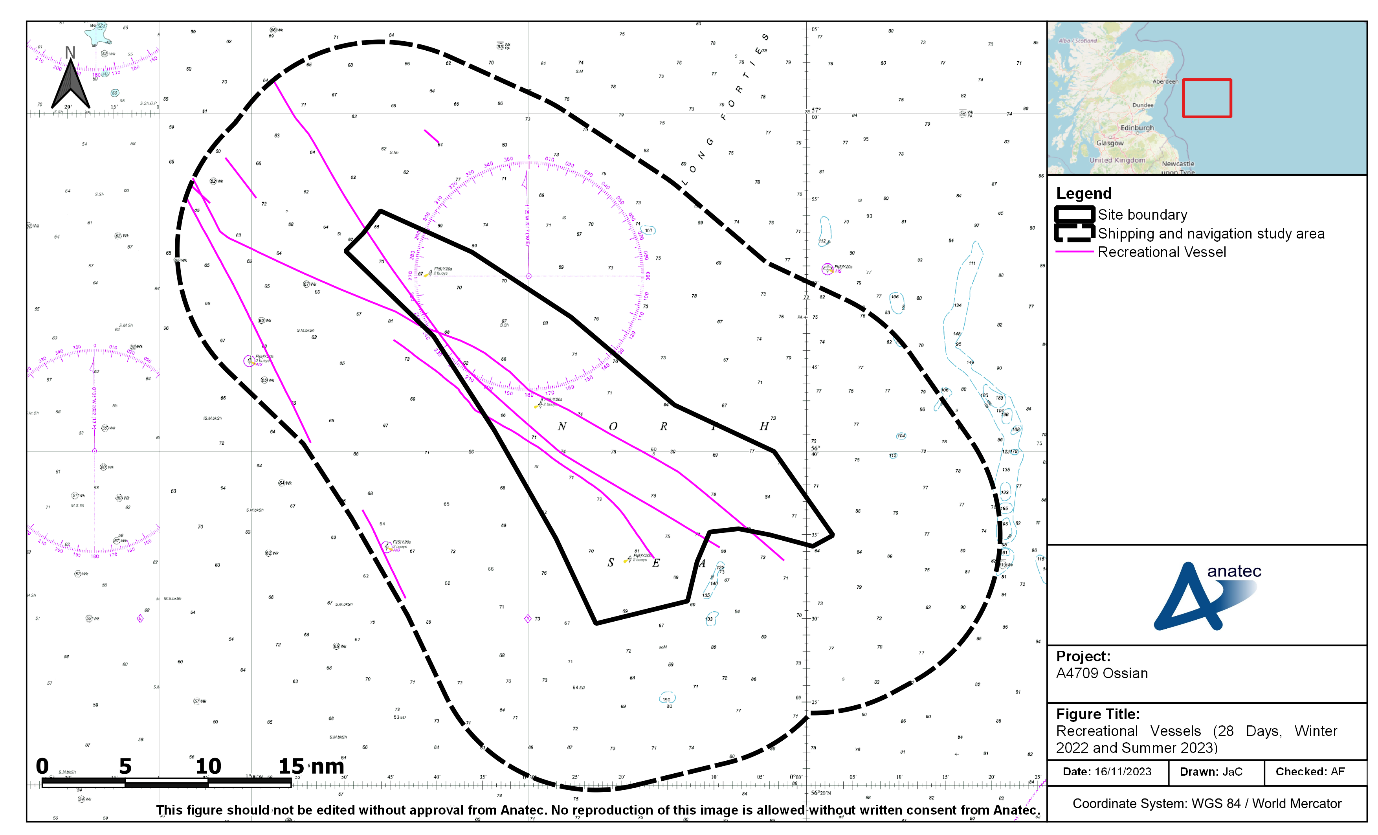
Figure 10.13: Recreational Vessels Recorded During the Combined 28-Day Vessel Traffic Survey Period (Winter 2022 and Summer 2023)
- Recreational vessels were generally recorded in north-west/south-east transit within the shipping and navigation study area.
- There were minimal levels of recreational vessels recorded, and all recreational vessels were recorded during the summer period, which aligns with input received during consultation (section 4). Also noted during consultation was that some recreational vessels transit across the North Sea to Denmark, Norway and Sweden; however, it was also noted that recreational vessels do not necessarily follow direct routes and their path can depend on wind direction.
- An average of one recreational vessel every three to four days was recorded within the shipping and navigation study area during the combined 28-day period. A total of three intersections through the site boundary was recorded, corresponding to an average of one intersection every nine to ten days.
10.3.5.1.1 Royal Yachting Association Coastal Atlas
- The RYA Coastal Atlas may be used to “help identify and protect areas of importance to recreational boaters, to advise on new development proposals and in discussions over navigational safety” (RYA, 2019). The RYA Coastal Atlas includes a heat map indicating the density of recreational activity around the UK coast. Findings of a review of this heat map aligns with both the vessel traffic survey data and consultation input in that it shows very limited recreational traffic within the shipping and navigation study area (only one cell of the heat map within the shipping and navigation study area registered a density).
10.4 Anchored Vessels
- Vessels broadcast their navigation status including whether at anchor via AIS; no vessels were broadcasting ‘At Anchor’ as their navigation status within the shipping and navigation study area during the combined 28-day survey period. As an additional step, AIS tracks from vessels which transmitted a navigation status other than ‘At Anchor’ were used as input to Anatec’s Speed Analysis model. The program detects any tracks of vessels that were travelling with speeds of less than one knot for a minimum of 30 minutes. These tracks were then manually reviewed and none displayed anchoring behaviour. This is as would be expected given the distance offshore and the water depths.
10.5 Vessel Size
10.5.1 Vessel Length
- Figure 10.14 presents the vessels recorded within the shipping and navigation study area during the combined 28-day survey period, colour-coded by vessel length. Vessel length was available for over 99% of vessels recorded.
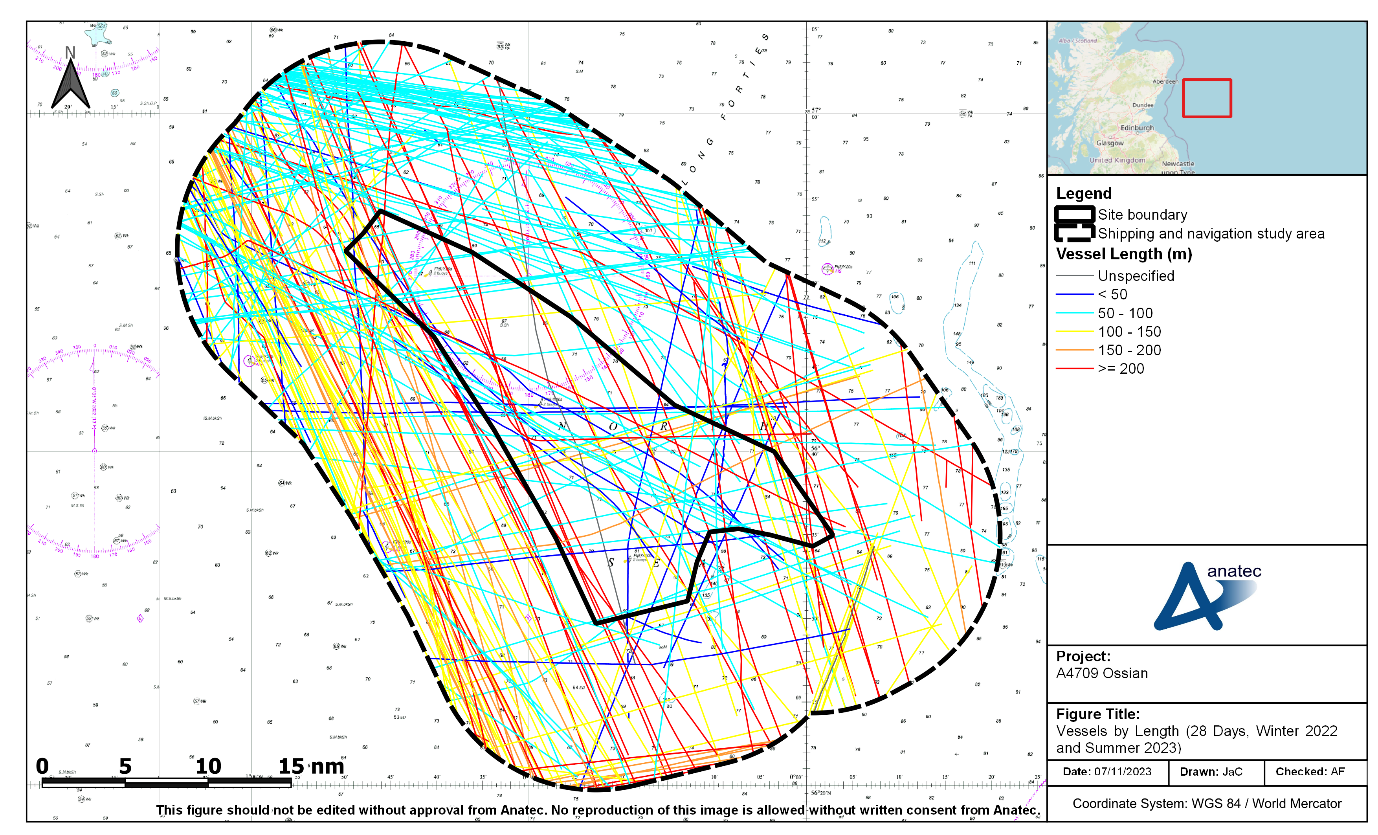
Figure 10.14: Length of Vessels Recorded During the Combined 28-Day Vessel Traffic Survey Period (Winter 2022 and Summer 2023)
- A broad range of vessel lengths was recorded throughout the shipping and navigation study area. Vessels between 50 m and 100 m in length were generally oil and gas vessels in south-east/north-west transit to the north of the site boundary. Vessels between 100 m and 200 m were generally cargo vessels in south-east/north-west transit inshore of the site boundary. The largest vessels (at least 200 m) were generally commercial vessels engaged in south-east/north-west transit throughout the shipping and navigation study area.
- Figure 10.15 presents the distributions of vessel lengths recorded within the shipping and navigation study area during each survey period (excluding less than 1% unspecified).
Figure 10.15: Distribution of Vessel Lengths Recorded During the Combined 28-Day Vessel Traffic Survey Period (Winter 2022 and Summer 2023)
- The most common range of vessel lengths during both survey periods was 50 m to 100 m, accounting for 58% and 38% of the data during the winter period and summer period respectively. The average vessel length was similar during each period; 120 m during the winter and 117 m during the summer. The maximum vessel lengths recorded were 296 m and 306 m during the winter and summer periods, respectively.
10.5.2 Vessel Draught
- Figure 10.16 presents the vessels recorded within the shipping and navigation study area during the combined 28-day survey period, colour-coded by vessel draught. Vessel draught was available for approximately 92% of vessel tracks recorded.
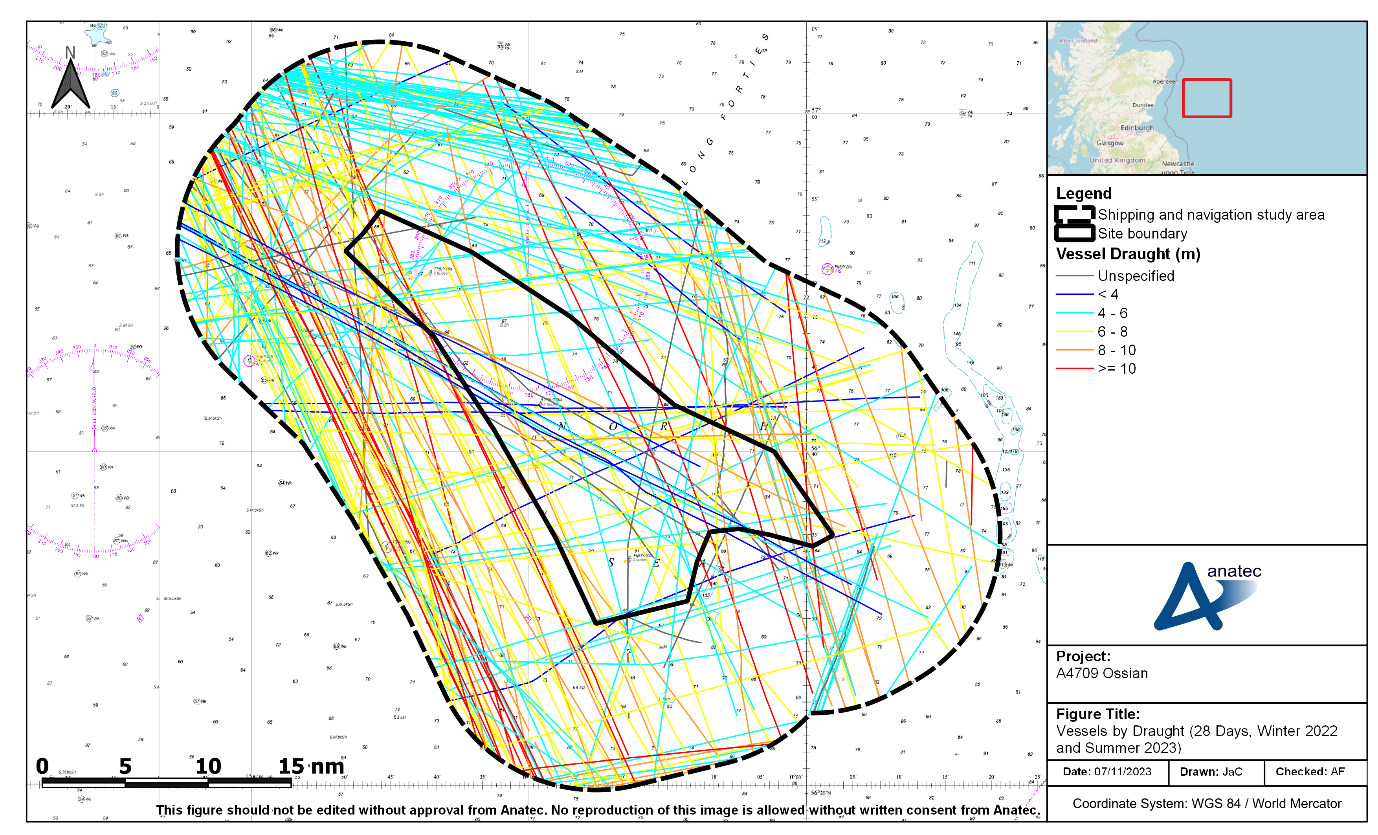
Figure 10.16: Draught of Vessels Recorded During the Combined 28-Day Vessel Traffic Survey Period (Winter 2022 and Summer 2023)
- Similar to vessel lengths, a broad range of draughts were recorded throughout the shipping and navigation study area. Shallower draughts (less than 6 m) were generally in east-south-east/west-north-west transit (to the north of the site boundary in particular) while deeper draughts (at least 6 m) were generally in south-south-east/north-north-west (inshore of the site boundary in particular).
- Figure 10.17 presents the distributions of vessel draughts recorded within the shipping and navigation study area during each survey period (excluding approximately 8% unspecified).
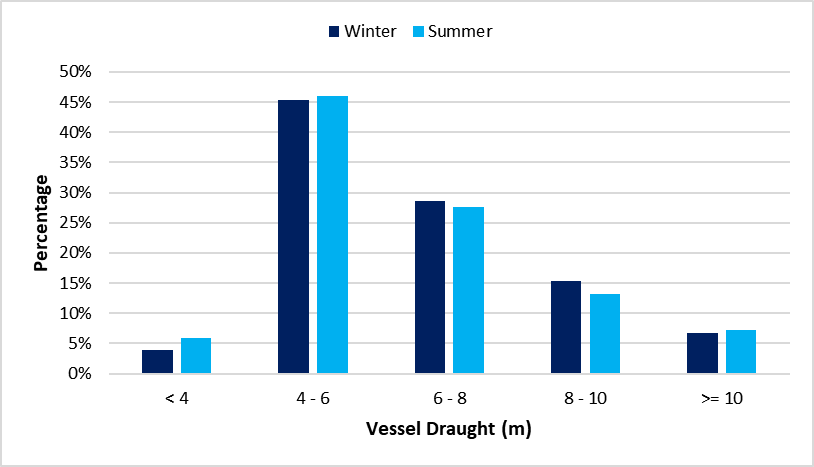
Figure 10.17: Distribution of Vessel Draughts Recorded During the Combined 28-Day Vessel Traffic Survey Period (Winter 2022 and Summer 2023)
- There was broad correlation between each survey period in terms of vessel draughts. The most common draught range was 4 m to 6 m, accounting for 45% and 46% during the winter and summer periods, respectively. The average vessel draught of all vessels recorded during both survey periods was 6.5 m. The deepest vessel draughts recorded were 16.3 m and 14.2 m during the winter and summer survey periods, respectively.
- Additional analysis of vessel draughts, including a breakdown of vessel draughts by vessel type, can be found in section 15.6.