15.4.5 Fishing Vessel to Structure Allision
- Anatec’s COLLRISK model was run to estimate the likelihood of a fishing vessel alliding with one of the wind farm structures within the site boundary, with the vessel traffic data studied used as input[8].
- A fishing vessel allision is classified separately from other allisions since, unlike in the case of the commercial traffic characterised using the main commercial routes, fishing vessels may be either in transit or actively fishing within the shipping and navigation study area. Moreover, fishing vessels could be observed internally within the site boundary in addition to externally. Anatec’s COLLRISK model uses vessel numbers, sizes (length and beam), array layout and structure dimensions. The likelihood of a major allision incident has been calibrated against historical maritime incident data and historical AIS vessel traffic data within operational offshore wind farm arrays.
- It should be noted that the fishing vessel allision model is extremely conservative. It assumes that the volume and geographic distribution of fishing vessels will not change after installation of all Array structures while, as was noted during consultation (see section 4), it is considered likely that a notable proportion of fishing vessels will avoid the site boundary. In particular, it is considered that active fishing is unlikely to occur within the site boundary, with any fishing vessels choosing to pass through doing so for transit purposes only.
- A plot of the annual fishing vessel allision frequency per structure for the base case is presented in Figure 15.7.
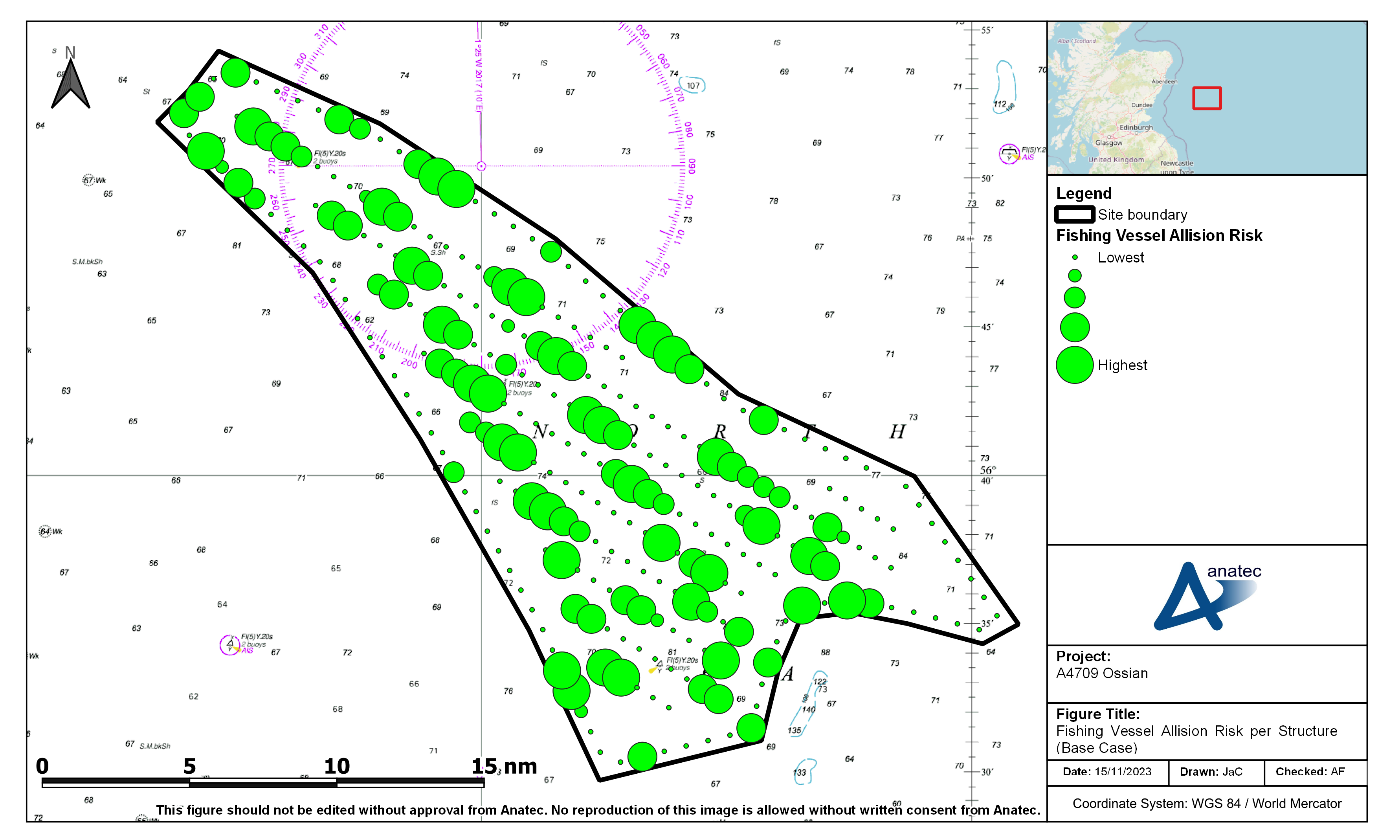
Figure 15.7: Fishing Vessel Allision Risk per Structure (Base Case)
- Assuming base case vessel traffic levels, the annual fishing vessel to structure allision frequency was estimated to be 4.08×10⁻², corresponding to one allision every 24 years.
- The structure with the greatest allision risk was in the central region of the site boundary and had an allision risk of 1.07×10⁻³, corresponding to one allision in 933 years.
15.5 Risk Results Summary
- The previous sections modelled two scenarios, namely the pre and post wind farm scenarios with base case traffic levels. In order to incorporate the potential for future traffic growth, these scenarios have also each been modelled with two future case traffic levels. Table 15.1 summarises the results of all six scenarios.
Table 15.1: Risk Results Summary
Risk | Scenario | Annual Frequency | ||
|---|---|---|---|---|
Pre Wind Farm | Post Wind Farm | Increase | ||
Vessel to vessel collision | Base case | 4.14×10⁻⁴ (1 in 2,418 years) | 5.42×10⁻⁴ (1 in 1,845 years) | 1.28×10⁻⁴ |
Future case (10%) | 5.45×10⁻⁴ (1 in 1,835 years) | 7.28×10⁻⁴ (1 in 1,374 years) | 1.83×10⁻⁴ | |
Future case (20%) | 6.33×10⁻⁴ (1 in 1,580 years) | 8.41×10⁻⁴ (1 in 1,188 years) | 2.09×10⁻⁴ | |
Powered vessel to structure allision | Base case | - | 6.91×10⁻³ (1 in 145 years) | - |
Future case (10%) | - | 7.60×10⁻³ (1 in 132 years) | - | |
Future case (20%) | - | 8.29×10⁻³ (1 in 121 years) | - | |
Drifting vessel to structure allision | Base case | - | 2.16×10⁻⁴ (1 in 4,619 years) | - |
Future case (10%) | - | 2.38×10⁻⁴ (1 in 4,199 years) | - | |
Future case (20%) | - | 2.60×10⁻⁴ (1 in 3,849 years) | - | |
Fishing vessel to structure allision | Base case | - | 4.08×10⁻² (1 in 24 years) | - |
Future case (10%) | - | 4.49×10⁻² (1 in 22 years) | - | |
Future case (20%) | - | 4.90×10⁻² (1 in 20 years) | - | |
Total | Base case | 4.14×10⁻⁴ (1 in 2,418 years) | 4.85×10⁻² (1 in 21 years) | 4.81×10⁻² |
Future case (10%) | 5.45×10⁻⁴ (1 in 1,835 years) | 5.35×10⁻² (1 in 19 years) | 5.30×10⁻² | |
Future case (20%) | 6.33×10⁻⁴ (1 in 1,580 years) | 5.84×10⁻² (1 in 17 years) | 5.78×10⁻² | |