20.5 Risk Statement
- Using the baseline data, expert opinion, outputs of the Hazard Workshop, stakeholder concerns, and lessons learnt from existing offshore developments, various shipping and navigation hazards have been risk assessed in line with the FSA approach. The full Risk Control Log, including details of hazards, proposed embedded mitigation measures and significance of risk, is presented in section 18.
- All hazards on both an in isolation and cumulative basis are at most tolerable with mitigation.
21 References
4C Offshore (2018). Wind farm support vessel to the rescue. Lowestoft: 4C Offshore. Available at: https://www.4coffshore.com/news/wind-farm-support-vessel-to-the-rescue-nid8059.html. Accessed on: 01 November 2023.
4C Offshore (2020). Offshore wind vessel joins search for missing pilot. Lowestoft: 4C Offshore. Available at: https://www.4coffshore.com/news/offshore-wind-vessel-joins-search-for-missing-pilot-nid17573.html. Accessed on: 01 November 2023.
Anatec and TCE (2012). Strategic Assessment of Impacts on Navigation of Shipping and Related Effects on Other Marine Activities Arising from the Development of Offshore Wind Farms in the UK REZ. Aberdeen: Anatec.
Anatec (2016). Influence of UK Offshore Wind Farm Installation on Commercial Vessel Navigation: A Review of Evidence. Aberdeen: Anatec.
Anatec (2018). Seagreen Navigational Risk Assessment Addendum. Aberdeen Anatec.
Anatec (2023). Regional Routeing Assessment. Appendix A of A4709-OSS-LTA-01. Aberdeen: Anatec.
Anatec (2023). ShipRoutes Database. Aberdeen: Anatec.
Atlantic Array (2012). Atlantic Array Offshore Wind Farm Draft Environmental Statement Annex 18.3: Noise and Vibration (Anthropogenic Receptors): Predictions of Operational Wind Turbine Noise Affecting Fishing Vessel Crews. Swindon: RWE npower renewables.
BBC (2018). Two rescued from sinking fishing boat in North Sea. London: BBC. Available at: https://www.bbc.co.uk/news/uk-england-norfolk-46101032 . Accessed on: 01 November 2023.
Bristow Group (2022). Bristow Awarded Second-Generation Search and Rescue Aviation Contract by the Maritime and Coastguard Agency. Houston, US. Available at: https://www.bristowgroup.com/news-media/press-releases/detail/511/bristow-awarded-second-generation-search-and-rescue Accessed on: 01 November 2023.
BWEA (2007). Investigation of Technical and Operational Effects on Marine Radar Close to Kentish Flats Offshore Wind Farm. London, UK: BWEA (now RenewableUK), BEIS, MCA and PLA.
CHIRP (2023). Confidential Human Factors Incident Reporting Programme. Available at: https://chirp.co.uk/. Accessed on: 13 December 2023.
DfT (2001). Identification of Marine Environmental High Risk Areas (MEHRAs) in the UK. London: DfT.
Edinburgh Evening News (2021). Mum's horrific inflatable ordeal at East Lothian beach as dinghy is swept out to sea. Edinburgh: Edinburgh Evening News. Available at: https://www.edinburghnews.scotsman.com/lifestyle/family-and-parenting/mums-horrific-inflatable-ordeal-at-east-lothian-beach-as-dinghy-is-swept-out-to-sea-3331559. Accessed on: 01 November 2023.
Energinet (2014). Horns Rev 3 Offshore Wind Farm Technical Report no. 12 – Radio Communication and Radars. Fredericia, Denmark: Energinet.
G+ (2021). G+ Global Offshore Wind Health and Safety Organisation 2020 Incident Data Report. London: Energy Institute.
IALA (2021a). IALA Recommendation O-139 on The Marking of Man-Made Offshore Structures. Edition 2. Saint Germain en Laye, France: IALA.
IALA (2021b). IALA Guidance G1162 on The Marking of Man-Made Offshore Structures. Saint Germain en Laye, France: IALA.
IMO (1972/77). Convention on International Regulations for Preventing Collisions at Sea (COLREGs) – Annex 3. London: IMO.
IMO (2001). Maritime Safety Committee, 74th Session, Agenda Item 5 – Bulk Carrier Safety: Formal Safety Assessment of Life Saving Appliance for Bulk Carriers. London: IMO.
IMO (2018). Revised Guidelines for Formal Safety Assessment (FSA) for Use in the Rule-Making Process. MSC-MEPCC.2/Circ.12/Rev.2. London: IMO.
ITOPF (2023). ITOPF Worldwide Database of Accidental Oil Spills from Tankers, Combined Carriers and Barges.
MAIB (2013). Casualty Definitions Used by the UK MAIB – From 2012. London: MAIB.
Marine Safety Forum (2020). Safety Alert No 20-01. Available at: msf-safety-alert-20.01.pdf (marinesafetyforum.org). Accessed on: 14 December 2023.
MCA and HSE (2017). Regulatory Expectations on Moorings for Floating Wind And Marine Devices. Amendment 2. Southampton: MCA
MCA and QinetiQ (2004). Results of the Electromagnetic Investigations. 2nd Edition. Southampton, UK: MCA and QinetiQ.
MCA (2005). Offshore Wind Farm Helicopter Search and Rescue Trials Undertaken at the North Hoyle Wind Farm. Southampton: MCA.
MCA (2008a). Marine Guidance Note 371 (Merchant and Fishing) Offshore Renewable Energy Installations (OREIs): Guidance on UK Navigational Practice, Safety and Emergency Response Issues. Southampton: MCA.
MCA (2008b). Marine Guidance Note 372 (Merchant and Fishing) Offshore Renewable Energy Installations (OREIs): Guidance to Mariners Operating in the Vicinity of UK OREIs. Southampton: MCA.
MCA (2016). MGN 543 (Merchant and Fishing) Safety of Navigation: Offshore Renewable Energy Installations (OREIs) – Guidance on UK Navigational Practice, Safety and Emergency Response. Southampton, UK: MCA.
MCA (2021). Marine Guidance Note 654 (Merchant and Fishing) Safety of Navigation: Offshore Renewable Energy Installations (OREIs) – Guidance on UK Navigational Practice, Safety and Emergency Response. Southampton: MCA.
MCA (2022). Marine Guidance Note 372 Amendment 1 (Merchant and Fishing) Offshore Renewable Energy Installations (OREIs): Guidance to Mariners Operating in the Vicinity of UK OREIs. Southampton: MCA.
Offshore WIND (2020). Dudgeon Crew Rescues Injured Fishermen. Schiedam, Netherlands: Offshore WIND. Available at: https://www.offshorewind.biz/2020/12/23/dudgeon-crew-rescues-injured-fishermen/. Accessed on: 01 November 2023.
OSPAR (2008). Background Document on Potential Problems Associated with Power Cables Other Than Those for Oil and Gas Activities. Paris, France: OSPAR Convention.
PLA (2005). Interference to Radar Imagery from Offshore Wind Farms. 2nd Nautical Offshore Renewable Energy Liaison (NOREL) WP4. London: PLA.
RenewableUK (2014). Offshore Wind and Marine Energy Health and Safety Guidelines. London: RenewableUK.
Renews (2019). Gwynt y Mor vessel answers rescue call. Winchester: Renews. Available at: https://renews.biz/54133/gwynt-y-mor-vessel-answers-rescue-call/. Accessed on: 01 November 2023.
RNLI (2016). Barrow RNLI rescues crew after fishing vessel collides with wind turbine. Barrow: RNLI. Available at: https://rnli.org/news-and-media/2016/may/26/barrow-rnli-rescues-crew-after-fishing-vessel-collides-with-wind-turbine. Accessed on: 01 November 2023.
RNLI (2022). Early morning call for Bridlington RNLI to assist local fishing boat. Barrow: RNLI. Available at: https://rnli.org/news-and-media/2022/june/09/early-morning-call-for-bridlington-rnli-to-assist-local-fishing-boat. Accessed on: 01 November 2023.
RYA and CA (2004). Sharing the Wind – Recreational Boating in the Offshore Wind Strategic Areas. Southampton and London: RYA and CA.
RYA (2019). The RYA Position on Offshore Renewable Energy Developments: Paper 1 (of 4) – Wind Energy. 5th Edition. Southampton, UK: RYA.
The Isle of Thanet News (2019). Margate RNLI call out to yacht tied to London Array wind turbine. Ramsgate: The Isle of Thanet News. Available at: https://theisleofthanetnews.com/2019/05/16/margate-rnli-call-out-to-yacht-tied-to-london-array-wind-turbine/. Accessed on: 01 November 2023.
Vessel Tracker (2020). One Injured in Hard Impact at Wind Turbine. Vessel Tracker. Available at: https://www.vesseltracker.com/en/Ships/Seacat-Ranger-I1746352.html. Accessed on: 01 November 2023.
Vessel Tracker (2021). Fire Alarm in Main Engine. Hamburg, Germany: Vessel Tracker. [online]. Available at: https://www.vesseltracker.com/en/Ships/Windcat-4-I54184.html. Accessed on: 01 November 2023.
Vessel Tracker (2022). Fishing Vessel Damage in Allision off Hornsea. Hamburg, Germany: Vessel Tracker. Available at: https://www.vesseltracker.com/en/Ships/Elsie-B-I1754032.html. Accessed on: 01 November 2023.
- Marine Guidance Note 654 Checklist
Marine Guidance Note 654 Checklist
- The MGN 654 Checklist can be divided into two distinct checklists, one considering the main MGN 654 guidance document and one considering the Methodology for Assessing Marine Navigational Safety and Emergency Response Risks of OREIs (MCA, 2021) which serves as Annex 1 to MGN 654.
- The checklist for the main MGN 654 guidance document is presented in Table A.1. Following this, the checklist for the MCA’s methodology annex is presented in Table A.2. For both checklists, references to where the relevant information and/or assessment is provided in the NRA is given.
- MGN 654 Checklist for Main Document
Issue | Compliance | Comments |
|---|---|---|
Site and Installation Coordinates. Developers are responsible for ensuring that formally agreed coordinates and subsequent variations of site perimeters and individual OREI structures are made available, on request, to interested parties at relevant project stages, including application for consent, development, array variation, operation and decommissioning. This should be supplied as authoritative Geographical Information System (GIS) data, preferably in Environmental Systems Research Institute (ESRI) format. | ||
Traffic Survey. Includes: | ||
All vessel types. | | Section 10: Vessel Traffic Movements All vessel types are considered with specific breakdowns by vessel type given within the shipping and navigation study area. |
At least 28 days duration, within either 12 or 24 months prior to submission of the Array EIA Report. | | Section 5: Data Sources A total of 28 full days of vessel traffic survey data from December 2022 and July 2023 has been assessed within the shipping and navigation study area. |
Multiple data sources. | | Section 5: Data Sources The vessel traffic survey data includes AIS, Radar and visual observations to maximise coverage of vessels not broadcasting on AIS.
Appendix E: Long-Term Vessel Traffic Movements To assist with the assessment of seasonal variation a long-term AIS dataset covering 12 months in 2022 has also been assessed. |
Seasonal variations. | | Section 5: Data Sources A total of 28 full days of vessel traffic survey data from December 2022 and July 2023 has been assessed within the shipping and navigation study area.
Appendix E: Long-Term Vessel Traffic Movements To assist with the assessment of seasonal variation a long-term AIS dataset covering 12 months in 2022 has also been assessed. |
MCA consultation. | | Section 4: Consultation The MCA has been consulted as part of the NRA process including through the Hazard Workshop and via dedicated meetings. |
General Lighthouse Authority (GLA) consultation. | | Section 4: Consultation The NLB (i.e. the relevant GLA for the Array) has been consulted as part of the NRA process including through the Hazard Workshop and dedicated meetings. |
UK CoS consultation. | | Section 4: Consultation The UK CoS has been consulted as part of the NRA process including through the Hazard Workshop and dedicated meetings. |
Recreational and fishing vessel organisations consultation. | | Section 4: Consultation RYA Scotland, SFF, SFWPA, and the SPFA has been consulted as part of the NRA process including through the Hazard Workshop. |
Port and navigation authorities consultation, as appropriate. | | Section 4: Consultation Forth Ports and the Port of Aberdeen have been consulted as part of the NRA process including through the Hazard Workshop. |
Assessment of the cumulative and individual effects of (as appropriate): | ||
i. Proposed OREI site relative to areas used by any type of marine craft. | | Section 10: Vessel Traffic Movements Vessel traffic data in proximity to the site boundary has been analysed.
Section 16: Risk Assessment The hazards due to the Array have been assessed for each phase.
Section 17: Cumulative Risk Assessment Cumulative risk assessment has been undertaken. |
ii. Numbers, types and sizes of vessels presently using such areas. | | Section 10: Vessel Traffic Movements Vessel traffic data in proximity to the site boundary has been analysed and includes breakdowns of daily vessel count, vessel type and vessel size. |
iii. Non-transit uses of the areas, e.g. fishing, day cruising of leisure craft, racing, aggregate dredging, personal watercraft, etc. | | Section 7: Navigational Features The navigational features of the area surrounding the site boundary have been assessed and the presence, or lack thereof, of areas that can involve non-transit uses identified.
Section 10: Vessel Traffic Movements Vessel traffic data in proximity to the site boundary has been analysed and included (via use of Radar and visual observations in addition to AIS) data representative of fishing vessels and recreational vessels that may be involved in non-transit activities. |
iv. Whether these areas contain transit routes used by coastal or deep-draught vessels on passage. | | Section 11: Base Case Vessel Routeing Main commercial routes have been identified in proximity to the site boundary in the shipping and navigation study area using the principles set out in MGN 654, with these vessels assessed on the basis of draught and whether they are coastal. |
v. Alignment and proximity of the site relative to adjacent shipping lanes. | | Section 7: Navigational Features The navigational features of the area surrounding the site boundary have been assessed and no IMO routeing measures were identified. |
vi. Whether the nearby area contains prescribed routeing schemes or precautionary areas. | | Section 7: Navigational Features The navigational features of the area surrounding the site boundary have been assessed and no prescribed routeing schemes or precautionary areas were identified. |
vii. Proximity of the site to areas used for anchorage (charted or uncharted), safe haven, port approaches and pilot boarding or landing areas. | | Section 7: Navigational Features The navigational features of the area surrounding the site boundary have been assessed. No areas used for anchorage (charted or uncharted), safe havens, port approaches, pilot boarding stations or landing areas were identified. |
viii. Whether the site lies within the jurisdiction of a port and/or navigation authority. | | Section 7: Navigational Features The navigational features of the area surrounding the site boundary have been assessed and it was determined that the site boundary does not intersect the jurisdiction of a port and/or navigation authority. |
ix. Proximity of the site to existing fishing grounds, or to routes used by fishing vessels to such grounds. | | Section 10: Vessel Traffic Movements Fishing vessel movements are considered within the shipping and navigation study area. Detailed analysis of dedicated fishing vessel activities is undertaken in volume 2, chapter 12. |
x. Proximity of the site to offshore firing/bombing ranges and areas used for any marine military purposes. | | Section 7: Navigational Features The navigational features of the area surrounding the site boundary have been assessed including military areas. |
xi. Proximity of the site to existing or proposed submarine cables or pipelines, offshore oil/gas platforms, marine aggregate dredging, marine archaeological sites or wrecks, Marine Protected Areas or other exploration/exploitation sites. | | Section 7: Navigational Features The navigational features of the area surrounding the site boundary have been assessed; submarine cables, pipelines, offshore oil/gas platforms and wrecks were identified. These are considered further in volume 2, chapter 15, and volume 2, chapter 19.
Section 14: Cumulative and Transboundary Overview Considers any cumulative and transboundary impacts from proposed developments. |
xii. Proximity of the site to existing or proposed OREI developments, in cooperation with other relevant developers, within each round of lease awards. | | Section 7: Navigational Features The navigational features of the area surrounding the site boundary have been assessed; the Seagreen 1 Offshore Wind Farm was identified.
Section 14: Cumulative and Transboundary Overview Considers any cumulative and transboundary impacts from proposed developments. |
xiii. Proximity of the site relative to any designated areas for the disposal of dredging spoil or other dumping ground. | | Section 7: Navigational Features The navigational features of the area surrounding the site boundary have been assessed; no spoil or dumping grounds were identified. See volume 2, chapter 15 for further details. |
xiv. Proximity of the site to aids to navigation and/or VTS in or adjacent to the area and any impact thereon. | | Section 7: Navigational Features The navigational features of the area surrounding the site boundary have been assessed; aids to navigation were identified and no VTS was identified. |
xv. Researched opinion using computer simulation techniques with respect to the displacement of traffic and, in particular, the creation of ‘choke points’ in areas of high traffic density and nearby or consented OREI sites not yet constructed. | | Section 15: Collision and Allision Risk Modelling Provides quantification of collision and allision risk resulting from the Array including pinch (or choke) points in proximity to the site boundary. |
xvi. With reference to xv. above, the number and type of incidents to vessels which have taken place in or near to the proposed site of the OREI to assess the likelihood of such events in the future and the potential impact of such a situation. | | Section 9: Emergency Response and Incident Overview Historical vessel incident data published by DfT (section 9.3), RNLI (section 9.4) and MAIB (section 9.5) in proximity to the site boundary has been considered alongside historical offshore wind farm incident data throughout the UK. |
xvii. Proximity of the site to areas used for recreation which depend on specific features of the area. | | Section 10: Vessel Traffic Movements Vessel traffic data in proximity to the site boundary has been analysed which included data representative of recreational vessel activities. |
Predicted effect of OREI on traffic and interactive boundaries. Where appropriate, the following should be determined: | ||
a. The safe distance between a shipping route and OREI boundaries. | | Section 13: Future Case Vessel Traffic A methodology for post wind farm routeing is outlined and includes a minimum distance of 1 nm from offshore installations and existing offshore wind farm boundaries. |
b. The width of a corridor between sites or OREIs to allow safe passage of shipping. | | Section 14: Cumulative and Transboundary Overview Cumulative routeing options are presented which consider the distances between cumulative developments. |
OREI Structures. The following should be determined: | ||
a. Whether any feature of the OREI, including auxiliary platforms outside the main generator site, mooring and anchoring systems, inter-device and export cabling could pose any type of difficulty or danger to vessels underway, performing normal operations, including fishing, anchoring and emergency response. | | Section 15: Collision and Allision Risk Modelling Provides quantification of collision and allision risk resulting from the Array including pinch (or choke) points in proximity to the site boundary
Section 16: Risk Assessment The hazards due to the Array have been assessed for each phase and include consideration of users such as commercial vessels, commercial fishing vessels in transit, recreational vessels, anchored vessels and emergency responders. |
b. Clearances of fixed or floating wind turbines blades above the sea surface are not less than 22 m (above Mean High Water Springs (MHWS) for fixed). Floating turbines allow for degrees of motion. | | Section 6: Project Description The shipping and navigation MDS for wind turbines has been outlined, including the minimum blade clearance. |
c. Underwater devices: i. Changes to charted depth; ii. Maximum height above seabed; and iii. Under keel clearance. | | Section 6: Project Description The shipping and navigation MDS for wind turbines has been outlined, including the cable burial specifications. |
d. Whether structures block or hinder the view of other vessels or other navigational features. | | Section 16: Risk Assessment The hazards due to the Array have been assessed for each phase and include consideration of the potential for vessels navigating in proximity to structures to be visually obscured or inhibit the use of existing aids to navigation. |
The effect of tides, tidal streams and weather. It should be determined whether: | ||
a. Current maritime traffic flows and operations in the general area are affected by the depth of water in which the proposed installation is situated at various states of the tide, i.e. whether the installation could pose problems at high water which do not exist at low water conditions, and vice versa. | | Section 6: Project Description The shipping and navigation MDS for the Array has been outlined and includes the range of existing water depths.
Section 8: Meteorological Ocean Data Meteorological data in proximity to the site boundary has been provided, relating to various states of the tide.
Section 10: Vessel Traffic Movements Vessel traffic data in proximity to the site boundary has been analysed, including vessel draught.
Section 15: Collision and Allision Risk Modelling Provides quantification of collision and allision risk resulting from the Array, a process which includes account of tidal conditions. |
b. The set and rate of the tidal stream, at any state of the tide, has a significant effect on vessels in the area of the OREI site. | | Section 8: Meteorological Ocean Data Meteorological data in proximity to the site boundary has been provided, relating to various states of the tide.
Section 15: Collision and Allision Risk Modelling Provides quantification of collision and allision risk resulting from the Array, a process which includes account of tidal conditions. |
c. The maximum rate tidal stream runs parallel to the major axis of the proposed site layout, and, if so, its effect. | | |
d. The set is across the major axis of the layout at any time, and, if so, at what rate. | | |
e. In general, whether engine failure or other circumstance could cause vessels to be set into danger by the tidal stream, including unpowered vessels and small, low speed craft. | | Section 8: Meteorological Ocean Data Meteorological data in proximity to the site boundary has been provided, relating to various states of the tide.
Section 15: Collision and Allision Risk Modelling Provides quantification of collision and allision risk resulting from the Array, including account of tidal conditions and assessment of whether machinery failure could cause vessels to be set into danger. |
f. The structures themselves could cause changes in the set and rate of the tidal stream. | | Section 8: Meteorological Ocean Data Meteorological data in proximity to the site boundary has been provided, relating to various states of the tide and notes that no effects are anticipated. |
g. The structures in the tidal stream could be such as to produce siltation, deposition of sediment or scouring, affecting navigable water depths in the wind farm area or adjacent to the area. | | Section 8: Meteorological Ocean Data Meteorological data in proximity to the site boundary has been provided, relating to various states of the tide.
Section 16: Risk Assessment The hazards due to the Array have been assessed for each phase and include consideration of the potential for reduction in underkeel clearance. |
h. The site, in normal, bad weather, or restricted visibility conditions, could present difficulties or dangers to craft, including sailing vessels, which might pass in close proximity to it. | | Section 8: Meteorological Ocean Data Meteorological data in proximity to the site boundary has been provided, relating to weather and visibility.
Section 10: Vessel Traffic Movements Vessel traffic data in proximity to the site boundary has been analysed, including recreational vessels.
Section 11.3: Adverse Weather Routeing Alternative vessel routeing in proximity to the site boundary in adverse weather has been identified.
Section 16: Risk Assessment The hazards due to the Array have been assessed for each phase and include consideration of adverse weather routeing. |
i. The structures could create problems in the area for vessels under sail, such as wind masking, turbulence or sheer. | | Section 16: Risk Assessment The hazards due to the Array have been assessed for each phase and include consideration of internal allision risk for vessels under sail. |
j. In general, taking into account the prevailing winds for the area, whether engine failure or other circumstances could cause vessels to drift into danger, particularly if in conjunction with a tidal set such as referred to above. | | Section 16: Risk Assessment The hazards due to the Array have been assessed for each phase and include consideration of drifting allision risk. |
Assessment of access to and navigation within, or close to, an OREI. To determine the extent to which navigation would be feasible within the OREI site itself by assessing whether: | ||
a. Navigation within or close to the site would be safe: | ||
i. For all vessels. | | Section 4: Consultation Section 4.1 outlines Regular Operator consultation undertaken.
Section 11.3: Adverse Weather Routeing Alternative vessel routeing in proximity to the site boundary in adverse weather has been identified.
Section 15: Collision and Allision Risk Modelling Provides quantification of collision and allision risk resulting from the Array, including accounting for weather and tidal conditions.
Section 16: Risk Assessment The hazards due to the Array have been assessed for each phase and include consideration of internal allision risk. |
ii. For specified vessel types, operations and/or sizes. | ||
iii. In all directions or areas. | ||
iv. In specified directions or areas. | ||
v. In specified tidal, weather or other conditions. | ||
b. Navigation in and/or near the site should be prohibited or restricted: | ||
i. For specified vessel types, operations and/or sizes. | | Section 12: Navigation, Communication and Position Fixing Equipment
Section 13: Future Case Vessel Traffic A methodology for post wind farm routeing is outlined and includes a minimum distance of 1 nm from offshore installations and existing offshore wind farm boundaries, i.e. it is assumed that commercial vessels will avoid the site boundary.
Section 16: Risk Assessment The hazards due to the Array have been assessed for each phase and include consideration of vessel displacement. |
ii. In respect of specific activities. | | |
iii. In all areas or directions. | | |
iv. In specified areas or directions. | | |
v. In specified tidal or weather conditions. | | |
c. Where it is not feasible for vessels to access or navigate through the site it could cause navigational, safety or routeing problems for vessels operating in the area, e.g. by preventing vessels from responding to calls for assistance from persons in distress. | |
Section 16: Risk Assessment The hazards due to the Array have been assessed for each phase and include consideration of vessel displacement and emergency response capability. |
d. Guidance on the calculation of safe distance of OREI boundaries from shipping routes has been considered. | | Section 13: Future Case Vessel Traffic A methodology for post wind farm routeing is outlined and includes consideration of the Shipping Route Template (MCA, 2021). |
SAR, maritime assistance service, counter pollution and salvage incident response. | ||
The MCA, through HMCG, is required to provide SAR and emergency response within the sea area occupied by all OREIs in UK waters. To ensure that such operations can be safely and effectively conducted, certain requirements must be met by developers and operators. | ||
a. An ERCoP will be developed for the construction, operation and decommissioning phases of the OREI. | | Section 18: Risk Control Log Outlines the embedded mitigation measures to be implemented to reduce the significance of risk of shipping and navigation hazards including compliance with MGN 654 which includes the provision of an ERCoP. |
b. The MCA’s guidance document Offshore Renewable Energy Installations: Requirements, Guidance and Operational Considerations for Search and Rescue and Emergency Response (MCA, 2021) for the design, equipment and operation requirements will be followed. | | Section 2: Guidance and Legislation Outlines the guidance and legislation used within the NRA including Annex 5 of MGN 654.
Section 18: Risk Control Log Outlines the embedded mitigation measures to be implemented to reduce the significance of risk of shipping and navigation hazards including compliance with MGN 654 and its annexes. |
c. A SAR checklist will be completed to record discussions regarding the requirements, recommendations and considerations outlined in Annex 5 (to be agreed with MCA). | | Section 18: Risk Control Log Outlines the embedded mitigation measures to be implemented to reduce the significance of risk of shipping and navigation hazards including compliance with MGN 654 which includes the completion of the SAR checklist. |
6. Hydrography. In order to establish a baseline, confirm the safe navigable depth, monitor seabed mobility and to identify underwater hazards, detailed and accurate hydrographic surveys are included or acknowledged for the following stages and to MCA specifications: | ||
i. Pre construction: The proposed generating assets area and proposed cable route. | | Section 19: Through Life Safety Management Confirms that hydrographic surveys will be undertaken in agreement with the MCA. |
ii. On a pre-established periodicity during the life of the development. | | |
iii. Post construction: Cable route(s). | | |
iv. Post decommissioning of all or part of the development: the installed generating assets area and cable route. | | |
Communications, Radar and positioning systems. To provide researched opinion of a generic and, where appropriate, site-specific nature concerning whether: | ||
a. The structures could produce radio interference such as shadowing, reflections or phase changes, and emissions with respect to any frequencies used for marine positioning, navigation and timing (PNT) or communications, including GMDSS and AIS, whether ship borne, ashore or fitted to any of the proposed structures, to: | ||
i. Vessels operating at a safe navigational distance. | | Section 12: Navigation, Communication and Position Fixing Equipment Assesses the potential risks associated with the use of navigation, communication and position fixing equipment due to the Array including in relation to radio interference. |
ii. Vessels by the nature of their work necessarily operating at less than the safe navigational distance to the OREI, e.g. support vessels, survey vessels, SAR assets. | | |
iii. Vessels by the nature of their work necessarily operating within the OREI. | | |
b. The structures could produce Radar reflections, blind spots, shadow areas or other adverse effects: | ||
i. Vessel to vessel. | | Section 12: Navigation, Communication and Position Fixing Equipment Assesses the potential risks associated with the use of navigation, communication and position fixing equipment due to the Array including in relation to marine Radar. |
ii. Vessel to shore. | | |
iii. VTS Radar to vessel. | | |
iv. Racon to/from vessel. | | |
c. The structures and generators might produce SONAR interference affecting fishing, industrial or military systems used in the area. | | Section 12: Navigation, Communication and Position Fixing Equipment Assesses the potential risks associated with the use of navigation, communication and position fixing equipment due to the Array including in relation to SONAR. |
d. The site might produce acoustic noise which could mask prescribed sound signals. | | Section 12: Navigation, Communication and Position Fixing Equipment Assesses the potential risks associated with the use of navigation, communication and position fixing equipment due to the Array including in relation to noise. |
e. Generators and the seabed cabling within the site and onshore might produce EMFs affecting compasses and other navigation systems. | | Section 12: Navigation, Communication and Position Fixing Equipment Assesses the potential risks associated with the use of navigation, communication and position fixing equipment due to the Array including in relation to electromagnetic interference. |
Risk mitigation measures recommended for OREI during construction, operation and decommissioning. | ||
Mitigation and safety measures will be applied to the OREI development appropriate to the level and type of risk determined during the EIA. The specific measures to be employed will be selected in consultation with the MCA and will be listed in the Developer’s Array EIA Report. These will be consistent with international standards contained in, for example, SOLAS Chapter V (IMO, 1974), and could include any or all of the following: | ||
i. Promulgation of information and warnings through notices to mariners and other appropriate MSI dissemination methods. | | Section 18: Risk Control Log Outlines the embedded mitigation measures to be implemented to reduce the significance of risk of shipping and navigation hazards including promulgation of information. |
ii. Continuous watch by multi-channel VHF, including DSC. | | Section 18: Risk Control Log Outlines the embedded mitigation measures to be implemented to reduce the significance of risk of shipping and navigation hazards including marine coordination. |
iii. Safety zones of appropriate configuration, extent and application to specified vessels[9]. | | Section 18: Risk Control Log Outlines the embedded mitigation measures to be implemented to reduce the significance of risk of shipping and navigation hazards including the application for Safety Zones. |
iv. Designation of the site as an Area to be Avoided. | | There are no plans to designate the Array as an Area to be Avoided. |
v. Provision of aids to navigation as determined by the GLA. | | Section 18: Risk Control Log Outlines the embedded mitigation measures to be implemented to reduce the significance of risk of shipping and navigation hazards including lighting and marking in accordance with NLB and MCA requirements. |
vi. Implementation of routeing measures within or near to the development. | | There are no plans to implement any new routeing measures in proximity to the Array. |
vii. Monitoring by Radar, AIS, Closed Circuit Television (CCTV) or other agreed means. | | Section 18: Risk Control Log Outlines the embedded mitigation measures to be implemented to reduce the significance of risk of shipping and navigation hazards including the completion of a SAR Checklist. |
viii. Appropriate means for OREI operators to notify, and provide evidence of, the infringement of Safety Zones. | | Section 18: Risk Control Log Outlines the embedded mitigation measures to be implemented to reduce the significance of risk of shipping and navigation hazards including the application for Safety Zones and use of guard vessels, which will be considered in further detail in the Safety Zone Application, submitted post consent. |
ix. Creation of an ERCoP with the MCA’s SAR Branch for the construction phase onwards. | | Section 18: Risk Control Log Outlines the embedded mitigation measures to be implemented to reduce the significance of risk of shipping and navigation hazards including compliance with MGN 654 which include the provision of an ERCoP. |
x. Use of guard vessels, where appropriate. | | Section 18: Risk Control Log Outlines the embedded mitigation measures to be implemented to reduce the significance of risk of shipping and navigation hazards including the use of guard vessels. |
xi. Update NRAs every two years, e.g. at testing sites. | | Not applicable to the Array. |
xii. Device-specific or array-specific NRAs. | | Section 6: Project Description All surface and subsea elements of the Array have been considered in this NRA. |
xiii. Design of OREI structures to minimise risk to contacting vessels or craft. | | Section 15: Collision and Allision Risk Modelling Provides assessment of potential for interaction with subsea mooring lines and dynamic cables (section 15.6). |
xiv. Any other measures and procedures considered appropriate in consultation with other stakeholders. | | Section 18: Risk Control Log Outlines the embedded mitigation measures to be implemented to reduce the significance of risk of shipping and navigation hazards.
Section 19: Through Life Safety Management Outlines how HSEQ documentation will be maintained and reviewed. |
- MGN 654 Annex 1 Checklist
Item | Compliance | Comments |
|---|---|---|
A risk claim is included that is supported by a reasoned argument and evidence. | | Section 16: Risk Assessment The risk assessment provides a risk claim for a range of hazards based on a number of inputs including (but not limited to) baseline data, expert opinion, outputs of the Hazard Workshop, stakeholder concerns and lessons learnt from existing offshore developments. |
Description of the marine environment. | | Section 7: Navigational Features Relevant navigational features in proximity to the site boundary have been described including (but not limited to) other offshore wind farm developments, aids to navigation, pipelines and charted wrecks.
Section 14: Cumulative and Transboundary Overview Potential future developments have been screened in to the cumulative risk assessment where a cumulative or in combination activity has been identified based upon the location and distance from the Array, including consideration of other offshore wind farms. |
SAR overview and assessment. | | Section 9: Emergency Response and Incident Overview Existing SAR resources of relevance to the Array are summarised including the UK SAR operations contract, RNLI stations and assets and HMCG stations.
Section 16: Risk Assessment The risk assessment includes an assessment of how activities associated with the Array may restrict emergency response capability of existing resources. |
Description of the OREI development and how it changes the marine environment. | | Section 6: Project Description The maximum extent of the Array for which any shipping and navigation hazards are assessed is provided including a description of the site boundary, Array infrastructure, timelines and indicative vessel and helicopter numbers during the construction and operation and maintenance phases.
Section 13: Future Case Vessel Traffic Worst case alternative routeing for commercial traffic has been considered. |
Analysis of the marine traffic, including base case and future traffic densities and types. | | Section 10: Vessel Traffic Movements Vessel traffic data in proximity to the Array has been analysed and includes vessel density and breakdowns of vessel type.
Section 13: Future Case Vessel Traffic Future vessel traffic levels have been considered, broken down as increases in commercial vessel activity, commercial fishing vessel and recreational vessel activity, increases in traffic associated with project operations and changes in marine aggregate dredging activities. Additionally, worst case alternative routeing for commercial traffic has been considered. |
Status of the Hazard Log:
| | Section 3: Navigational Risk Assessment Methodology A tolerability matrix has been defined to determine the tolerability (significance) of risks.
Appendix B: Hazard Log The complete Hazard Log is presented and includes all required elements listed in this checklist item. This includes a description of the hazards considered, possible causes, consequences (most likely and worst case) and relevant embedded mitigation measures. Using this information, each hazard is then ranked in terms of frequency of occurrence and severity of consequence to give a tolerability (significance) level. |
NRA:
| | Section 2: Guidance and Legislation MGN 654 and the IMO’s FSA guidelines are the primary guidance documents used for the assessment alongside MGN 372 Amendment 1.
Section 15: Collision and Allision Risk Modelling Provides quantification of collision and allision risk resulting from the Array with the results outlined numerically and graphically, where appropriate. |
Risk control log | | Section 18: Risk Control Log Provides the risk control log which summarises the assessment of shipping and navigation hazards scoped into the risk assessment. This includes the proposed embedded mitigation measures, frequency of occurrence, severity of consequence and significance of risk, per hazard. |
- Hazard Log
Hazard Log
The draft hazard log was produced following the hazard workshop (see section 4.3) and distributed to attendees for comment. The updated hazard log based on feedback received is presented in Table B.1.
The initial hazard log indicated that certain cumulative hazards were unacceptable, and that further consultation was required with the MCA and NLB to determine mitigation. Subsequent consultation is included in section 4, noting the key cumulative mitigation was identified as a cumulative approach to lighting and marking and charting (which will be agreed with NLB and MCA post consent including via the LMP process).
User | Phase (C/O/D) | Embedded Mitigation Measures (Full Descriptions Provided in Separate Sheet) | Possible Causes | Most Likely Consequences | Realistic Most Likely Consequences | Worst Case Consequences | Realistic Worst Case Consequences | Further Mitigation Required | Additional Comments | ||||||||||||
|---|---|---|---|---|---|---|---|---|---|---|---|---|---|---|---|---|---|---|---|---|---|
Consequences | Risk | Consequences | Risk | ||||||||||||||||||
Displacement from Routeing with Potential for Collision | |||||||||||||||||||||
Commercial vessels | C/D | • Buoyed construction/ decommissioning area | • Presence of buoyed construction/ decommissioning area | Displacement with effects on schedules and low impact collision event occurs involving minor vessel damage | 3 | 2 | 2 | 3 | 2 | 2.3 | Broadly Acceptable | Displacement with effects on schedule and collision event occurs involving vessel damage, injury to person and/or pollution | 2 | 4 | 4 | 4 | 4 | 4.0 | Tolerable |
| MCA indicated People should have a ranking of 5 for worst case. The ranking of 4 was retained on the grounds that a higher consequence would lead to a lower frequency. |
O | • Charting of infrastructure | • Presence of surface structures | 2 | 2 | 2 | 3 | 2 | 2.3 | Broadly Acceptable | 2 | 4 | 4 | 4 | 4 | 4.0 | Tolerable | |||||
Commercial fishing vessels in transit | C/D | • Buoyed construction/ decommissioning area | • Presence of buoyed construction/ decommissioning area | Displacement with effects on schedules and low impact collision event occurs involving minor vessel damage | 3 | 2 | 2 | 3 | 2 | 2.3 | Broadly Acceptable | Displacement with effects on routine and collision event occurs involving vessel damage, injury to person and/or pollution | 2 | 4 | 3 | 4 | 4 | 3.8 | Broadly Acceptable |
|
|
O | • Charting of infrastructure | • Presence of surface structures | 2 | 2 | 2 | 3 | 2 | 2.3 | Broadly Acceptable | 2 | 4 | 3 | 4 | 4 | 3.8 | Broadly Acceptable | |||||
Recreational vessels (2.5 to 24m length) | C/D | • Buoyed construction/ decommissioning area | • Presence of buoyed construction/ decommissioning area | Displacement with effects on schedules and low impact collision event occurs involving minor vessel damage | 3 | 2 | 2 | 3 | 2 | 2.3 | Broadly Acceptable | Displacement with effects on routine and collision event occurs involving vessel damage, injury to person and/or pollution | 1 | 4 | 2 | 4 | 4 | 3.5 | Broadly Acceptable |
|
|
O | • Charting of infrastructure | • Presence of surface structures | 2 | 2 | 2 | 3 | 2 | 2.3 | Broadly Acceptable | 1 | 4 | 2 | 4 | 4 | 3.5 | Broadly Acceptable | |||||
Displacement from Adverse Weather Routeing | |||||||||||||||||||||
Commercial vessels | C/D | • Buoyed construction/ decommissioning area | • Presence of buoyed construction/ decommissioning area | Displacement from normal adverse weather preference with no effects on schedule and no safety risks | 5 | 1 | 1 | 1 | 1 | 1.0 | Tolerable | Displacement from normal adverse weather preference with effects on schedule and/or passing further offshore than preferred | 3 | 3 | 3 | 3 | 3 | 3.0 | Tolerable |
|
|
O | • Charting of infrastructure | • Presence of surface structures | 5 | 1 | 1 | 1 | 1 | 1.0 | Tolerable | 3 | 3 | 3 | 3 | 3 | 3.0 | Tolerable | |||||
Commercial fishing vessels in transit | C/D | • Buoyed construction/ decommissioning area | • Presence of buoyed construction/ decommissioning area | Displacement from normal adverse weather preference with no safety risks | 5 | 1 | 1 | 1 | 1 | 1.0 | Tolerable | Displacement from normal adverse weather preference with effects on schedule and/or passing further offshore than preferred | 1 | 3 | 2 | 3 | 3 | 2.8 | Broadly Acceptable |
|
|
O | • Charting of infrastructure | • Presence of surface structures | 5 | 1 | 1 | 1 | 1 | 1.0 | Tolerable | 1 | 3 | 2 | 3 | 3 | 2.8 | Broadly Acceptable | |||||
Recreational vessels (2.5 to 24m length) | C/D | • Buoyed construction/ decommissioning area | • Presence of buoyed construction/ decommissioning area | Displacement from normal adverse weather preference with no safety risks | 1 | 1 | 1 | 1 | 1 | 1.0 | Broadly Acceptable | Displacement from normal adverse weather preference with effects on schedule and/or passing further offshore than preferred | 1 | 3 | 2 | 3 | 3 | 2.8 | Broadly Acceptable |
|
|
O | • Charting of infrastructure | • Presence of surface structures | 1 | 1 | 1 | 1 | 1 | 1.0 | Broadly Acceptable | 1 | 3 | 2 | 3 | 3 | 2.8 | Broadly Acceptable | |||||
Collision Risk (Third-Party with Project Vessel in Transit) | |||||||||||||||||||||
Commercial vessels | C/D | • Application for safety zones | • Project vessels in transit including towing operations | Low impact collision event occurs involving minor vessel damage | 3 | 2 | 2 | 3 | 2 | 2.3 | Broadly Acceptable | Collision event occurs involving vessel damage, injury to person and/or pollution | 2 | 4 | 4 | 4 | 4 | 4.0 | Tolerable |
| Noted importance of vessel management plan (VMP). Indicated that VMP should include consideration of towing operations. |
O | 2 | 2 | 2 | 3 | 2 | 2.3 | Broadly Acceptable | 2 | 4 | 4 | 4 | 4 | 4.0 | Tolerable |
| ||||||
Commercial fishing vessels in transit | C/D | • Application for safety zones | • Project vessels in transit including towing operations | Low impact collision event occurs involving minor vessel damage | 3 | 2 | 2 | 3 | 2 | 2.3 | Broadly Acceptable | Collision event occurs involving vessel damage, injury to person and/or pollution | 3 | 4 | 3 | 4 | 4 | 3.8 | Tolerable |
| Noted importance of VMP. Indicated that VMP should include consideration of towing operations. |
O | 2 | 2 | 2 | 3 | 2 | 2.3 | Broadly Acceptable | 2 | 4 | 3 | 4 | 4 | 3.8 | Broadly Acceptable |
| ||||||
Recreational vessels (2.5 to 24m length) | C/D | • Application for safety zones | • Project vessels in transit including towing operations | Low impact collision event occurs involving minor vessel damage | 3 | 2 | 2 | 3 | 2 | 2.3 | Broadly Acceptable | Collision event occurs involving vessel damage, injury to person and/or pollution | 3 | 4 | 2 | 4 | 4 | 3.5 | Tolerable |
| Noted importance of VMP. Indicated that VMP should include consideration of towing operations. |
O | 2 | 2 | 2 | 3 | 2 | 2.3 | Broadly Acceptable | 2 | 4 | 2 | 4 | 4 | 3.5 | Broadly Acceptable |
| ||||||
Allision Risk (Powered, Drifting or Internal) | |||||||||||||||||||||
Commercial vessels | C/D | • Application for safety zones | • Presence of surface structures | Vessel passes at an unsafe distance resulting in a need to make a late adjustment to course/speed | 4 | 1 | 1 | 1 | 1 | 1.0 | Broadly Acceptable | Allision event occurs involving vessel damage, injury to person and/or pollution | 2 | 4 | 4 | 4 | 4 | 4.0 | Tolerable | Inclusion of contingency plans for navigational lights as part of Lighting and Marking Plan (LMP) process. | Noted that any wind turbine generators (WTGs) towed from site would need consideration if they included a navigational light. |
O | • Charting of infrastructure | • Presence of surface structures | Vessel passes in close proximity resulting in a need to make a late adjustment to course/speed | 4 | 1 | 1 | 1 | 1 | 1.0 | Broadly Acceptable | Allision event occurs involving vessel damage, injury to person and/or pollution | 3 | 4 | 4 | 4 | 4 | 4.0 | Tolerable | Inclusion of contingency plans for navigational lights as part of LMP process. | Noted that any WTGs towed from site would need consideration if they included a navigational light. | |
Commercial fishing vessels in transit | C/D | • Application for safety zones | • Presence of surface structures | Vessel passes in close proximity resulting in a need to make a late adjustment to course/speed | 4 | 1 | 1 | 1 | 1 | 1.0 | Broadly Acceptable | Allision event occurs involving vessel damage, injury to person and/or pollution | 2 | 4 | 3 | 4 | 4 | 4.0 | Tolerable | Inclusion of contingency plans for navigational lights as part of LMP process. | Noted that any WTGs towed from site would need consideration if they included a navigational light. |
O | • Charting of infrastructure | • Presence of surface structures | Vessel passes in close proximity resulting in a need to make a late adjustment to course/speed | 4 | 1 | 1 | 1 | 1 | 1.0 | Broadly Acceptable | Allision event occurs involving vessel damage, injury to person and/or pollution | 3 | 4 | 3 | 4 | 4 | 3.8 | Tolerable | Inclusion of contingency plans for navigational lights as part of LMP process. | Noted that any WTGs towed from site would need consideration if they included a navigational light. | |
Recreational vessels (2.5 to 24m length) | C/D | • Application for safety zones | • Presence of surface structures | Vessel passes in close proximity resulting in a need to make a late adjustment to course/speed | 4 | 1 | 1 | 1 | 1 | 1.0 | Broadly Acceptable | Allision event occurs involving vessel damage, injury to person and/or pollution | 2 | 4 | 2 | 4 | 4 | 3.5 | Broadly Acceptable | Inclusion of contingency plans for navigational lights as part of LMP process. | Noted that any WTGs towed from site would need consideration if they included a navigational light. |
O | • Charting of infrastructure | • Presence of surface structures | Vessel passes in close proximity resulting in a need to make a late adjustment to course/speed | 4 | 1 | 1 | 1 | 1 | 1.0 | Broadly Acceptable | Allision event occurs involving vessel damage, injury to person and/or pollution | 3 | 4 | 2 | 4 | 4 | 3.5 | Tolerable | Inclusion of contingency plans for navigational lights as part of LMP process. | Noted that any WTGs towed from site would need consideration if they included a navigational light. | |
Interference with Marine Navigation, Communication and Position Fixing Equipment | |||||||||||||||||||||
All vessels | C/D | • Compliance with MGN 654 | • Human error relating to adjustment of Radar controls | Structures have no effect upon the Radar, communications and navigation equipment on a vessel | 3 | 1 | 1 | 1 | 1 | 1.0 | Broadly Acceptable | Minor level of Radar interference due to the structures | 2 | 1 | 1 | 1 | 1 | 1.0 | Broadly Acceptable |
|
|
O | • Compliance with MGN 654 | • Human error relating to adjustment of Radar controls | Structures have no effect upon the Radar, communications and navigation equipment on a vessel | 4 | 1 | 1 | 1 | 1 | 1.0 | Broadly Acceptable | Minor level of Radar interference due to the structures | 3 | 1 | 1 | 1 | 1 | 1.0 | Broadly Acceptable |
|
| |
Loss of Station | |||||||||||||||||||||
All vessels | C/D | • Compliance with MGN 654 and MCA Regulatory Expectations | Damage to or failure of mooring line(s) | Failure of a single mooring line leads to temporary increase in the maximum excursion of the floating structure but not full loss of station | 3 | 2 | 2 | 2 | 2 | 2.0 | Broadly Acceptable | Total failure of mooring system leads to drifting of floating structure with risk of collision with vessels | 1 | 4 | 4 | 4 | 4 | 4.0 | Broadly Acceptable |
|
|
All vessels | O | • Compliance with MGN 654 and MCA Regulatory Expectations | Damage to or failure of mooring line(s) | Failure of a single mooring line leads to temporary increase in the maximum excursion of the floating structure but not full loss of station | 3 | 2 | 2 | 2 | 2 | 2.0 | Broadly Acceptable | Total failure of mooring system leads to drifting of floating structure with risk of collision with vessels | 1 | 4 | 4 | 4 | 4 | 4.0 | Broadly Acceptable |
|
|
Interaction with Subsea Mooring Lines or Cables | |||||||||||||||||||||
All vessels | C/D | • Compliance with MGN 654 | • Presence of mooring lines and cables | Vessel passes in close proximity to floating structure resulting in a need to make a late adjustment to course/speed | 4 | 1 | 1 | 1 | 1 | 1.0 | Broadly Acceptable | Vessel passes in proximity to floating structure and makes contact with mooring line or cable | 2 | 4 | 4 | 4 | 4 | 4.0 | Tolerable | MCA and NLB consultation on final design | Noted that bad weather conditions (e.g., strong winds, large swells) may mean subsea elements are more of a risk. |
O | • Compliance with MGN 654 | • Presence of mooring lines and cables | Vessel passes in close proximity to floating structure resulting in a need to make a late adjustment to course/speed | 4 | 1 | 1 | 1 | 1 | 1.0 | Broadly Acceptable | Vessel passes in proximity to floating structure and makes contact with mooring line or cable | 2 | 4 | 4 | 4 | 4 | 4.0 | Tolerable | |||
Vessels dropping anchor | C/D | • Compliance with MGN 654 | Presence of subsea cables or cable protection | Vessel anchors on or drags anchor over an installed cable/protection but no interaction occurs dependent on anchor/burial depth | 3 | 1 | 1 | 1 | 1 | 1.0 | Broadly Acceptable | Vessel anchors on or drags anchor over an installed cable/protection resulting in damage to the cable/protection and/or anchor | 2 | 2 | 1 | 2 | 2 | 1.8 | Broadly Acceptable |
|
|
O | • Compliance with MGN 654 | Presence of subsea cables or cable protection | Vessel anchors on or drags anchor over an installed cable/protection but no interaction occurs dependent on anchor/burial depth | 2 | 1 | 1 | 1 | 1 | 1.0 | Broadly Acceptable | Vessel anchors on or drags anchor over an installed cable/protection resulting in damage to the cable/protection and/or anchor | 1 | 2 | 1 | 2 | 2 | 1.8 | Broadly Acceptable |
|
| |
Reduction in Emergency Response Capability | |||||||||||||||||||||
Emergency responders | C/D | • Compliance with MGN 654 | • Under construction array does not facilitate responder access | Delay to emergency response request | 2 | 1 | 1 | 1 | 2 | 1.3 | Broadly Acceptable | Delay to response request leading to injury to person or loss of life | 1 | 5 | 5 | 5 | 5 | 5.0 | Tolerable |
| Assumes MGN 654 compliant layout. |
O | • Array does not facilitate responder access | 2 | 1 | 1 | 1 | 2 | 1.3 | Broadly Acceptable | 1 | 5 | 5 | 5 | 5 | 5.0 | Tolerable | ||||||
User | Phase (C/O/D) | Embedded Mitigation Measures (Full Descriptions Provided in Separate Sheet) | Possible Causes | Most Likely Consequences | Realistic Most Likely Consequences | Worst Case Consequences | Realistic Worst Case Consequences | Further Mitigation Required | Additional Comments | ||||||||||||
|---|---|---|---|---|---|---|---|---|---|---|---|---|---|---|---|---|---|---|---|---|---|
Consequences | Risk | Consequences | Risk | ||||||||||||||||||
Displacement from Routeing with Potential for Collision | |||||||||||||||||||||
Commercial vessels | C/D | • Buoyed construction/ decommissioning area | • Presence of buoyed construction/ decommissioning areas | Displacement with effects on schedules and low impact collision event occurs involving minor vessel damage | 4 | 2 | 2 | 3 | 2 | 2.3 | Tolerable | Displacement with effects on schedule and collision event occurs involving vessel damage, injury to person and/or pollution | 3 | 4 | 4 | 4 | 4 | 4.0 | Tolerable | MCA and NLB consultation to agree suitable cumulative lighting and marking and layouts. | Considered likely that larger commercial vessels will avoid the area altogether and pass further inshore, however considered possible that some vessels may look to transit between Ossian and the neighbouring projects. General consensus was that additional mitigation on a cumulative basis was needed to manage collision risk. |
O | • Charting of infrastructure | • Presence of surface structures | 3 | 2 | 2 | 3 | 2 | 2.3 | Broadly Acceptable | 3 | 4 | 4 | 4 | 4 | 4.0 | Tolerable | |||||
Commercial fishing vessels in transit | C/D | • Buoyed construction/ decommissioning area | • Presence of buoyed construction/ decommissioning areas | Displacement with effects on routine but no safety risks | 5 | 1 | 1 | 1 | 1 | 1.0 | Tolerable | Displacement with effects on routine and collision event occurs involving vessel damage, injury to person and/or pollution | 4 | 4 | 3 | 4 | 4 | 3.8 | Tolerable | MCA and NLB consultation to agree suitable cumulative lighting and marking and layouts. | It was noted that active fishing or fishing vessel transits could occur in between Ossian and other neighbouring projects, and concerns were raised over interactions with any larger commercial vessels that may transit between the projects. General consensus was that additional mitigation on a cumulative basis was needed to manage collision risk. |
O | • Charting of infrastructure | • Presence of surface structures | 4 | 1 | 1 | 1 | 1 | 1.0 | Broadly Acceptable | 4 | 4 | 3 | 4 | 4 | 3.8 | Tolerable | |||||
Recreational vessels (2.5 to 24m length) | C/D | • Buoyed construction/ decommissioning area | • Presence of buoyed construction/ decommissioning areas | Displacement with effects on routine but no safety risks | 5 | 1 | 1 | 1 | 1 | 1.0 | Tolerable | Displacement with effects on routine and collision event occurs involving vessel damage, injury to person and/or pollution | 2 | 4 | 2 | 4 | 4 | 3.5 | Broadly Acceptable |
| Recreational transits were considered likely to be an infrequent occurrence but may still occur. |
O | • Charting of infrastructure | • Presence of surface structures | 4 | 1 | 1 | 1 | 1 | 1.0 | Broadly Acceptable | 2 | 4 | 2 | 4 | 4 | 3.5 | Broadly Acceptable | |||||
Displacement from Adverse Weather Routeing | |||||||||||||||||||||
Commercial vessels | C/D | • Buoyed construction/ decommissioning area | • Presence of buoyed construction/ decommissioning areas | Displacement from normal adverse weather preference with no effects on schedule and no safety risks | 5 | 1 | 1 | 1 | 1 | 1.0 | Tolerable | Displacement from normal adverse weather preference with effects on schedule due to large deviation and/or passing further offshore than preferred | 4 | 3 | 3 | 3 | 3 | 3.0 | Tolerable | MCA and NLB consultation to agree suitable cumulative lighting and marking and layouts. | Should be considered that prevailing south westerly (SW) winds may mean that transit between wind farms is not preferred in adverse weather |
O | • Charting of infrastructure | • Presence of surface structures | 5 | 1 | 1 | 1 | 1 | 1.0 | Tolerable | 4 | 3 | 3 | 3 | 3 | 3.0 | Tolerable | |||||
Commercial fishing vessels in transit | C/D | • Buoyed construction/ decommissioning area• Charting of infrastructure• Compliance with MGN 654• Promulgation of information | • Presence of buoyed construction/ decommissioning areas• Adverse weather• Construction/ decommissioning vessels which are RAM | Displacement from normal adverse weather preference with no safety risks | 5 | 1 | 1 | 1 | 1 | 1.0 | Tolerable | Displacement from normal adverse weather preference with effects on schedule and/or passing further offshore than preferred | 2 | 3 | 2 | 3 | 3 | 2.8 | Broadly Acceptable | MCA and NLB consultation to agree suitable cumulative lighting and marking and layouts. Consideration of how cumulative projects are charted. | Should be considered that prevailing SW winds may mean that transit between wind farms is not preferred in adverse weather |
O | • Charting of infrastructure | • Presence of surface structures | 5 | 1 | 1 | 1 | 1 | 1.0 | Tolerable | 2 | 3 | 2 | 3 | 3 | 2.8 | Broadly Acceptable | |||||
Recreational vessels (2.5 to 24m length) | C/D | • Buoyed construction/ decommissioning area | • Presence of buoyed construction/ decommissioning areas | Displacement from normal adverse weather preference with no safety risks | 1 | 1 | 1 | 1 | 1 | 1.0 | Broadly Acceptable | Displacement from normal adverse weather preference with effects on schedule and/or passing further offshore than preferred | 2 | 3 | 2 | 3 | 3 | 2.8 | Broadly Acceptable |
| Should be considered that prevailing SW winds may mean that transit between wind farms is not preferred in adverse weather |
O | • Charting of infrastructure | • Presence of surface structures | 1 | 1 | 1 | 1 | 1 | 1.0 | Broadly Acceptable | 2 | 3 | 2 | 3 | 3 | 2.8 | Broadly Acceptable | |||||
Collision Risk (Third-Party with Project Vessel in Transit) | |||||||||||||||||||||
Commercial vessels | C/D | • Application for safety zones | • Project vessels in transit including towing operations | Increased encounters leading to low impact collision | 3 | 2 | 2 | 3 | 2 | 2.3 | Broadly Acceptable | Collision event occurs involving vessel damage, injury to person and/or pollution | 3 | 4 | 4 | 4 | 4 | 4.0 | Tolerable |
| Noted importance of vessel management plan (VMP). Indicated that VMP should include consideration of towing operations. |
O | 2 | 2 | 2 | 3 | 2 | 2.3 | Broadly Acceptable | 3 | 4 | 4 | 4 | 4 | 4.0 | Tolerable |
| ||||||
Commercial fishing vessels in transit | C/D | • Application for safety zones | • Project vessels in transit including towing operations | Increased encounters leading to low impact collision | 3 | 2 | 2 | 3 | 2 | 2.3 | Broadly Acceptable | Collision event occurs involving vessel damage, injury to person and/or pollution | 3 | 4 | 3 | 4 | 4 | 3.8 | Tolerable |
| Noted importance of VMP. Indicated that VMP should include consideration of towing operations. |
O | 2 | 2 | 2 | 3 | 2 | 2.3 | Broadly Acceptable | 2 | 4 | 3 | 4 | 4 | 3.8 | Broadly Acceptable |
| ||||||
Recreational vessels (2.5 to 24m length) | C/D | • Application for safety zones | • Project vessels in transit including towing operations | Increased encounters leading to low impact collision | 3 | 2 | 2 | 3 | 2 | 2.3 | Broadly Acceptable | Collision event occurs involving vessel damage, injury to person and/or pollution | 3 | 4 | 2 | 4 | 4 | 3.5 | Tolerable |
| Noted importance of VMP. Indicated that VMP should include consideration of towing operations. |
O | 2 | 2 | 2 | 3 | 2 | 2.3 | Broadly Acceptable | 2 | 4 | 2 | 4 | 4 | 3.5 | Broadly Acceptable |
| ||||||
Allision Risk (Powered, Drifting or Internal) | |||||||||||||||||||||
Commercial vessels | C/D | • Application for safety zones | • Presence of surface structures | Vessel passes in close proximity resulting in a need to make a late adjustment to course/speed | 4 | 1 | 1 | 1 | 1 | 1.0 | Broadly Acceptable | Allision event occurs involving vessel damage, injury to person and/or pollution | 3 | 4 | 4 | 4 | 4 | 4.0 | Tolerable | Inclusion of contingency plans for navigational lights as part of Lighting and Marking Plan (LMP) process. | Noted that any wind turbine generators towed from site would need consideration if they included a navigational light. |
O | • Charting of infrastructure | • Presence of surface structures | Vessel passes in close proximity resulting in a need to make a late adjustment to course/speed | 4 | 1 | 1 | 1 | 1 | 1.0 | Broadly Acceptable | Allision event occurs involving vessel damage, injury to person and/or pollution | 3 | 4 | 4 | 4 | 4 | 4.0 | Tolerable | |||
Commercial fishing vessels in transit | C/D | • Application for safety zones | • Presence of surface structures | Vessel passes in close proximity resulting in a need to make a late adjustment to course/speed | 4 | 1 | 1 | 1 | 1 | 1.0 | Broadly Acceptable | Allision event occurs involving vessel damage, injury to person and/or pollution | 3 | 4 | 3 | 4 | 4 | 3.8 | Tolerable | Inclusion of contingency plans for navigational lights as part of Lighting and Marking Plan (LMP) process. | Noted that any wind turbine generators towed from site would need consideration if they included a navigational light. |
O | • Charting of infrastructure | • Presence of surface structures | Vessel passes in close proximity resulting in a need to make a late adjustment to course/speed | 4 | 1 | 1 | 1 | 1 | 1.0 | Broadly Acceptable | Allision event occurs involving vessel damage, injury to person and/or pollution | 3 | 4 | 3 | 4 | 4 | 3.8 | Tolerable | |||
Recreational vessels (2.5 to 24m length) | C/D | • Application for safety zones | • Presence of surface structures | Vessel passes in close proximity resulting in a need to make a late adjustment to course/speed | 4 | 1 | 1 | 1 | 1 | 1.0 | Broadly Acceptable | Allision event occurs involving vessel damage, injury to person and/or pollution | 3 | 4 | 2 | 4 | 4 | 3.5 | Tolerable | Inclusion of contingency plans for navigational lights as part of Lighting and Marking Plan (LMP) process. | Noted that any wind turbine generators towed from site would need consideration if they included a navigational light. |
O | • Charting of infrastructure | • Presence of surface structures | Vessel passes in close proximity resulting in a need to make a late adjustment to course/speed | 4 | 1 | 1 | 1 | 1 | 1.0 | Broadly Acceptable | Allision event occurs involving vessel damage, injury to person and/or pollution | 3 | 4 | 2 | 4 | 4 | 3.5 | Tolerable | |||
Interference with Marine Navigation, Communication and Position Fixing Equipment | |||||||||||||||||||||
All vessels | C/D | • Compliance with MGN 654 | • Human error relating to adjustment of Radar controls | Structures have no effect upon the Radar, communications and navigation equipment on a vessel | 5 | 1 | 1 | 1 | 1 | 1.0 | Tolerable | Radar interference due to the structures leading to a large vessels being unaware of presence of a smaller vessel leading to collision | 2 | 4 | 4 | 4 | 4 | 4.0 | Tolerable |
|
|
O | • Compliance with MGN 654 | • Human error relating to adjustment of Radar controls | Structures have no effect upon the Radar, communications and navigation equipment on a vessel | 5 | 1 | 1 | 1 | 1 | 1.0 | Tolerable | Radar interference due to the structures leading to a large vessels being unaware of presence of a smaller vessel leading to collision | 3 | 4 | 4 | 4 | 4 | 4.0 | Tolerable |
|
| |
Loss of Station | |||||||||||||||||||||
All vessels | C/D | • Compliance with MGN 654 and Maritime and Coastguard Agency (MCA) Regulatory Expectations | Damage to or failure of mooring line(s) | Failure of a single mooring line leads to temporary increase in the maximum excursion of the floating structure but not full loss of station | 3 | 2 | 2 | 2 | 2 | 2.0 | Broadly Acceptable | Total failure of mooring system leads to drifting of floating structure with risk of collision with vessels | 2 | 4 | 3 | 4 | 4 | 3.8 | Broadly Acceptable | Recovery and response procedures |
|
All vessels | O | • Compliance with MGN 654 and MCA Regulatory Expectations | Damage to or failure of mooring line(s) | Failure of a single mooring line leads to temporary increase in the maximum excursion of the floating structure but not full loss of station | 3 | 2 | 2 | 2 | 2 | 2.0 | Broadly Acceptable | Total failure of mooring system leads to drifting of floating structure with risk of collision with vessels | 2 | 4 | 3 | 4 | 4 | 3.8 | Broadly Acceptable | Recovery and response procedures |
|
Interaction with Subsea Mooring Lines or Cables | |||||||||||||||||||||
All vessels | C/D | • Compliance with MGN 654 | • Presence of mooring lines and cables | Vessel passes in close proximity to floating structure but no interaction with mooring lines or cables occurs | 4 | 1 | 1 | 1 | 1 | 1.0 | Broadly Acceptable | Vessel passes in proximity to floating structure and makes contact with mooring line or cable | 3 | 4 | 3 | 4 | 4 | 3.8 | Tolerable | MCA and NLB consultation on final design | Noted that bad weather conditions (e.g., strong winds, large swells) may mean subsea elements are more of a risk. |
O | • Compliance with MGN 654 | • Presence of mooring lines and cables | Vessel passes in close proximity to floating structure but no interaction with mooring lines or cables occurs | 4 | 1 | 1 | 1 | 1 | 1.0 | Broadly Acceptable | Vessel passes in proximity to floating structure and makes contact with mooring line or cable | 3 | 4 | 3 | 4 | 4 | 3.8 | Tolerable | |||
Vessels dropping anchor | C/D | • Compliance with MGN 654 | Presence of subsea cables or cable protection | Vessel anchors on or drags anchor over an installed cable/protection but no interaction occurs | 3 | 1 | 1 | 1 | 1 | 1.0 | Broadly Acceptable | Vessel anchors on or drags anchor over an installed cable/protection resulting in damage to the cable/protection and/or anchor | 3 | 2 | 1 | 2 | 2 | 1.8 | Broadly Acceptable |
|
|
O | • Compliance with MGN 654 | Presence of subsea cables or cable protection | Vessel anchors on or drags anchor over an installed cable/protection but no interaction occurs | 2 | 1 | 1 | 1 | 1 | 1.0 | Broadly Acceptable | Vessel anchors on or drags anchor over an installed cable/protection resulting in damage to the cable/protection and/or anchor | 2 | 2 | 1 | 2 | 2 | 1.8 | Broadly Acceptable |
|
| |
Reduction in Emergency Response Capability | |||||||||||||||||||||
Emergency responders | C/D | • Compliance with MGN 654 | • Under construction array does not facilitate responder access | Delay to emergency response request | 3 | 1 | 1 | 1 | 2 | 1.3 | Broadly Acceptable | Delay to response request leading to injury to person or loss of life, in particular in bad weather conditions | 2 | 5 | 5 | 5 | 5 | 5.0 | Tolerable | SAR checklist process, including consideration of VHF and AIS | Assumes MGN 654 compliant layout. |
O | • Array does not facilitate responder access | 3 | 1 | 1 | 1 | 2 | 1.3 | Broadly Acceptable | 2 | 5 | 5 | 5 | 5 | 5.0 | Tolerable | ||||||
- Consequences Assessment
Consequences Assessment
- This appendix presents an assessment of the consequences of collision and allision incidents, in terms of people and the environment, due to the presence of the Array.
- The significance of the impact due to the presence of the Array is also assessed based on risk evaluation criteria and comparison with historical incident data in UK waters[10].
- Risk Evaluation Criteria
Risk Evaluation Criteria Risk to People
- Regarding the assessment of risk to people two measures are considered, namely:
- individual risk; and
- societal risk.
- Individual Risk
- Individual risk considers whether the risk from an incident to a particular individual changes substantially due to the presence of the Array. Individual risk considers not only the frequency of the incident and the consequences (e.g. likelihood of death), but also the individual’s fractional exposure to that risk, i.e. the probability of the individual being in the given location at the time of the incident.
- The purpose of estimating the individual risk is to ensure that individuals who may be affected by the presence of the Array are not exposed to excessive risks. This is achieved by assessing the significance of the change in individual risk resulting from the presence of the Array relative to the UK background individual risk levels.
- Annual risk levels to crew (the annual risk to an average crew member) for different vessel types are presented in Figure C.1, which also includes the upper and lower bounds for risk acceptance criteria as suggested in IMO Maritime Safety Committee 72/16 (IMO, 2001). The annual individual risk level to crew falls within the ALARP region for each of the vessel types presented.
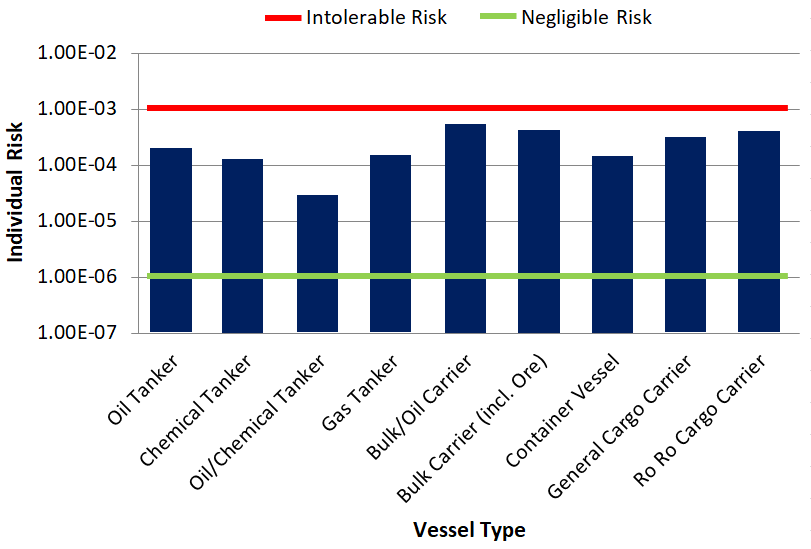
- The typical bounds defining the ALARP regions for decision making within shipping are presented in Table C.1. For a new vessel, the target upper bound for ALARP is set lower since new vessels are expected to benefit (in terms of design) from changes in legislation and improved maritime safety.
Individual | Lower Bound for ALARP | Upper Bound for ALARP |
|---|---|---|
To crew member | 10-6 | 10-3 |
To passenger | 10-6 | 10-4 |
Third-party | 10-6 | 10-4 |
New vessel target | 10-6 | Above values reduced by one order of magnitude |
- On a UK basis, individual risks for various UK industries based on HSE data from 1987 to 1991, historically available on the MCA website. The risks for different industries are presented in Figure C.2.
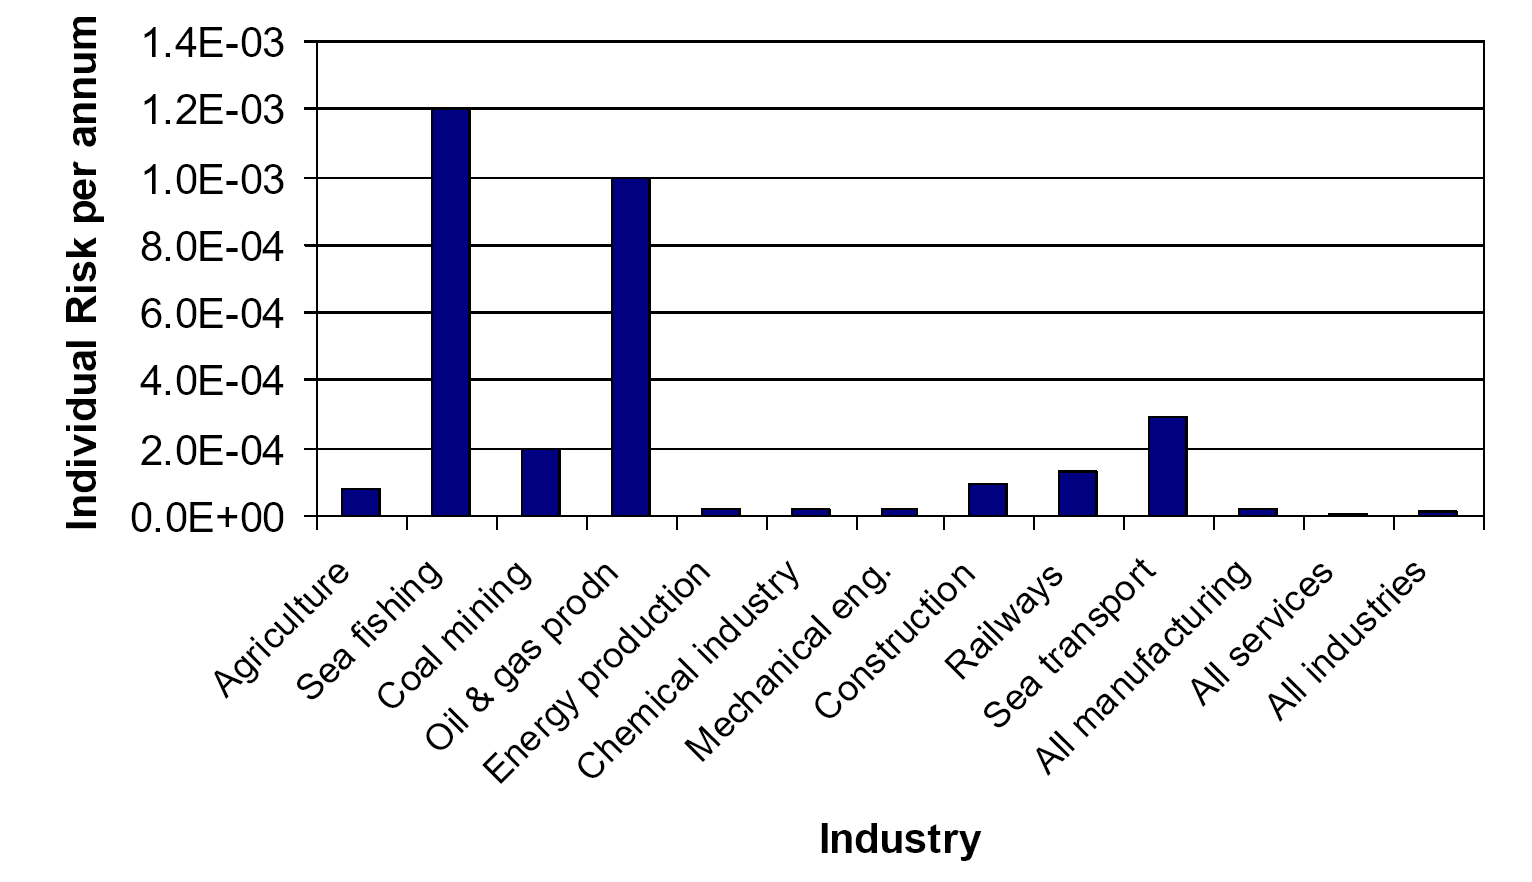
- The individual risk for sea transport of 2.9×10⁻⁴ per year is consistent with the worldwide data presented in Figure C.1, whilst the individual risk for sea fishing of 1.2×10⁻³ per year is the highest across all of the industries included.
- Societal Risk
- Societal risk is used to estimate risks of incidents affecting many persons (catastrophes) and acknowledging risk averse or neutral attitudes. Societal risk includes the risk to every person, even if a person is only exposed to risk on one brief occasion. For assessing the risk to a large number of affected people, societal risk is desirable because individual risk is insufficient in evaluating risks imposed on large numbers of people.
- Within this assessment, societal (navigation based) risk can be assessed for the Array, giving account to the change in risk associated with each incident scenario caused by the introduction of the Array structures. Societal risk may be expressed as:
- annual fatality rate where frequency and fatality are combined into a convenient one-dimensional measure of societal risk (also known as PLL); and
- F-N (frequency/consequence) diagrams showing explicitly the relationship between the cumulative frequency of an accident and the number of fatalities in a multi-dimensional diagram.
- When assessing societal risk, this study focuses on PLL, which accounts for the number of people likely to be involved in an incident (which is higher for certain vessel types) and assesses the significance of the change in risk compared to the UK background risk levels.
- For risk to the environment the key criteria considered in terms of the risk due to the Array is the potential quantity of oil spilled from a vessel involved in an incident.
- It is recognised that there will be other potential pollution, e.g. hazardous containerised cargoes; however, oil is considered the most likely pollutant and the extent of predicted oil spills is therefore worst case based on frequency and will provide an indication of the significance of pollution risk due to the Array compared to UK background pollution risk levels.
- Marine Accident Investigation Branch Incident Data
- All Incidents in UK Waters
Marine Accident Investigation Branch Incident Data All Incidents in UK Waters
- Marine Accident Investigation Branch Incident Data
- All British flagged commercial vessels are required to report incidents to the MAIB. Non-British flagged vessels do not have to report an incident to the MAIB unless located at a UK port or within 12 nm territorial waters and carrying passengers to a UK port. There are no requirements for non-commercial recreational craft to report incidents to the MAIB; however, a significant proportion of such incidents are reported to and investigated by the MAIB.
- The MCA, harbour authorities and inland waterway authorities also have a duty to report incidents to the MAIB. Therefore, whilst there may be a degree of underreporting of incidents with minor consequences, those resulting in more serious consequences, such as fatalities, are likely to be reported.
- Only incidents occurring in UK waters have been considered within this assessment for which the MAIB data is most comprehensive. It is also noted that incidents occurring in ports/harbours and rivers/canals have been excluded since the causes and consequences may differ considerably from an incident occurring offshore, which is the location of most relevance to the Array.
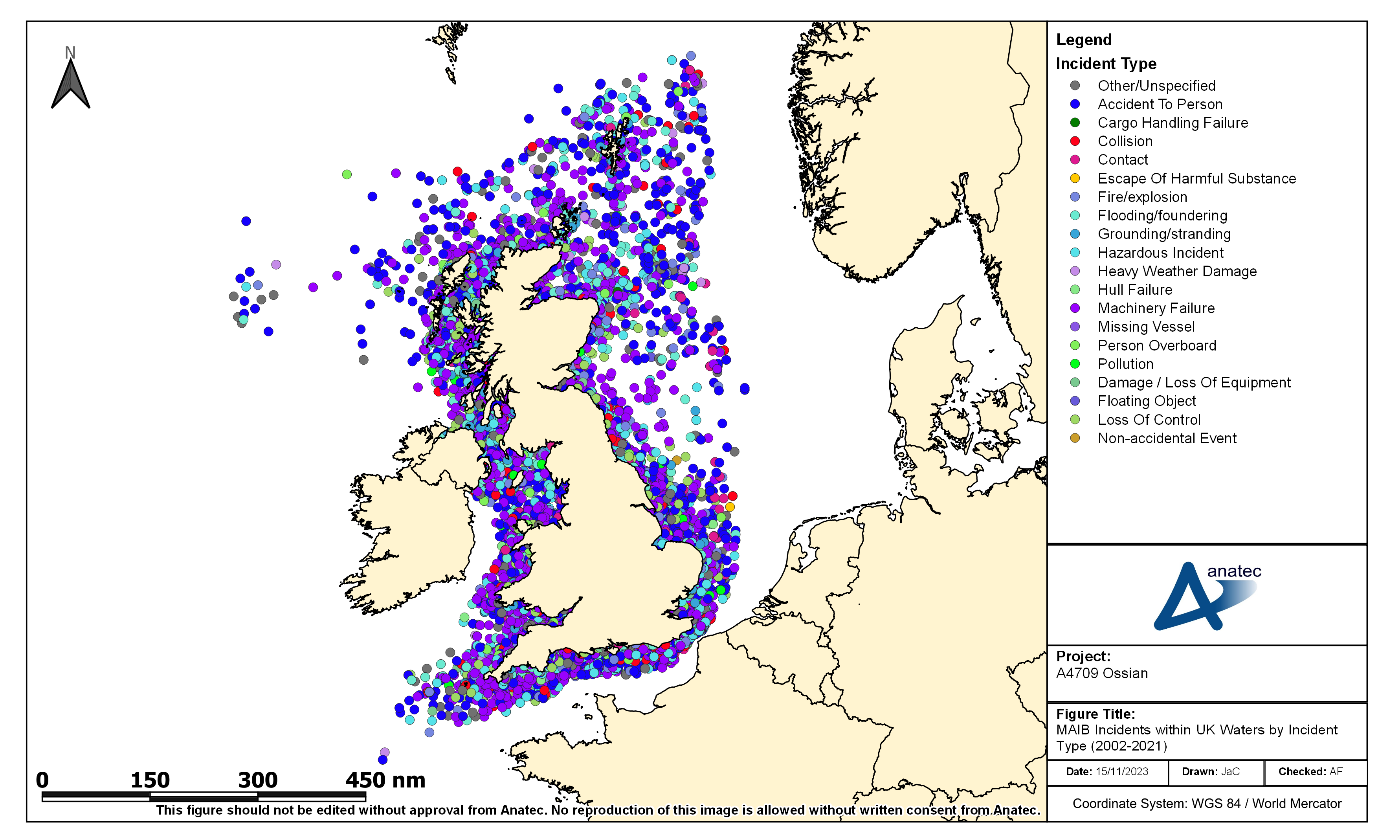
- Accounting for these criteria, a total of 11,773 accidents, injuries and hazardous incidents were reported to the MAIB in the 20-year period between 2002 and 2021 involving 13,415 vessels (some incidents, such as collisions, involved more than one vessel).
- The location of all incidents in proximity to the UK are presented in Figure C.3, colour-coded by incident type. The majority of incidents occur in coastal waters.
- The distribution of incidents by year in UK waters is presented in Figure C.4.
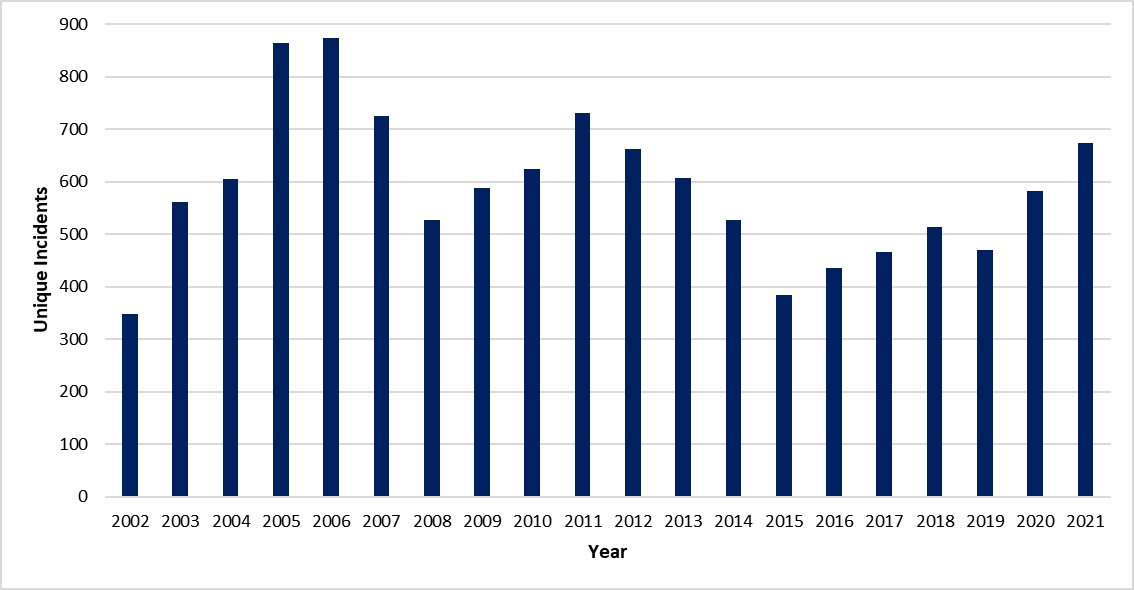
- The average number of unique incidents per year was 589. There has generally been a fluctuating trend in incidents over the 20-year period.
- The distribution of incidents in UK waters by incident type is presented in Figure C.5.
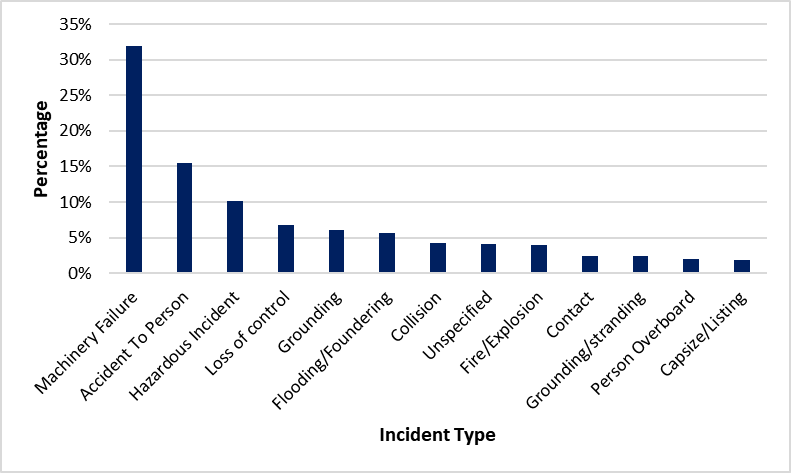
- The most frequent incident types were “machinery failure” (32%), “accident to person” (16%) and “hazardous incident” (10%). “Collision” and “contact” incidents represented 4% and 2% of total incidents, respectively.
- The distribution of incidents in UK waters by vessel type is presented in Figure C.6.
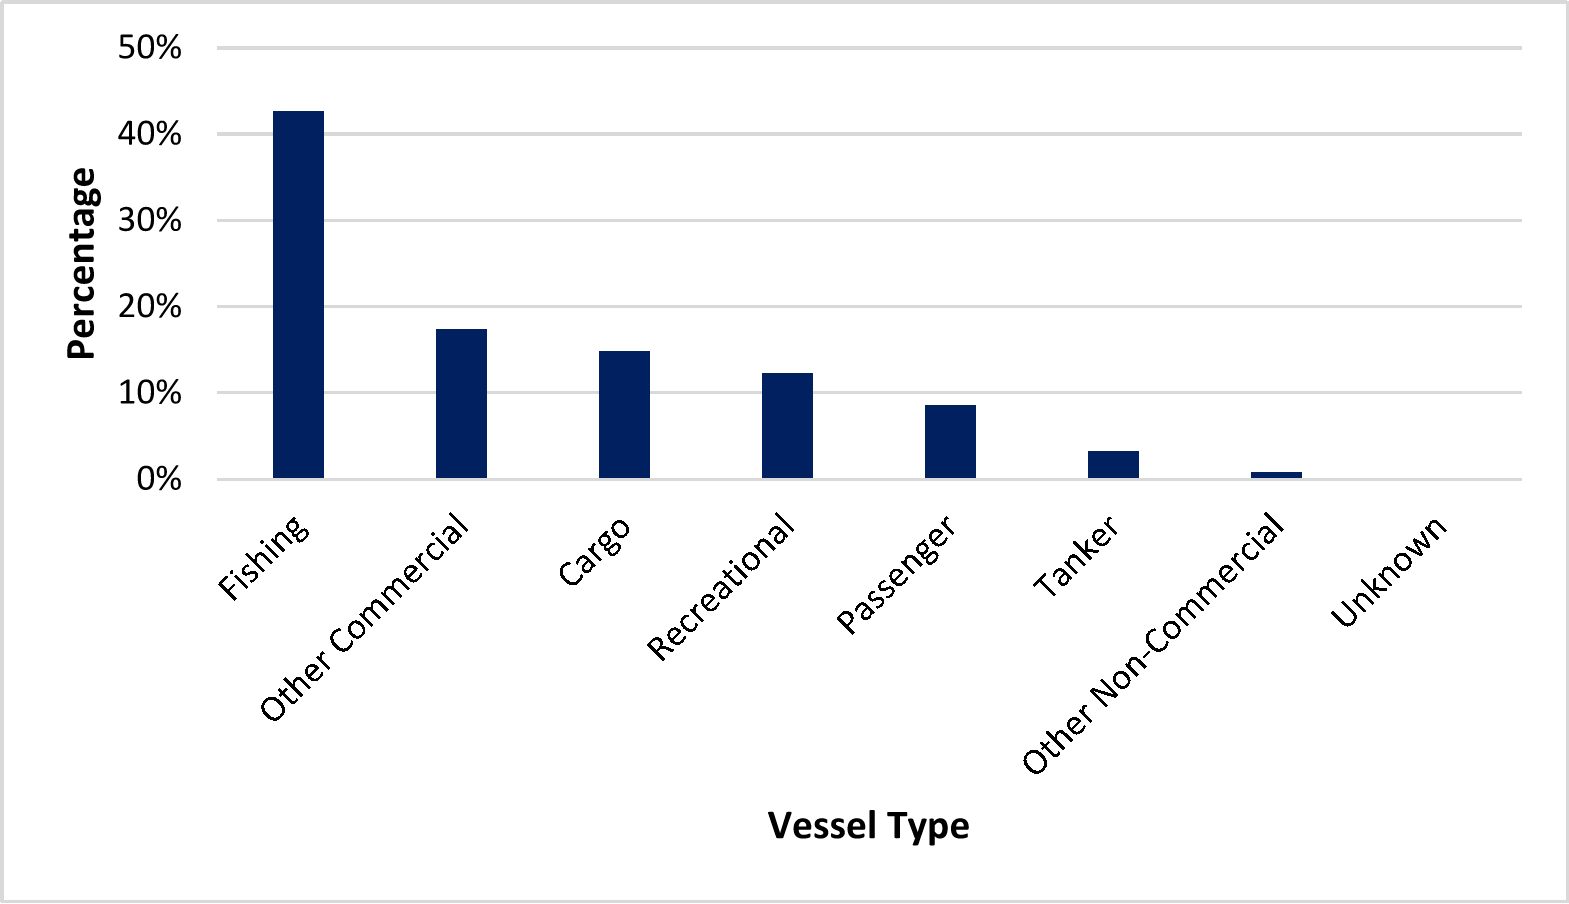
- The most frequent vessel types involved in incidents were fishing vessels (43%), other commercial vessels (17%) (including offshore industry vessels, tugs, workboats and pilot vessels) and cargo vessels (15%).
- A total of 414 fatalities were reported in the MAIB incidents within UK waters between 2002 and 2021, corresponding to an average of 21 fatalities per year.
- The distribution of fatalities in UK waters by vessel type and person category (crew, passenger and other) is presented in Figure C.7.
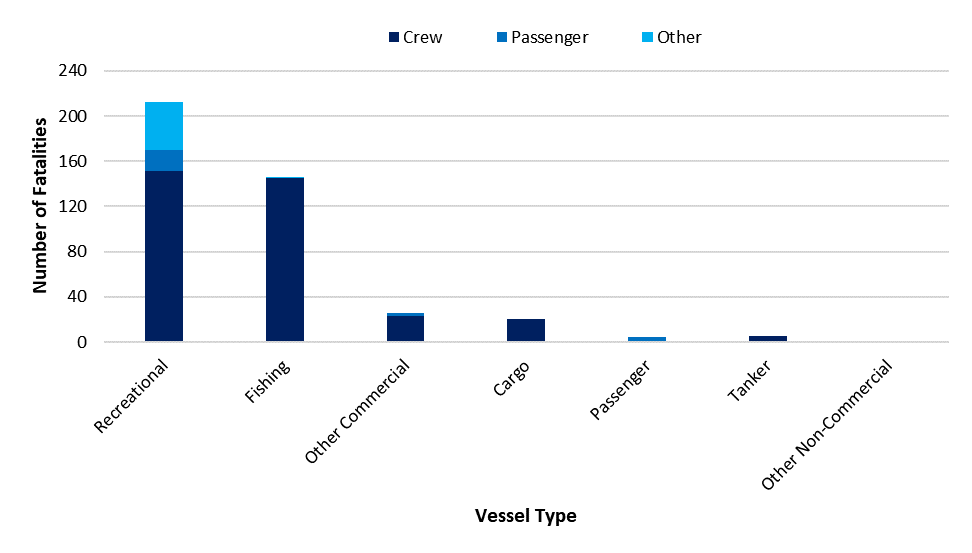
- The majority of fatalities occurred to recreational vessels (51%) and fishing vessels (35%), with crew members the main people involved (83%).
- The MAIB define a collision incident as “ships striking or being struck by another ship, regardless of whether the ships are underway, anchored or moored” (MAIB, 2013).
- A total of 504 collision incidents were reported to the MAIB in UK waters between 2002 and 2021 involving 1,068 vessels (in a small number of cases the other vessel involved was not logged).
- The locations of collision incidents reported in proximity to the UK are presented in Figure C.8.
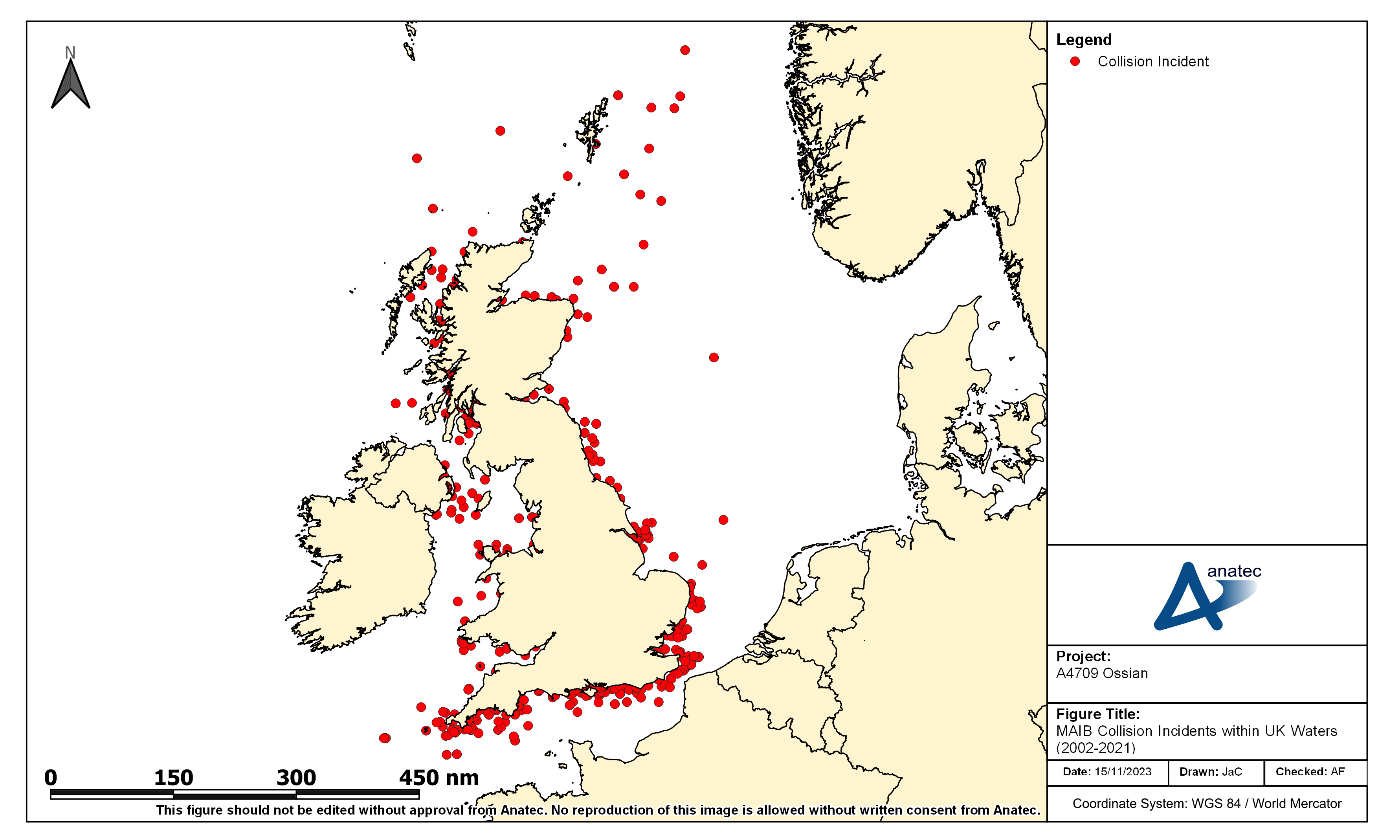
- The distribution of collision incidents per year is presented in Figure C.9.
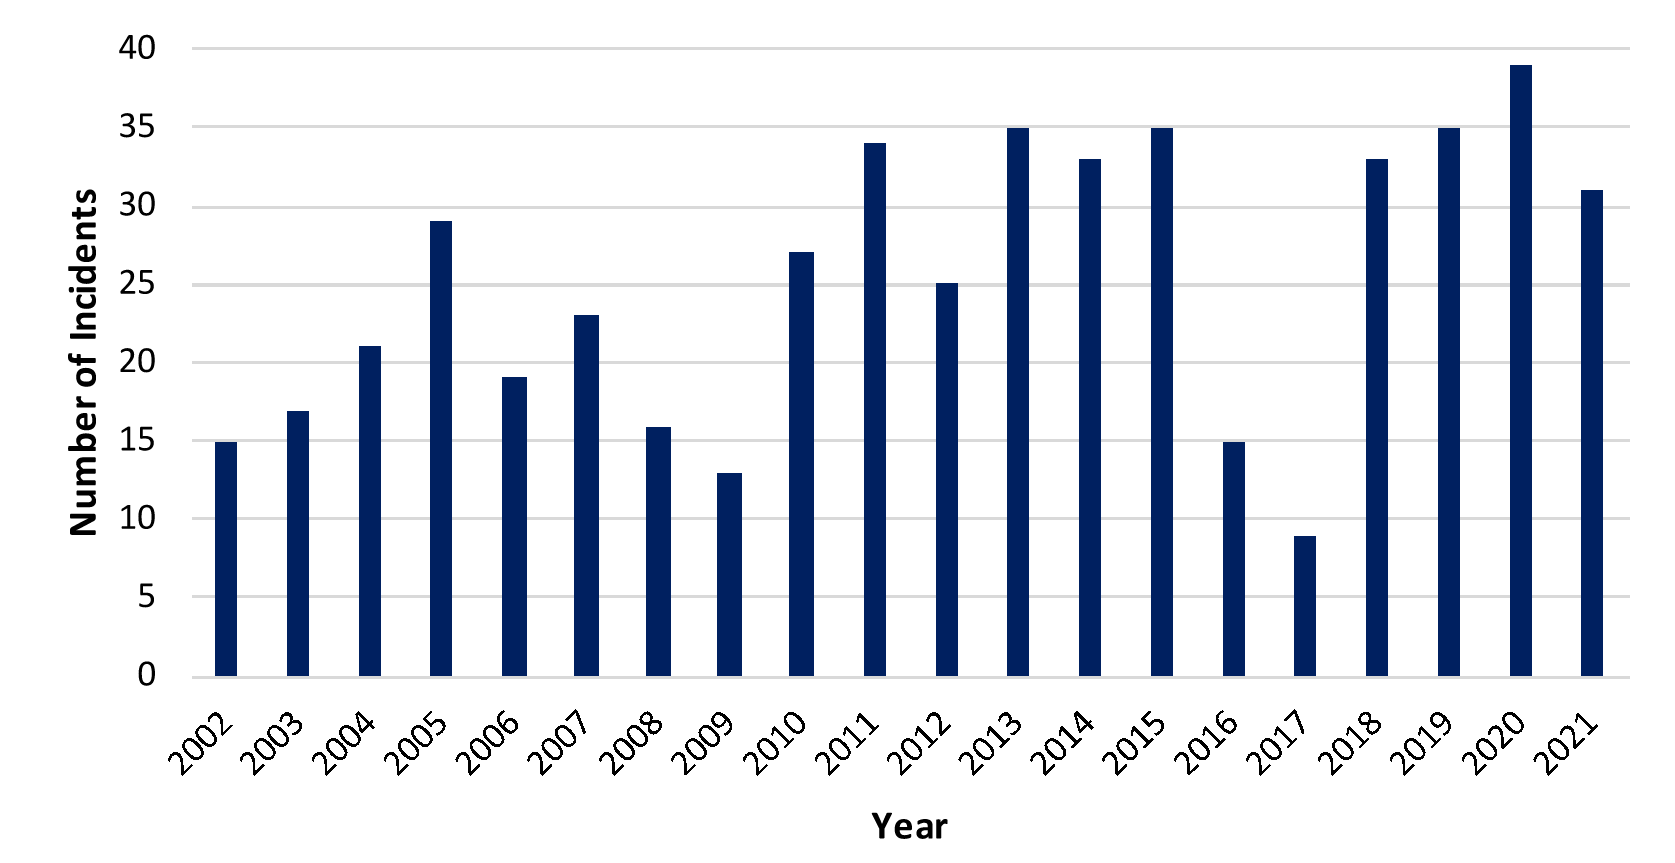
- The average number of collision incidents per year was 25. There has been an overall slight increasing trend in collision incidents over the 20-year period, which may be due to better reporting of less serious incidents in recent years.
- The distribution of vessel types involved in collision incidents is presented in Figure C.10.
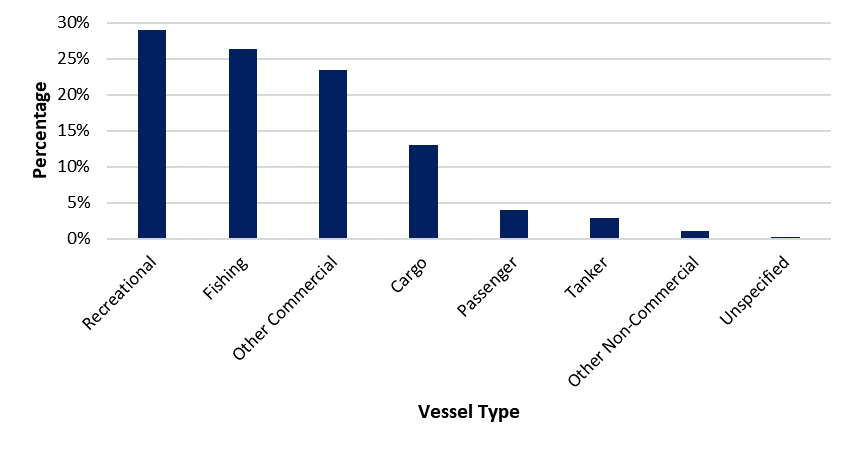
- The most frequent vessel types involved in collision incidents were recreational vessels (29%), fishing vessels (26%), other commercial vessels (24%) and cargo vessels (13%).
- A total of five fatalities were reported in MAIB collision incidents within UK waters between 2002 and 2021. Details of each of these fatal incidents reported by the MAIB are presented in Table C.2.
Date | Description | Fatalities |
|---|---|---|
July 2005 | Collision between two powerboats at night. Both vessels were unlit and both helmsmen had consumed alcohol. One of the helmsmen died. | 1 |
October 2007 | Collision between fishing vessel and coastal general cargo vessel following failure to keep an effective lookout. Fishing vessel sank with three of the four crew members abandoning ship into a life raft but the fourth crew member was not recovered. | 1 |
August 2010 | Collision between passenger ferry and fishing vessel. Fishing vessel sank with one of the two crew members recovered from the sea but the other member was not recovered despite an extensive search. | 1 |
June 2015 | Collision between Rigid-hulled Inflatable Boat (RIB) and yacht. Believed that around a dozen persons were onboard the motorboat with the majority taken ashore by lifeboat. One person seriously injured and airlifted to hospital before being pronounced dead later. | 1 |
June 2018 | Collision between power boats during a race. One of the vessels overturned with the pilot pronounced dead at the scene. | 1 |
- Allision Incidents
- The MAIB define a contact incident as “ships striking or being struck by an external object. The objects can be: floating object (cargo, ice, other or unknown); fixed object, but not the sea bottom; or flying object” (MAIB, 2013). In line with the NRA as a whole, an allision is considered to involve a moving object and a stationary object at sea, with port infrastructure excluded from consideration; the MAIB contact incidents have been individually inspected and filtered in line with the NRA definition.
- A total of 119 allision incidents were reported to the MAIB within UK waters between 2002 and 2021 involving 119 vessels.
- The locations of allision incidents reported in proximity to the UK are presented in Figure C.11.
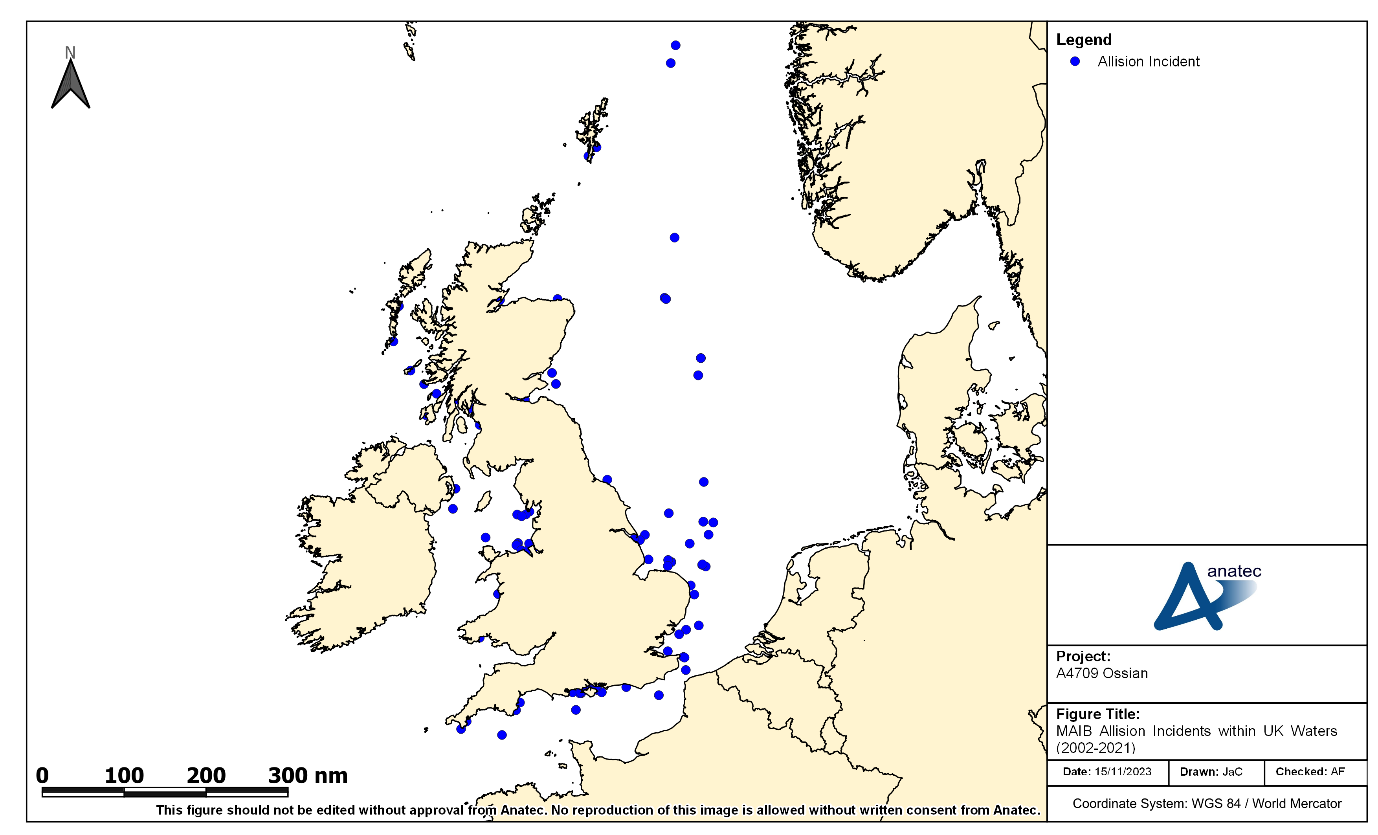
- The distribution of allision incidents per year is presented in Figure C.12.
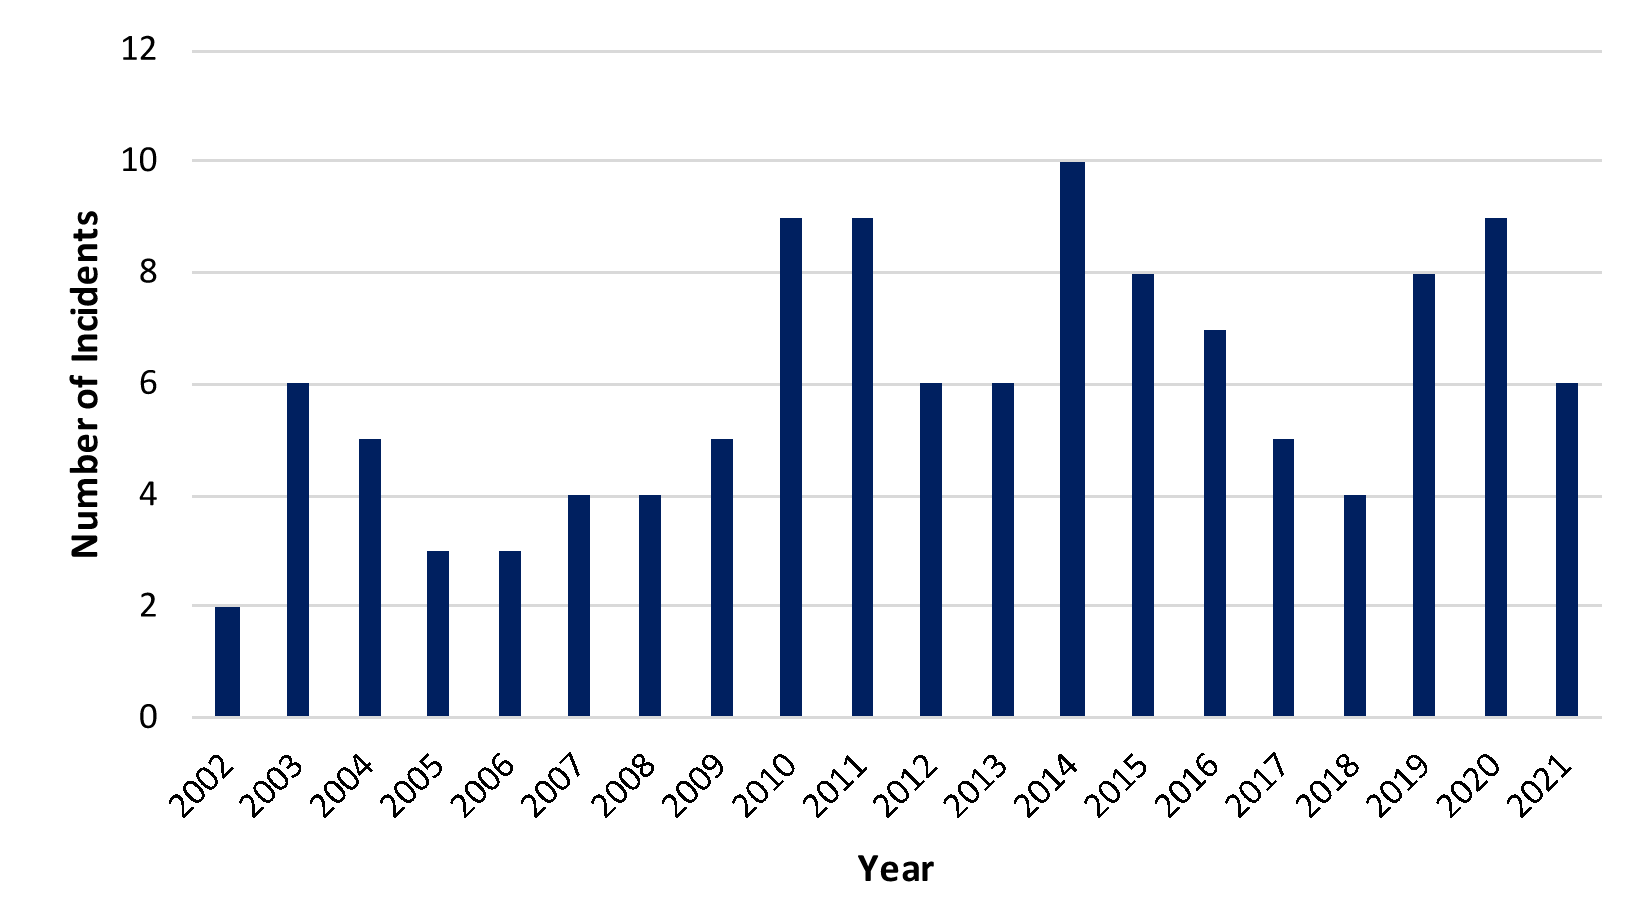
- The average number of allision incidents per year was six. As with collision incidents, there has been an overall slight increasing trend in allision incidents over the 20-year period, which may be due to better reporting of less serious incidents in recent years.
- The distribution of vessel types involved in allision incidents is presented in Figure C.13.
- The most frequent vessel types involved in allision incidents were other commercial vessels (50%), recreational vessels (18%) and fishing vessels (15%).
- No fatalities were reported in MAIB allision incidents within offshore UK waters between 2002 and 2021.
- Fatality Risk
- Incident Data
Fatality Risk Incident Data
- Fatality Risk
- This section uses the MAIB incident data along with information on average manning levels per vessel type to estimate the probability of a fatality in a maritime incident associated with the Array.
- The Array is assessed to have the potential to affect the following incidents:
- vessel to vessel collision;
- powered vessel to structure allision;
- drifting vessel to structure allision; and
- fishing vessel to structure allision.
- Of these incident types, only vessel to vessel collisions match the MAIB definition of collisions and hence the fatality analysis presented in section C.2.2 is considered directly applicable to these types of incidents.
- The other scenarios of powered vessel to structure allision, drifting vessel to structure allision and fishing vessel to structure allision are not clearly represented by the MAIB data (as discussed in section C.3.2). Additionally, none of the allision incidents reported by the MAIB between 2002 and 2021 resulted in a fatality.
- Therefore, the MAIB collision fatality risk rate has also been conservatively applied for the allision incident types.
- Five of the 504 collision incidents reported by the MAIB within UK waters between 2002 and 2021 resulted in one or more fatalities. This gives a 0.99% probability that a collision incident will lead to a fatal accident.
- To assess the fatality risk for personnel onboard a vessel (crew, passenger or other) the number of persons involved in the incidents needs to be estimated. Table C.3 presents the average number of POB estimated for each category of vessel navigating in proximity to the Array. For passenger vessels this is based upon information available for the specific vessels recorded in the vessel traffic survey data. For other vessel categories, this is based upon information available from the MAIB incident data.
Vessel Category | Sub Categories | Source of Estimated Average POB | Estimated Average POB |
|---|---|---|---|
Cargo/freight | Dry cargo, other commercial, service ship, etc. | MAIB incident data | 15 |
Tanker | Tanker/combination carrier | MAIB incident data | 23 |
Passenger | Roll Roll Off Passenger, cruise liner, etc. | Vessel traffic survey data / online information | 1,952 |
Fishing | Trawler, potter, dredger, etc. | MAIB incident data | 3.3 |
Recreational | Yacht, small commercial motor yacht, etc. | MAIB incident data | 3.3 |
- It is recognised that these average POB numbers can be substantially higher or lower on an individual vessel basis depending upon the size, subtype, etc. but applying reasonable averages is considered sufficient for this analysis, particularly when noting that the average POB for the dominant vessel category (passenger) is based upon the vessel traffic survey data where possible.
- Using the average POB, along with the vessel type information involved in collision incidents reported by the MAIB (see section C.2.2), there was an estimated 86,746 POB the vessels involved in the collision incidents.
- Based upon five fatalities during the period 2002 to 2021, the overall fatality probability in a collision for any individual onboard is approximately 5.76×10⁻⁵ per collision.
- It is considered inappropriate to apply this rate uniformly as the statistics indicate that the fatality probability associated with smaller craft, such as fishing vessels and recreational vessels, is higher. Therefore, the fatality probability has been subdivided into three categories of vessel as presented in Table C.4. In addition, due to zero fatalities resulting from commercial vessel collisions between 2002 and 2021, the time period used to assess the fatality probability for commercial vessels has been extended by five years to ensure a meaningful probability is captured.
Vessel Category | Sub Categories | Fatalities | People Involved | Fatality Probability | Time Period |
|---|---|---|---|---|---|
Commercial | Dry cargo, passenger, tanker, etc. | 1 | 84,796 | 1.18×10⁻⁵ | 1997 to 2021 (25 years) |
Fishing | Trawler, potter, dredger, etc. | 2 | 927 | 2.2×10⁻³ | 2002 to 2021 (20 years) |
Recreational | Yacht, small commercial motor yacht, etc. | 3 | 1,023 | 2.9×10⁻³ | 2002 to 2021 (20 years) |
- Fatality Risk Due to the Array
- The base case and future case annual collision frequency levels pre and post wind farm for the Array are summarised in Table C.5.
Risk | Scenario | Annual Frequency | ||
|---|---|---|---|---|
Pre Wind Farm | Post Wind Farm | Increase | ||
Vessel to vessel collision | Base case | 4.14×10⁻⁴ (1 in 2,418 years) | 5.42×10⁻⁴ (1 in 1,845 years) | 1.28×10⁻⁴ |
Future case (10%) | 5.45×10⁻⁴ (1 in 1,835 years) | 7.28×10⁻⁴ (1 in 1,374 years) | 1.83×10⁻⁴ | |
Future case (20%) | 6.33×10⁻⁴ (1 in 1,580 years) | 8.41×10⁻⁴ (1 in 1,188 years) | 2.09×10⁻⁴ | |
Powered vessel to structure allision | Base case | - | 6.91×10⁻³ (1 in 145 years) | - |
Future case (10%) | - | 7.60×10⁻³ (1 in 132 years) | - | |
Future case (20%) | - | 8.29×10⁻³ (1 in 121 years) | - | |
Drifting vessel to structure allision | Base case | - | 2.16×10⁻⁴ (1 in 4,619 years) | - |
Future case (10%) | - | 2.38×10⁻⁴ (1 in 4,199 years) | - | |
Future case (20%) | - | 2.60×10⁻⁴ (1 in 3,849 years) | - | |
Fishing vessel to structure allision | Base case | - | 4.08×10⁻² (1 in 24 years) | - |
Future case (10%) | - | 4.49×10⁻² (1 in 22 years) | - | |
Future case (20%) | - | 4.90×10⁻² (1 in 20 years) | - | |
Total | Base case | 4.14×10⁻⁴ (1 in 2,418 years) | 4.85×10⁻² (1 in 21 years) | 4.81×10⁻² |
Future case (10%) | 5.45×10⁻⁴ (1 in 1,835 years) | 5.35×10⁻² (1 in 19 years) | 5.30×10⁻² | |
Future case (20%) | 6.33×10⁻⁴ (1 in 1,580 years) | 5.84×10⁻² (1 in 17 years) | 5.78×10⁻² | |
- From the detailed results of the collision and allision risk modelling, the distribution of the predicted change in annual collision and allision frequency by vessel type due to the Array for the base case and future case are presented in Figure C.14.
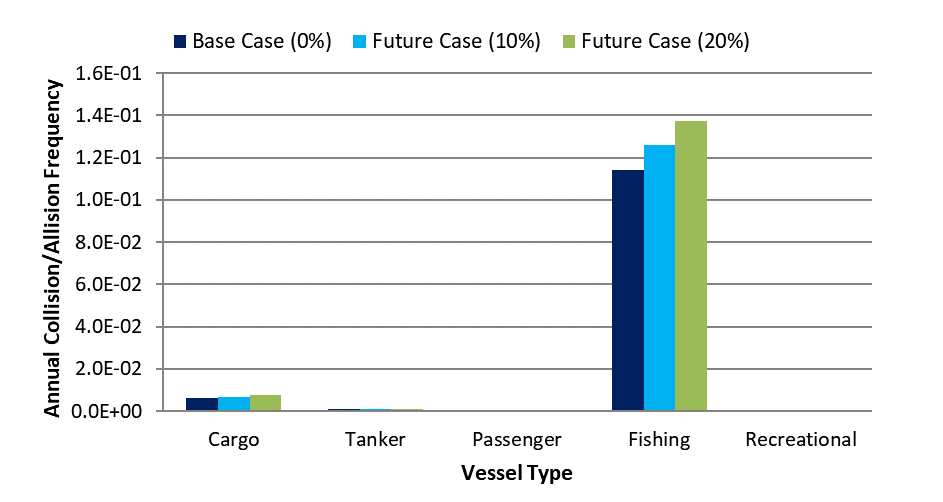
- It can be seen that the change in collision and allision frequency is dominated by fishing vessels, however this is mainly due to the high conservatism of the fishing allision model (see section 15.4.5). Cargo vessels had the next largest change in collision and allision frequency (likely due to their higher volume in terms of vessel numbers compared to the other vessel types).
- Combining the annual collision and allision frequency (see Table C.5), estimated number of POB for each vessel type (see Table C.3) and the estimated fatality probability for each vessel type category (see Table C.4), the annual increase in PLL due to the presence of the Array for the base case is estimated to be 7.74×10⁻⁴, equating to one additional fatality every 1,292 years.
- The estimated incremental increases in PLL due to the Array, distributed by vessel type and for the base case and future case, are presented in Figure C.15.
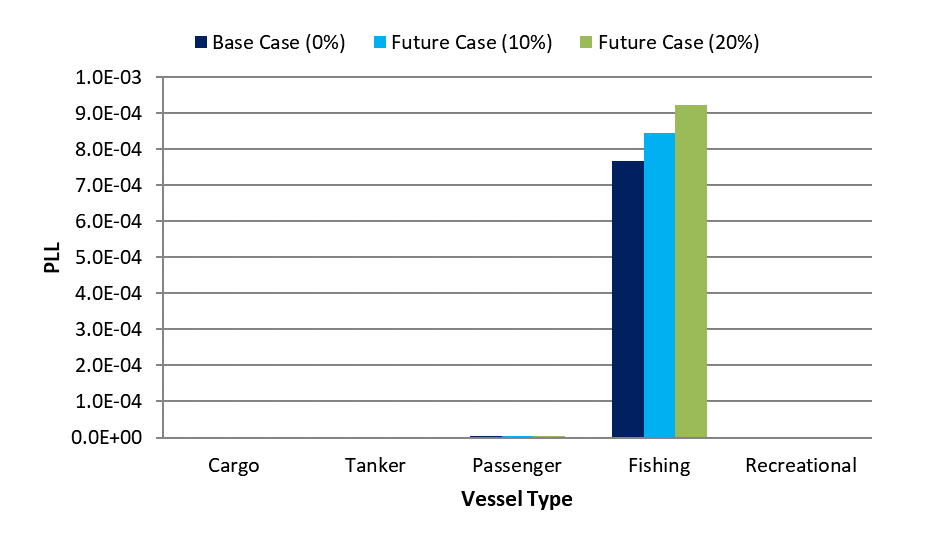
- As with the change in collision and allision frequency, the change in annual PLL is dominated by fishing vessels which historically have a higher fatality probability than commercial vessels.
- Converting the PLL to individual risk based upon the average number of people exposed by vessel type, the results are presented in Figure C.16.
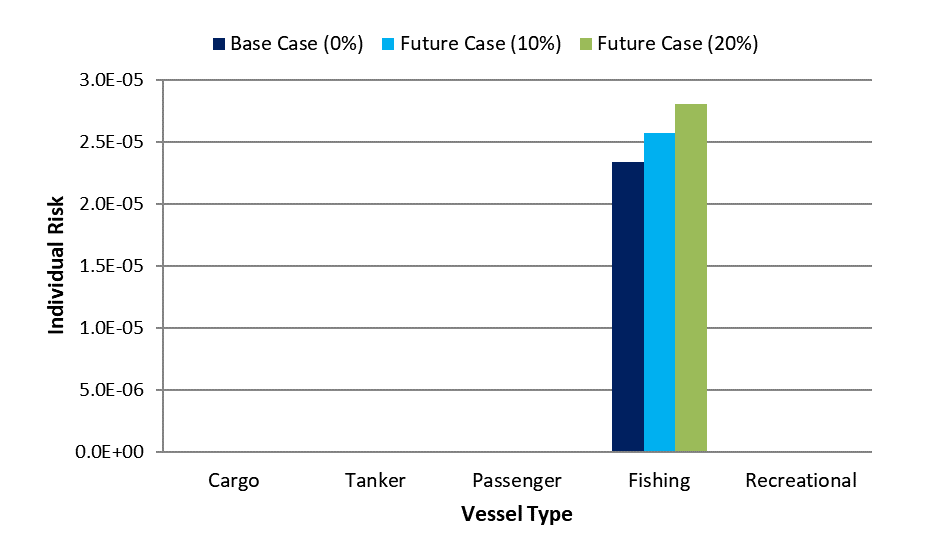
- It can be seen that the individual risk to people is dominated by fishing vessels, reflecting the higher probability of a fatality occurring in the event of an incident involving a fishing vessel in comparison to other vessel types.
- In comparison to MAIB statistics, which indicate an average of 18 to 19 fatalities per year in UK territorial waters during the 20-year period between 2002 and 2021, the overall increase for the base case in PLL of one additional fatality per 1,292 years represents a negligible change.
- In terms of individual risk to people, the change for commercial vessels attributed to the Array (approximately 8.86×10⁻⁹ for the base case) is negligible compared to the background risk level for the UK sea transport industry of 2.9×10⁻⁴ per year.
- For fishing vessels, the change in individual risk attributed to the Array (approximately 2.33×10⁻⁵ for the base case) is low compared to the background risk level for the UK sea fishing industry of 1.2×10⁻³ per year.
- Pollution Risk
Pollution Risk Historical Analysis
- The pollution consequences of a collision in terms of oil spill depend upon the following criteria:
- spill probability (i.e. the likelihood of outflow following an incident); and
- spill size (quantity of oil).
- Two types of oil spill are considered in this assessment:
- fuel oil spills from bunkers (all vessel types); and
- cargo oil spills (laden tankers).
- The research undertaken as part of the DfT’s MEHRAs project (DfT, 2001) has been used as it was comprehensive and based upon worldwide marine oil spill data analysis. From this research, the overall probability of a spill per incident was calculated based upon historical incident data for each incident type as presented in Figure C.17.
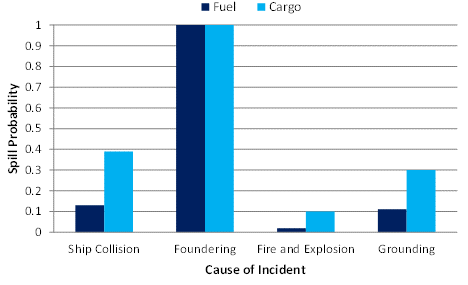
- Therefore, it was estimated that 13% of vessel collisions result in a fuel oil spill and 39% of collisions involving a laden tanker result in a cargo oil spill.
- In the event of a bunker spill, the potential outflow of oil depends upon the bunker capacity of the vessel. Historical bunker spills from vessels have generally been limited to a size below 50% of bunker capacity, and in most incidents much lower.
- For the types and sizes of vessels exposed to the Array, an average spill size of 100 tonnes of fuel oil is considered a conservative assumption.
- For cargo spills from laden tankers, the spill size can vary significantly. The ITOPF reported the following spill size distribution for tanker collisions between 1974 and 2004 (ITOPF, 2023):
- 31% of spills below seven tonnes;
- 52% of spills between seven and 700 tonnes; and
- 17% of spills greater than 700 tonnes.
- Based upon this data and the tankers transiting in proximity to the Array, an average spill size of 400 tonnes is considered a conservative assumption.
- For fishing vessel collisions, comprehensive statistical data is not available. Consequently, it is conservatively assumed that 50% of all collisions involving fishing vessels will lead to oil spill with the quantity spilled being on average five tonnes. Similarly for recreational vessels, due to a lack of data 50% of collisions are conservatively assumed to lead to a spill with an average size of one tonne.
- Pollution Risk Due to the Array
- Applying the above probabilities to the annual collision and allision frequency by vessel type presented in Table C.5 and the average spill size per vessel, the amount of oil spilled per year due to the impact of the Array is estimated to be 0.52 tonnes per year for the base case, 0.57 tonnes per year for the 10% future case and 0.62 tonnes per year for the 20% future case.
- The estimated increase in tonnes of oil spilled, distributed by vessel type, for the base case and future case are presented in Figure C.18.
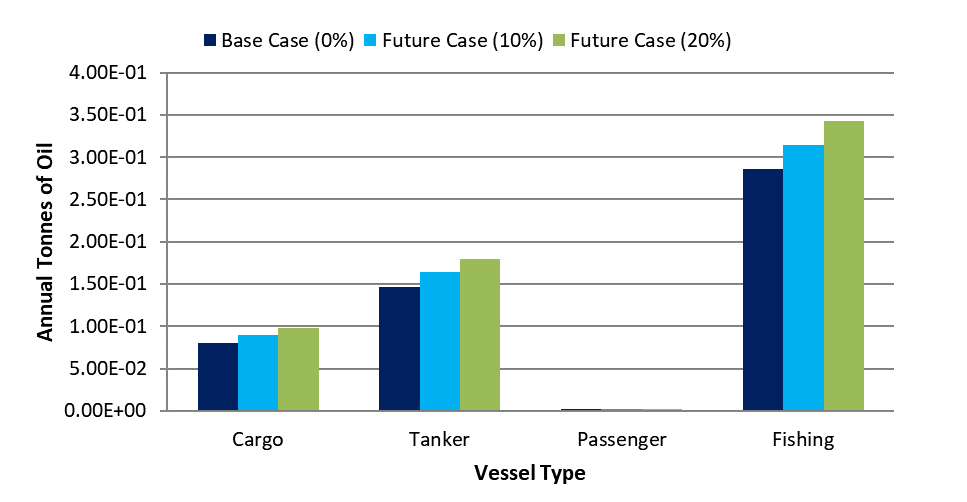
- The annual oil spill results are dominated by fishing vessels due to their high associated annual collision and allision frequency. Tankers and cargo vessels also contribute significantly to the annual oil spill estimate, which reflects the greater volume of oil spillage anticipated per incident involving tankers.
- Significance of Increase in Pollution Risk
- To assess the significance of the increased pollution risk from vessels caused by the Array, historical oil spill data for the UK has been used as a benchmark.
- From the MEHRAs research (DfT, 2001), the annual average tonnes of oil spilled in UK waters due to maritime incidents in the ten year period from 1989 to 1998 was 16,111. This is based upon a total of 146 reported oil pollution incidents of greater than one tonne (smaller spills are excluded as are incidents which occurred within port or harbour areas or resulting from operational errors or equipment failure). Commercial vessel spills accounted for approximately 99% of the total while fishing vessel incidents accounted for less than 1%.
- The overall increase in pollution estimated due to the Array of 0.52 tonnes for the base case represents a 0.003% increase compared to the historical average pollution quantities from maritime incidents in UK waters.
- Conclusion
Conclusion
- This appendix has quantitively assessed the fatality and pollution risk associated with the Array in the event of a collision or allision incident occurring. The assessment indicates that the fatality and pollution risk associated with fishing vessels is greatest.
- Overall, the impact of the Array on people and the environment is relatively low compared to the existing background risk levels in UK waters. However, this is the localised impact of a single offshore wind farm development and there will be additional maritime risks associated with other offshore wind farm developments in the North Sea and the UK as a whole.
- Regular Operator Consultation
Regular Operator Consultation
- As part of the consultation process for the Array, regular vessel operators identified (from the vessel traffic survey data) that may be required to deviate their routes due to the Array were consulted via electronic mail. An example of the correspondence sent to the Regular Operators is presented below.
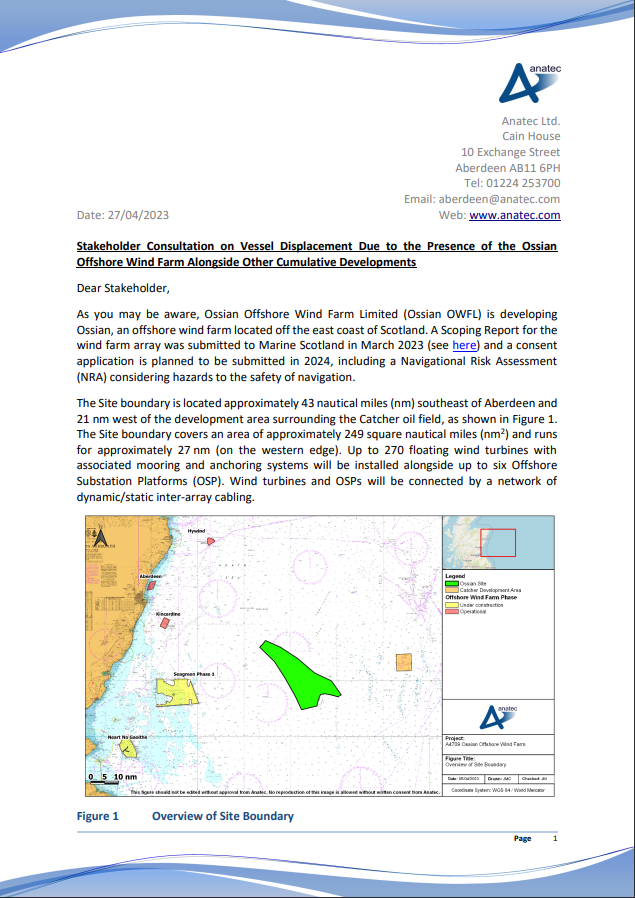
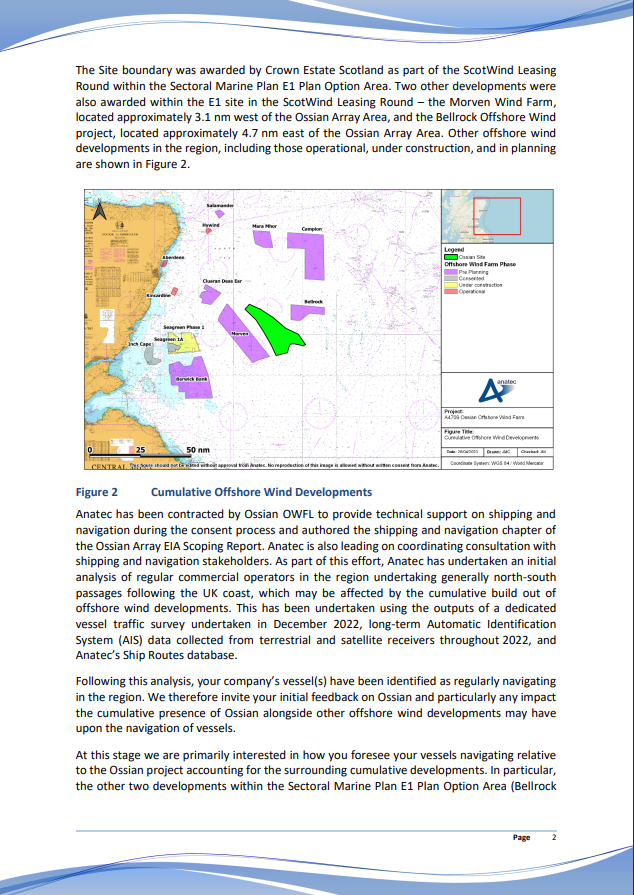
- Long-Term Vessel Traffic Movements
- Introduction
Introduction
Long-Term Vessel Traffic Movements Introduction
- This appendix assesses additional long-term vessel traffic data for Array. As required under MGN 654 (MCA, 2021), the NRA and volume 2, chapter 13 of the Array EIA Report consider 28 days of AIS, Radar and visual observation data as the primary vessel traffic data source. However, it should be considered that studying a 28-day period in isolation may exclude certain activities or periods of pertinence to shipping and navigation. Therefore, in line with good practice assessment procedures, this NRA has also considered a longer-term dataset covering all of 2022 to ensure a comprehensive characterisation of vessel traffic movements can be established, including the capture of any seasonal variation.
- This approach (i.e. the use of both short- and long-term data) has been agreed with the MCA and NLB.
- Aims and Objectives
Aims and Objectives
- The key aims and objectives of this appendix are as follows:
- identify seasonal variations in vessel traffic via assessment of the long-term vessel traffic data;
- determine which variations are not reflected within the short-term vessel traffic survey data (and therefore should be fed into the NRA baseline); and
- assess which dataset (long-term/survey or combination of both) should be utilised for each key NRA element that requires vessel traffic data input.
- Methodology
Methodology Study Area
- This appendix has assessed the long-term vessel traffic data within the shipping and navigation study area for the site boundary as defined in section 3.4.
- Data Period and Temporary Vessel Traffic
- The long-term vessel traffic data was collected from coastal and satellite AIS receivers for the entirety of 2022 (01 January to 31 December).
- As per the vessel traffic surveys, a number of vessel tracks recorded during the data period were classified as temporary (non-routine) and have been excluded from the characterisation of the vessel traffic baseline, including vessels involved in surveys, guard work or construction.
- General limitations associated with the use of AIS data (for example, carriage requirements) are discussed in full within section 5.4.1.
- AIS Coverage
- AIS coverage is affected by downtime where the source receivers are unavailable. Since both terrestrial and satellite receivers have been used, complete downtime (where all terrestrial and satellite sources indicated that no vessels were present which may indicate either downtime or genuine lack of vessel presence) is limited to 2% of the data period. However, there is potential for partial loss of coverage, particularly for areas further offshore.
- Long-Term AIS Assessment
Long-Term AIS Assessment Vessel Traffic Overview
- An overview of all AIS vessel data recorded within the shipping and navigation study area during 2022, excluding temporary traffic and colour-coded by vessel type, is presented in Figure E.1. Following this, Figure E.2 presents the same vessel traffic as a density heat-map.
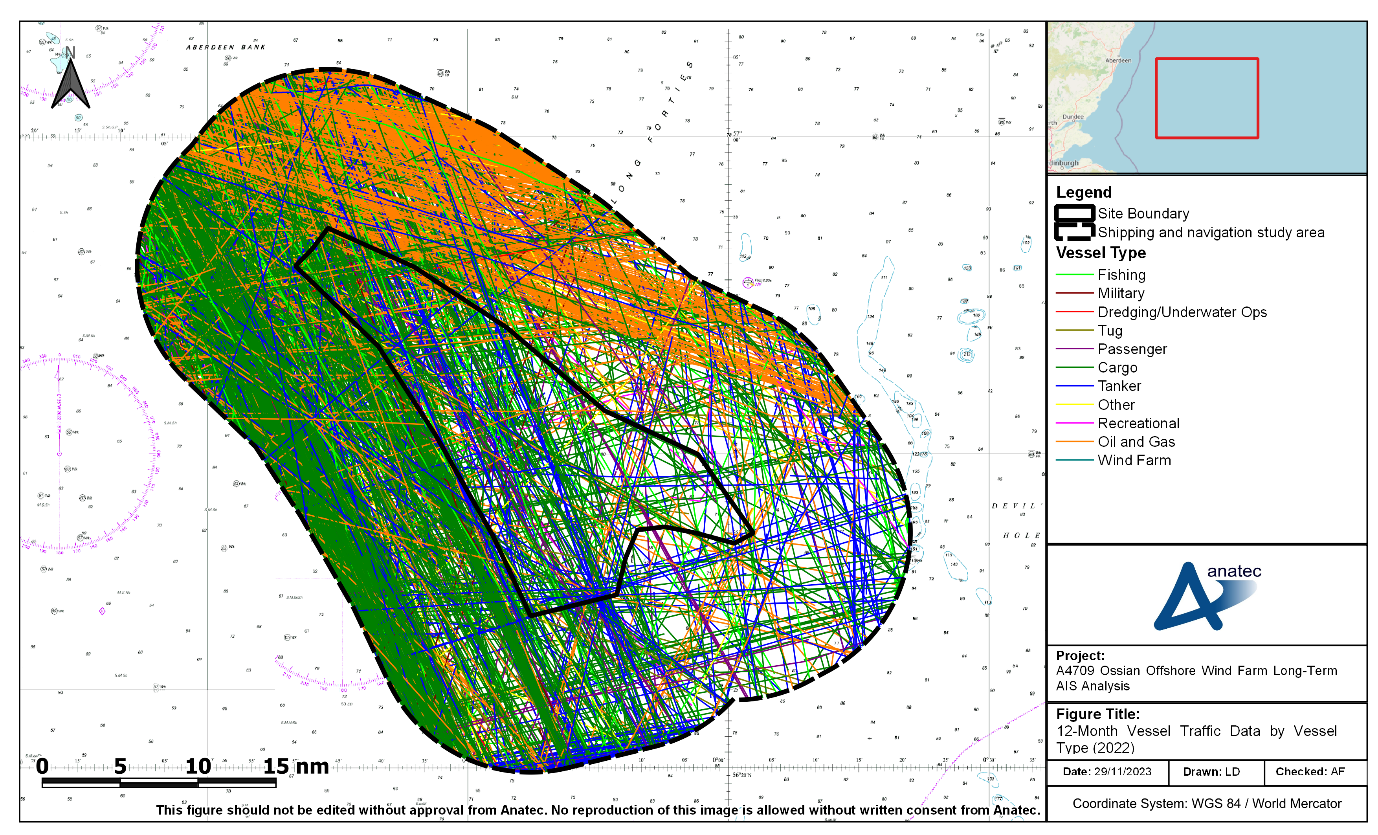
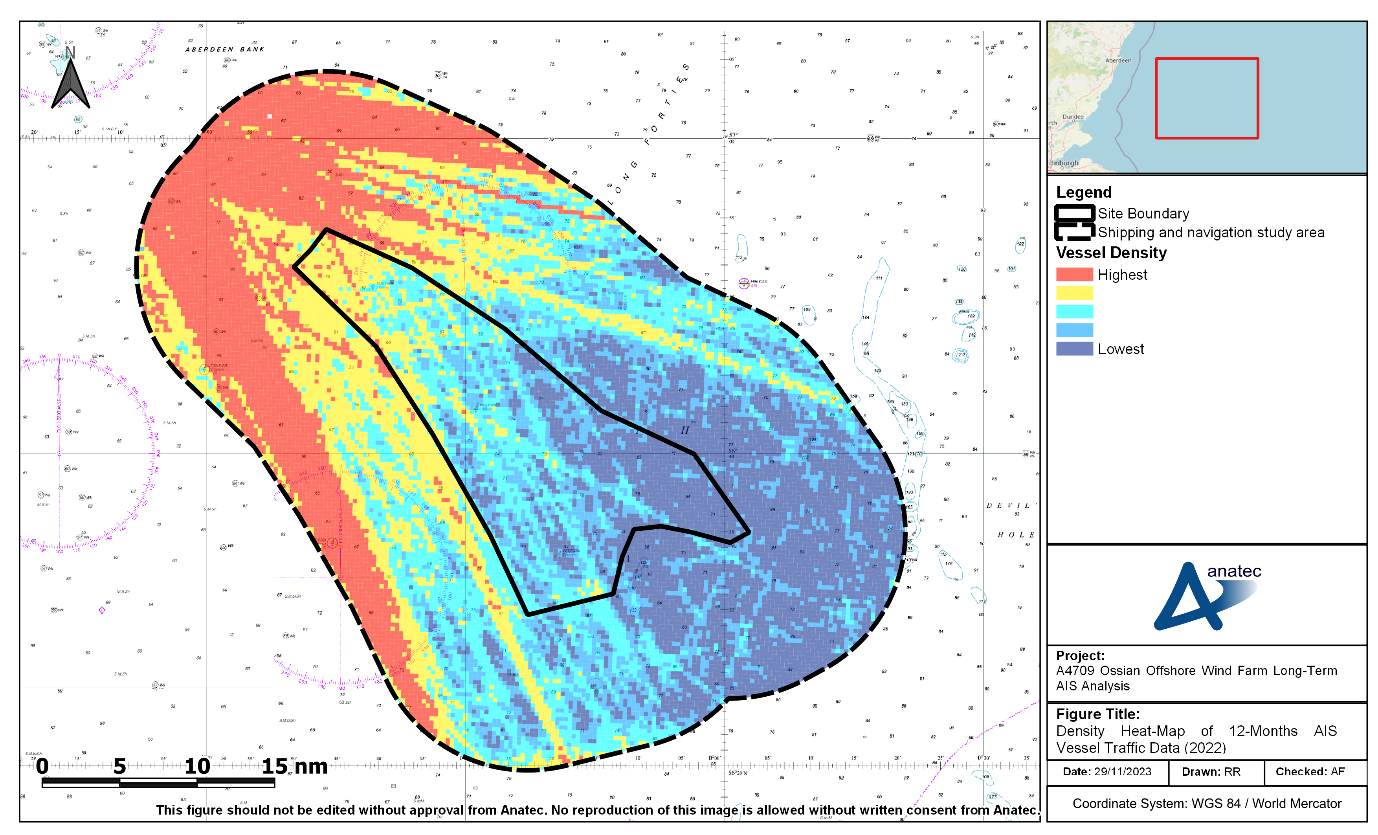
- The average number of unique vessels recorded per day for each month of 2022 within the shipping and navigation study area is presented in Figure E.3.
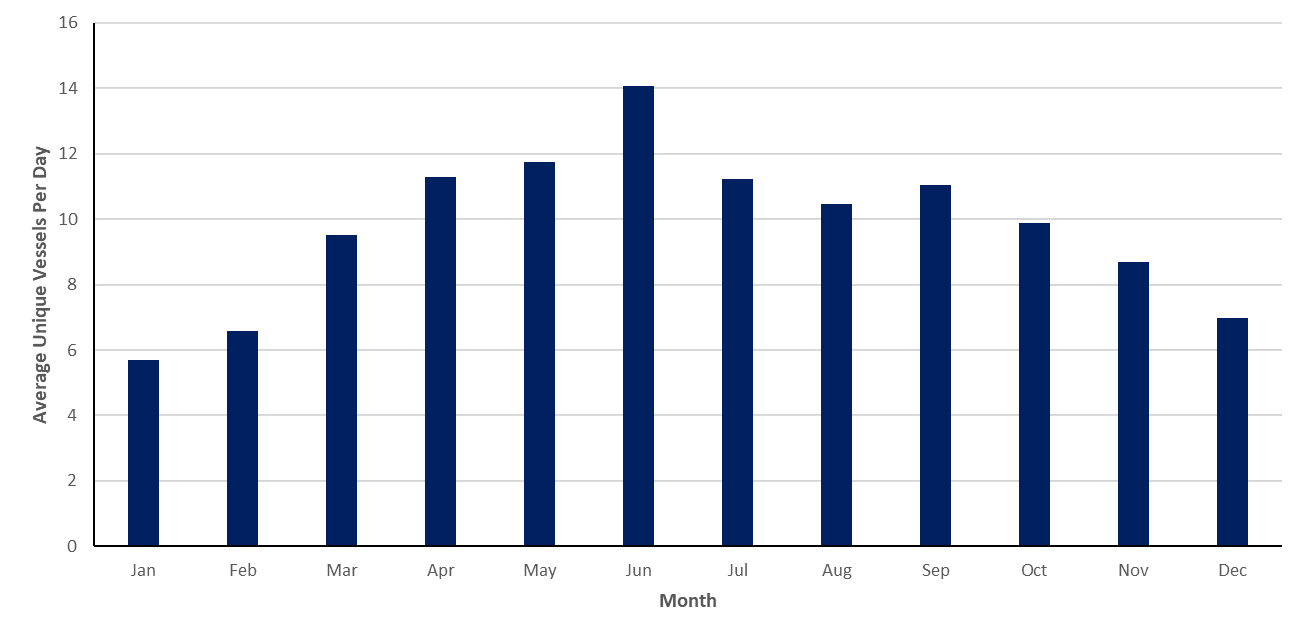
- An average of nine to ten unique vessels per day were recorded within the shipping and navigation study area during 2022. The busiest month for vessel traffic was June 2022, where approximately 14 unique vessels per day were recorded within the shipping and navigation study area. The quietest month was January 2022, with approximately six unique vessels per day recorded within the shipping and navigation study area. There were two individual days across 2022 where no vessels were recorded within the shipping and navigation study area which were the 07 January 2022 and 05 March 2022. The busiest day was the 02 June 2022 with 21 unique vessels within the shipping and navigation study area.
- The vessel traffic from the busiest and quietest months, colour-coded by vessel type, are presented in Figure E.4 and Figure E.5, respectively.
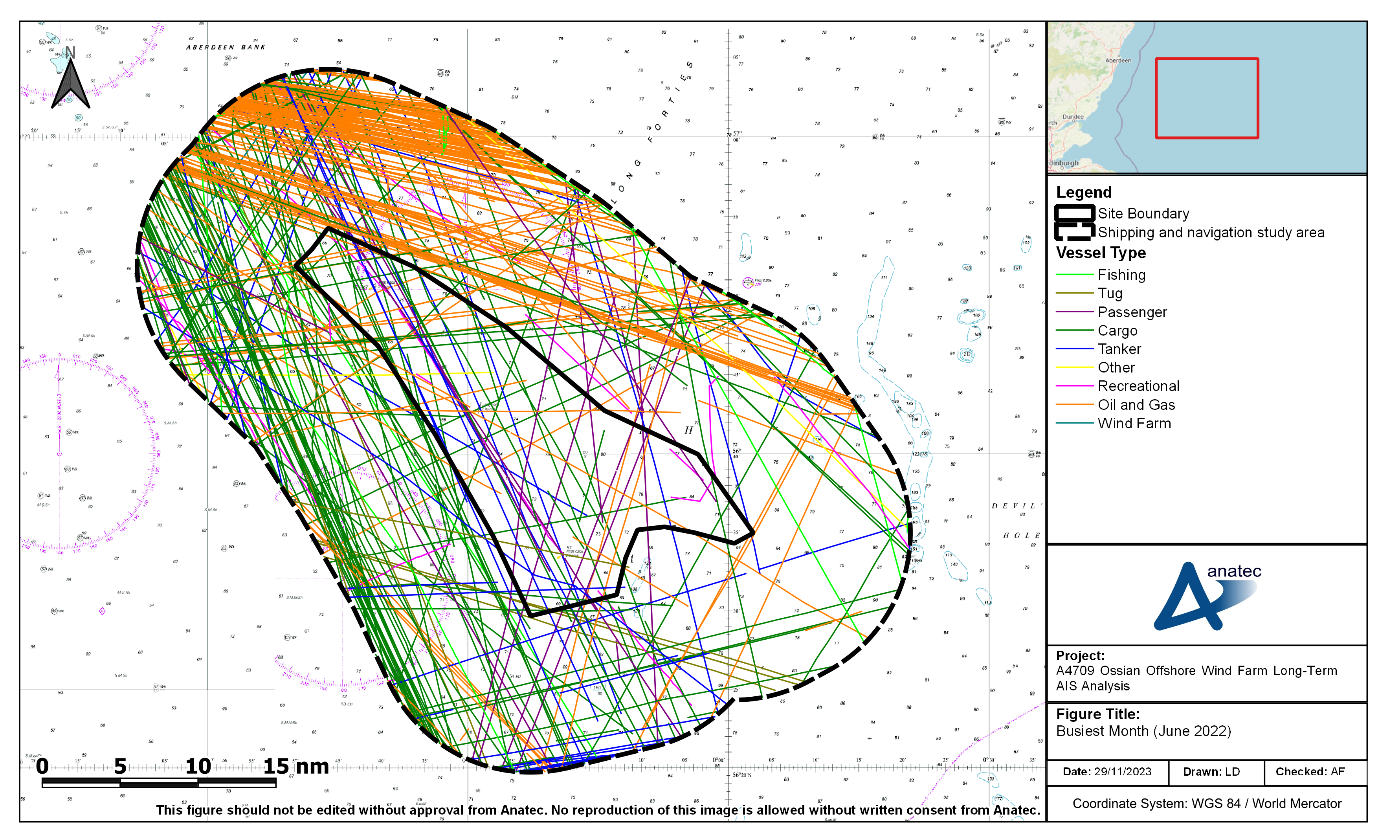
- Vessels by Type Recorded Within the Shipping and Navigation Study Area During the Busiest Month (June 2022)
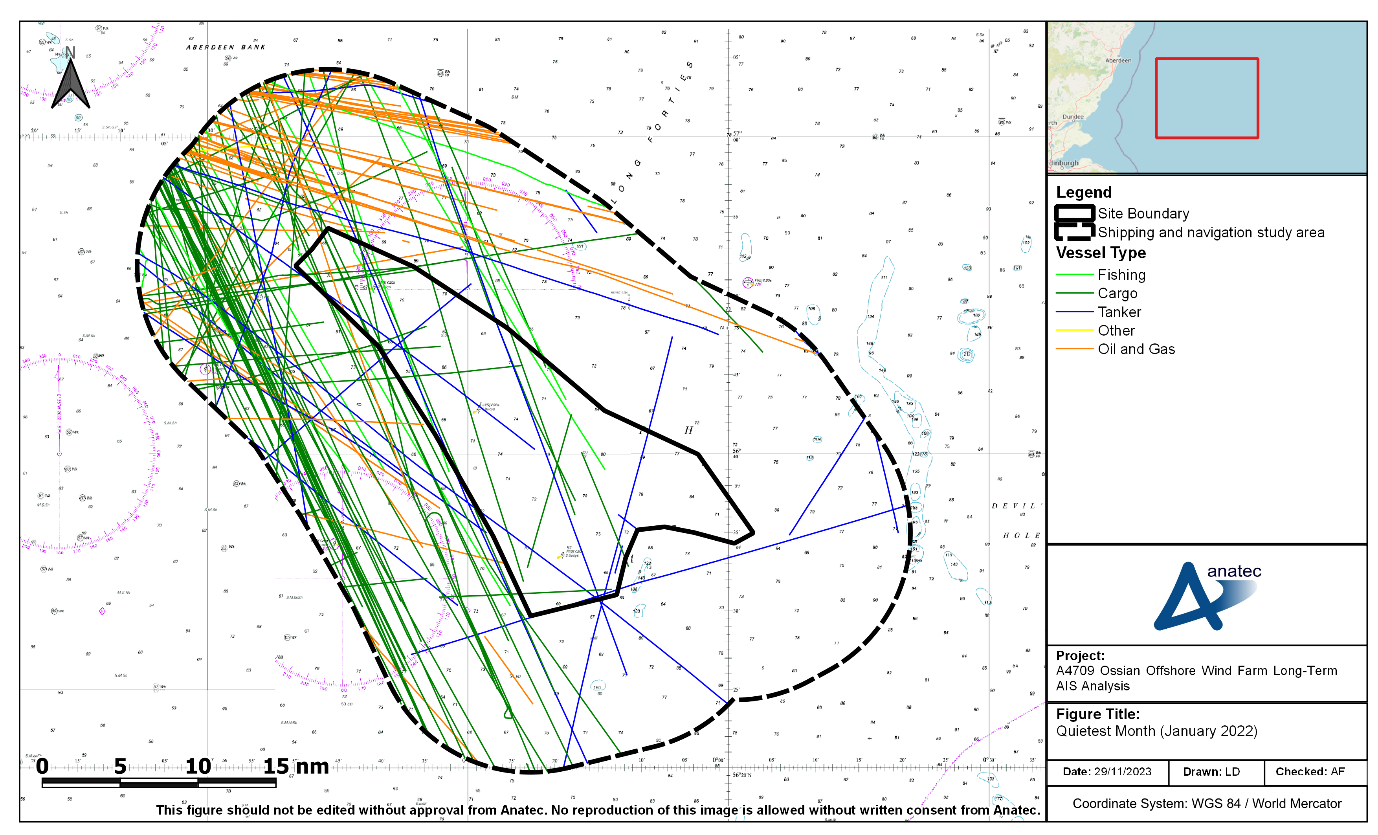
- Vessels by Type Recorded Within the Shipping and Navigation Study Area During the Quietest Month (January 2022)
- The distribution of vessel types recorded during 2022 within the shipping and navigation study area is presented in Figure E.6. Note that vessel types recorded in low numbers during the data period have been incorporated in the ‘All Other’ category[11].
- The most common vessel types recorded within the shipping and navigation study area during 2022 was oil and gas vessels (44%), cargo vessels (36%), and tankers (10%). No other vessel type accounted for more than 4% of all vessel traffic recorded.
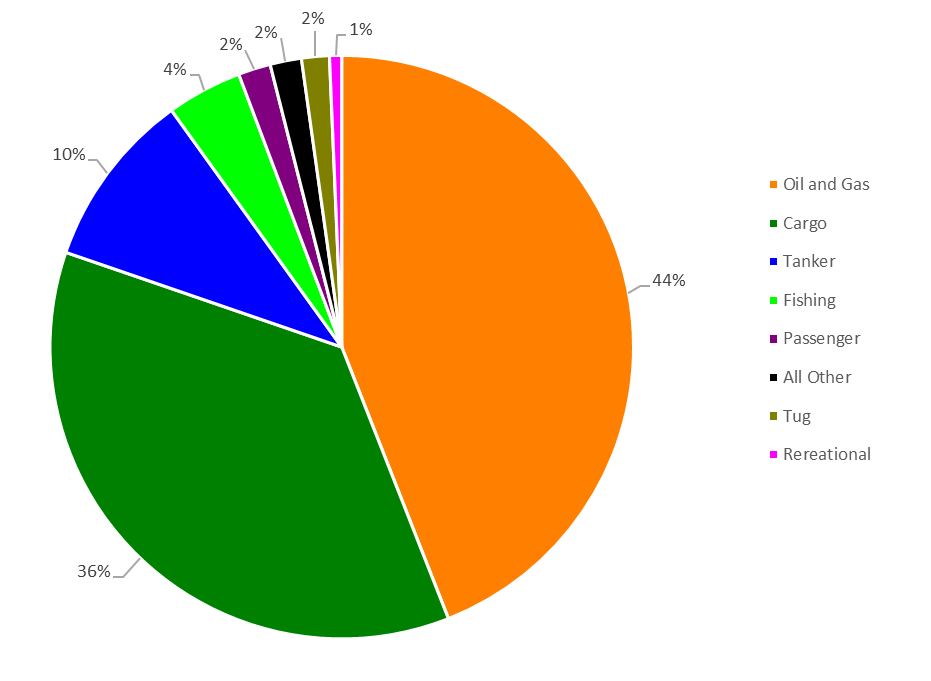
- Vessel Type Distribution Recorded Within the Shipping and Navigation Study Area Across 12 Months in 2022
- The vessel tracks recorded during 2022 within the shipping and navigation study area, colour-coded by vessel length, are presented in Figure E.7. Following this, the distribution of those lengths is presented in Figure E.8. It is noted that less than 1% of vessels did not broadcast their vessel length, all of which were recreational vessels.
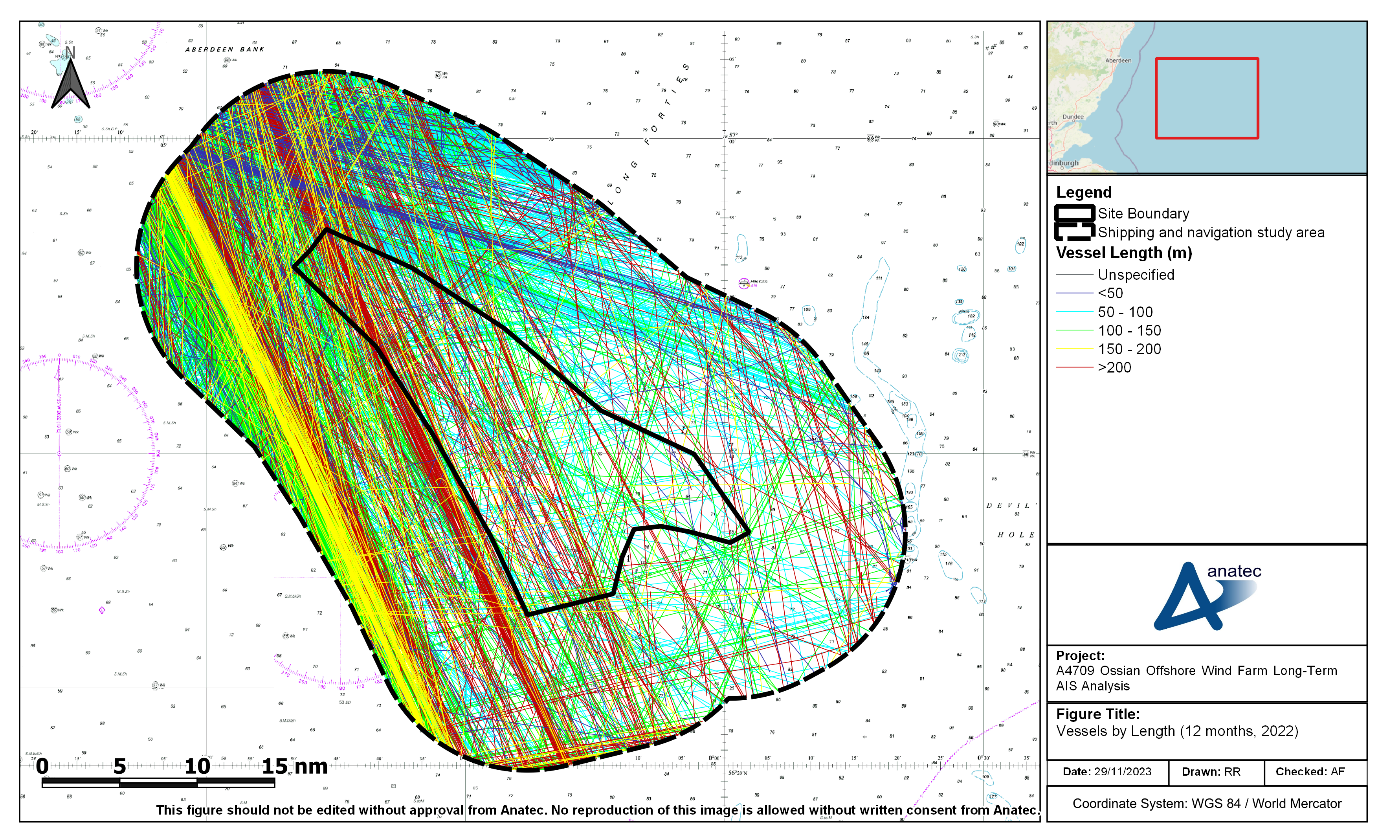
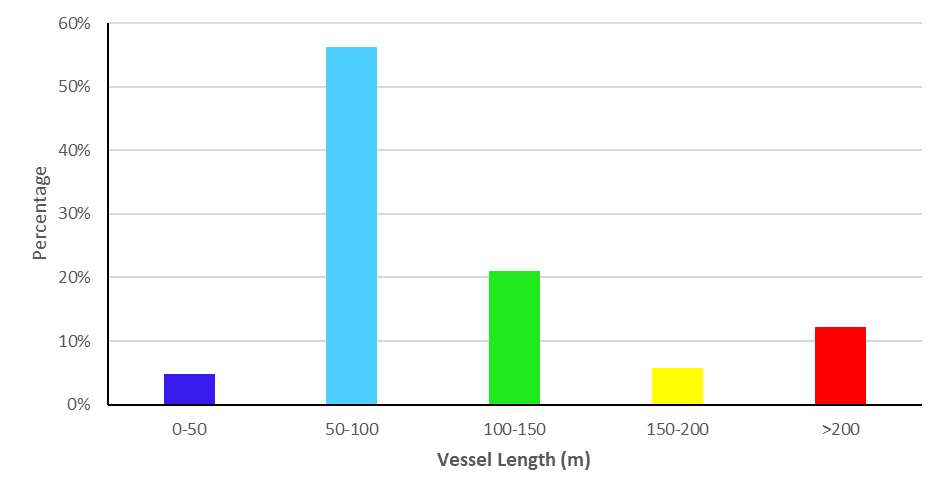
- Distribution of Vessel Lengths Recorded Within the Shipping and Navigation Study Area Across 12 Months in 2022
- The average length of vessels recorded during 2022 was 114 m. The greatest LOA was 300 m recorded for two unique container cargo vessels and one cruise liner. Over half of all unique vessels (56%) were between 50 m and 100 m; this was mainly made up of oil and gas vessels, small cargo vessels, and tankers. The larger vessels were all commercial vessels, in particular cruise liners, bulk carriers, shuttle tankers, and crude oil tankers, mainly transiting north-south through the shipping and navigation study area. The smaller vessels were primarily fishing vessels and oil and gas vessels recorded to the north of the site boundary.
- Vessel Type
- This section reviews the vessel activity within the shipping and navigation study area during 2022 for each of the main vessel types.
- Oil and Gas Vessels
- Oil and gas vessels made up 44% of all vessels recorded on AIS during 2022. Figure E.9 presents all oil and gas vessels recorded on AIS within the shipping and navigation study area during 2022.
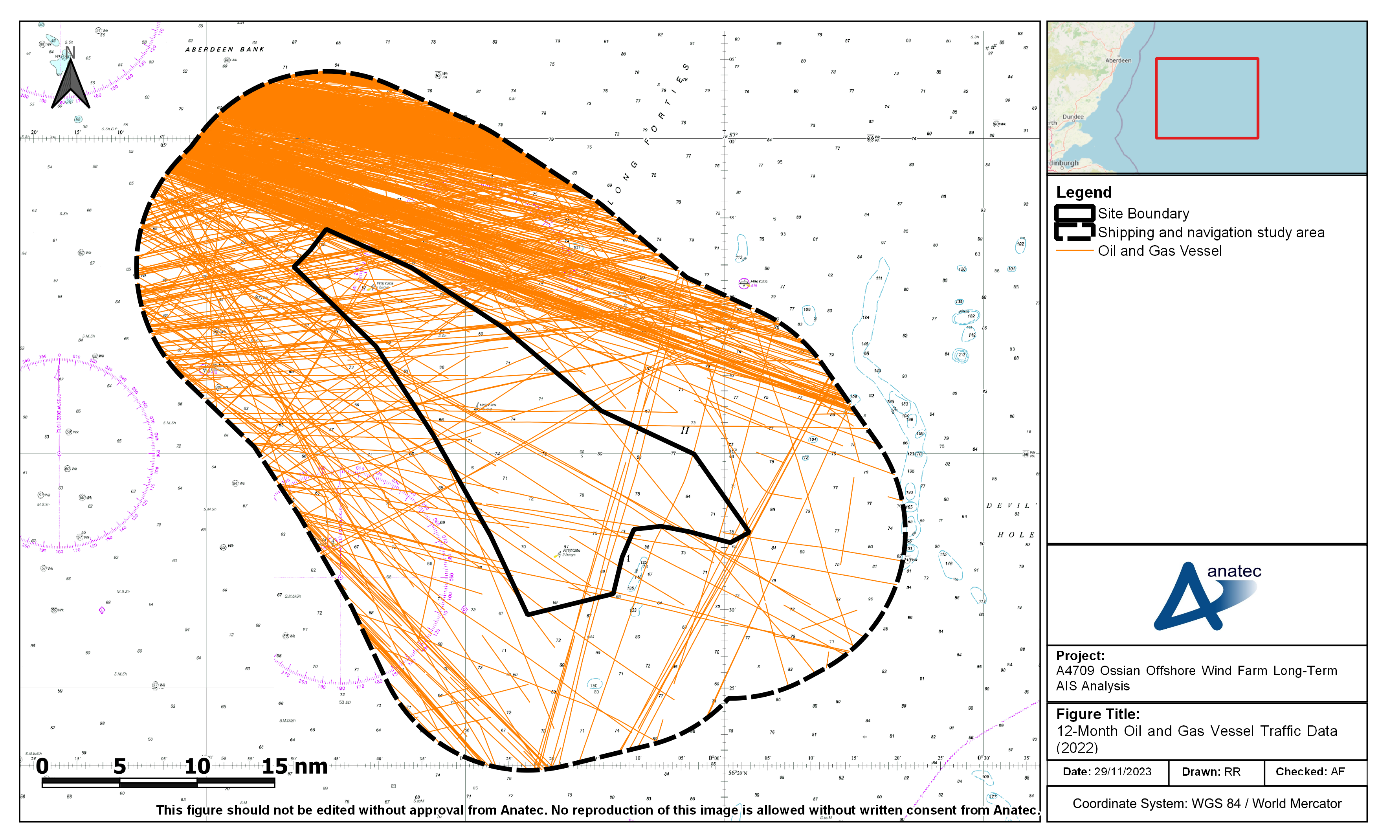
- As per section E.4.1.3, oil and gas vessels were the most commonly recorded vessel type within the shipping and navigation study area. The majority of oil and gas vessels were observed transiting to the north of the site boundary on a north-west/south-east transit headed between Aberdeen and the Catcher, Stella, Fulmar and Judy Fields, as well as various other oil and gas fields and platforms within the North Sea. Only 9% of oil and gas vessels recorded intersected the site boundary, with the majority of these vessels on an east/west transit between Aberdeen or Montrose and various oil and gas fields within the North Sea.
- Figure E.10 presents the average number of unique oil and gas vessels recorded per day for each month within the shipping and navigation study area during 2022.
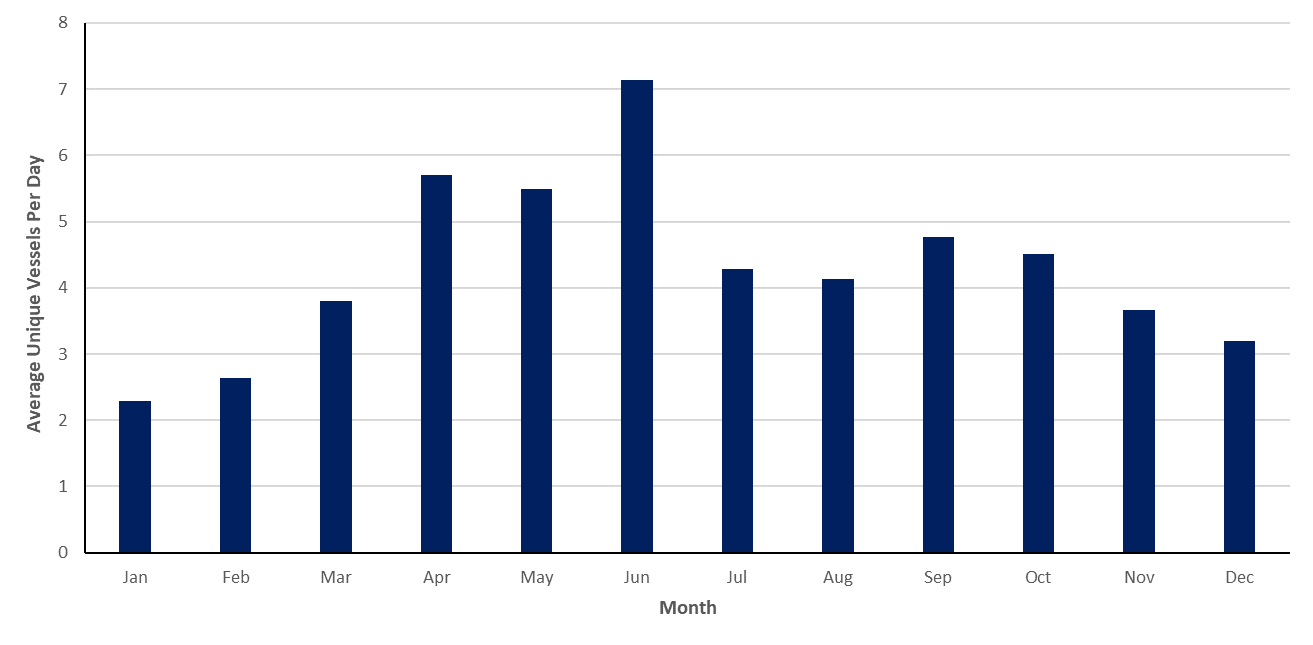
- Average Daily Oil and Gas Vessels per Month Within the Shipping and Navigation Study Area (12 months, 2022)
- Oil and gas vessels showed seasonal variation with higher average numbers recorded in the late spring/early summer months with fewer vessels recorded in the winter months in comparison. On average, there were four unique oil and gas vessels recorded per day within the shipping and navigation study area across 2022. June 2022 was the busiest month for oil and gas vessels when vessel activity peaked with an average of seven unique vessels recorded each day. January 2022 was the quietest month with an average of two unique vessels recorded each day.
- Cargo vessels made up 36% of all vessels recorded on AIS during 2022. Figure E.11 presents all cargo vessels recorded on AIS within the shipping and navigation study area during 2022.
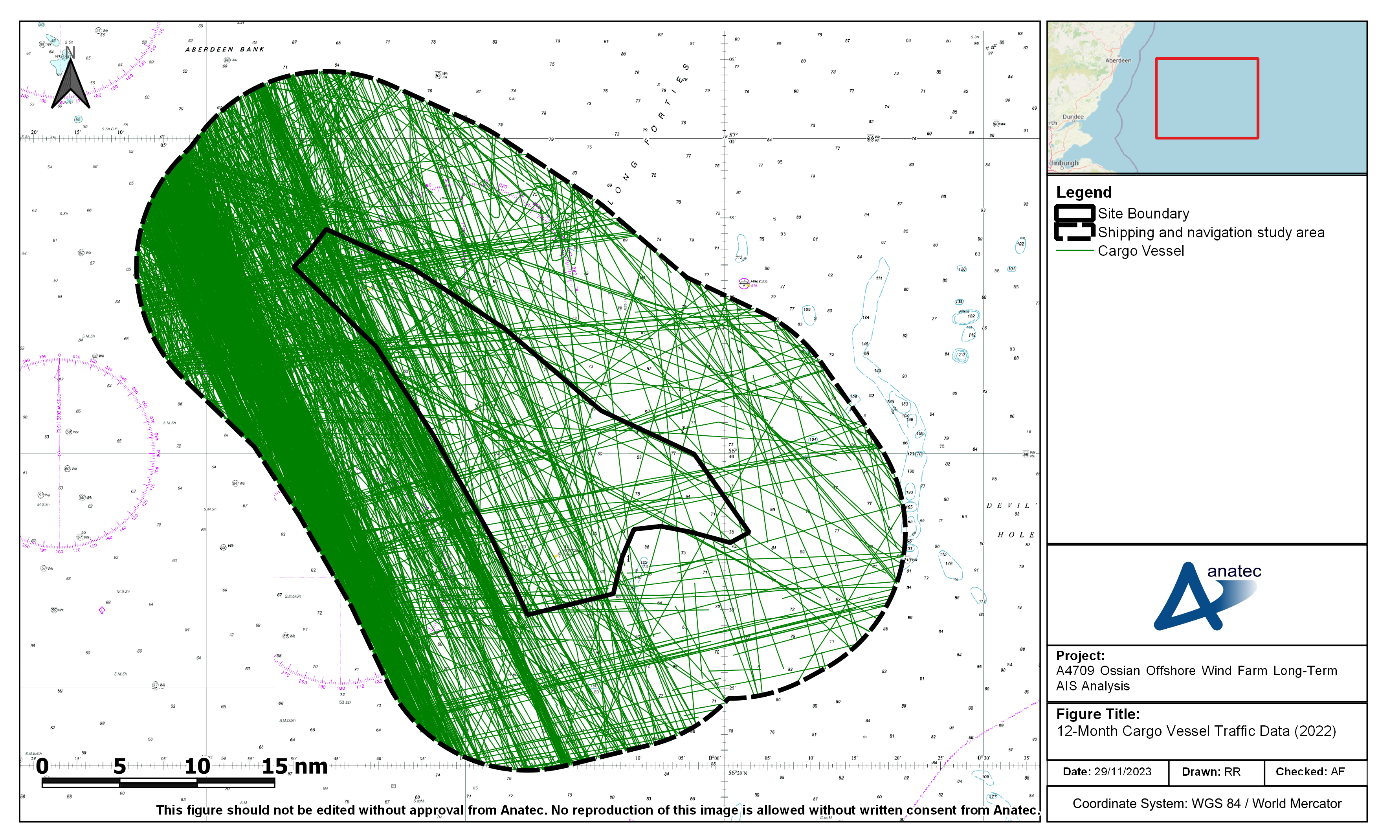
- The highest proportion of cargo vessels were observed to the west of the site boundary on defined coastal routes heading north/south. In some infrequent instances, cargo vessels utilising these routes on a regular basis passed further offshore. This may be due to Master preference but could also indicate potential adverse weather routeing. Various cargo vessels were also recorded transiting east/west through the site boundary with 23% of all cargo vessels recorded in the shipping and navigation study area intersecting the site boundary.
- The main cargo sub-type recorded was general cargo (39% of all cargo vessels recorded). Vehicle carriers (16%), bulk carriers (16%), and container vessels (14%) were also common.
- Roll-on/Roll-off (Ro-Ro) cargo vessels, which are a particularly sensitive user given their timetabled services, were infrequent; six transits (less than 1%) were recorded during 2022. These vessels were not on designated routes.
- Figure E.12 presents the average number of unique cargo vessels recorded per day for each month within the shipping and navigation study area during 2022.
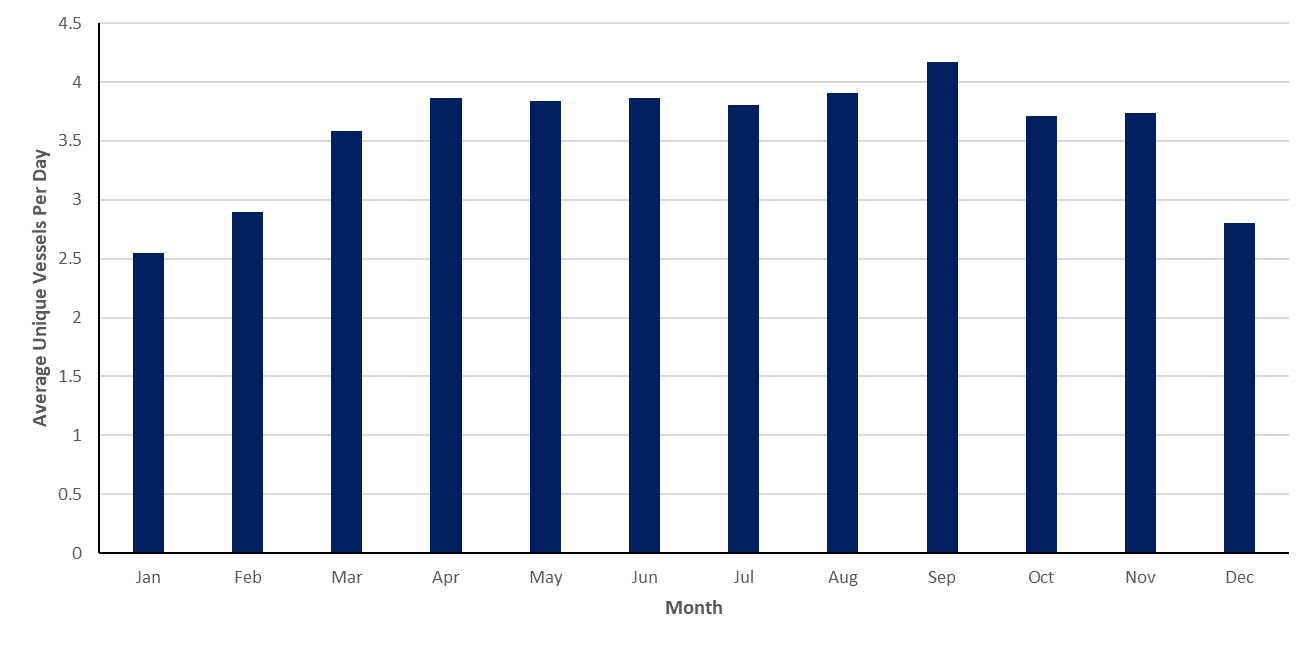
- Average Daily Cargo Vessels per Month Within the Shipping and Navigation Study Area (12 months, 2022)
- Cargo vessels showed slight seasonal variation and on average there was between three and four unique cargo vessels per day recorded within the shipping and navigation study area during 2022, with average numbers per day slightly lower in winter months. September 2022 was the busiest month for cargo vessels with an average of four unique vessels recorded per day. January 2022 was the quietest month with an average of two to three unique vessels recorded per day.
- Tankers made up 10% of all vessels recorded on AIS during 2022. Figure E.13 presents all tankers recorded on AIS within the shipping and navigation study area during 2022.
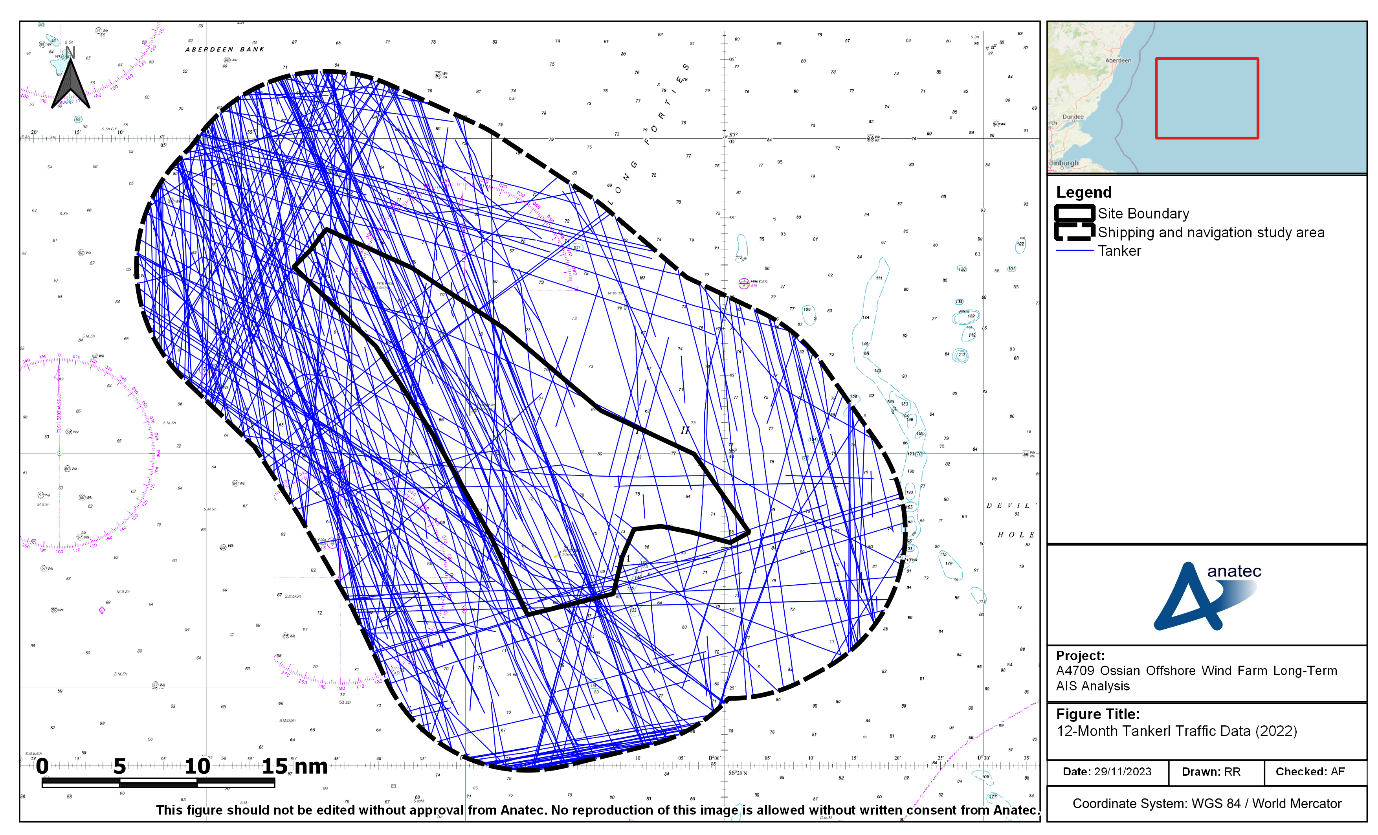
- Tankers were recorded transiting in various directions across the shipping and navigation study area with defined east/west routeing noted at the southern extent of the shipping and navigation study area, between ports in the Forth and the Baltic Sea. North-west/south-east routeing, mainly between Aberdeen and the Catcher Oil Field, was also recorded alongside north/south coastal routeing throughout the shipping and navigation study area, including through the site boundary, with approximately 27% of all tankers intersecting the site boundary.
- The most common tanker sub types recorded during 2022 was crude oil tankers (37%), combined oil/chemical tankers (24%), and chemical tankers (11%).
- Figure E.14 presents the average number of unique tankers recorded per month within the shipping and navigation study area during 2022.
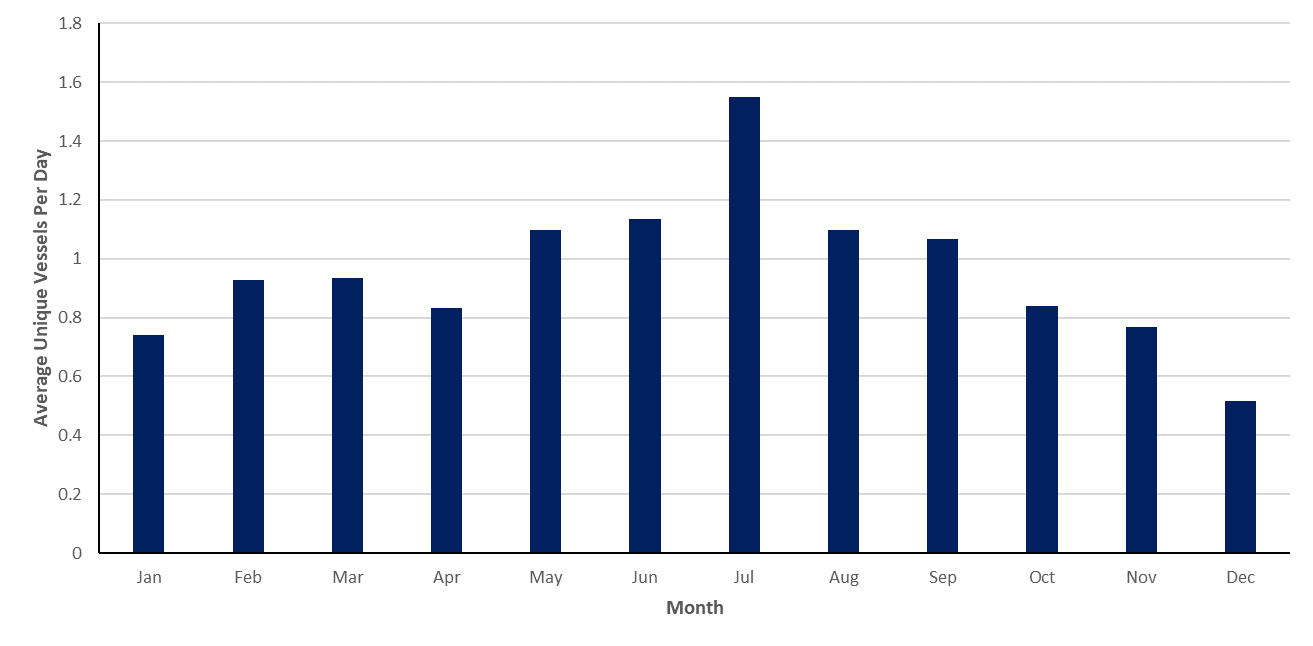
- Tankers showed minimal seasonal variation with marginally higher average numbers per day recorded in the summer months when compared to the winter months. July 2022 was the busiest month for tankers with an average of one to two tankers recorded per day within the shipping and navigation study area. December 2022 was the quietest month with an average of one tanker recorded every two days throughout the shipping and navigation study area.
- Fishing vessels made up 4% of all vessels recorded on AIS during 2022. Figure E.15 presents all fishing vessels recorded on AIS within the shipping and navigation study area during 2022, colour-coded by fishing activity. Fishing activity was determined by vessel speed, destination, track behaviour, and navigational status information transmitted via AIS. It is considered that a proportion of vessels were recorded on transit before and after being identified in active fishing activity. As AIS carriage is only mandatory for fishing vessels of 15 m length and over, it is likely that fishing vessel activity is underrepresented due to this assessment being AIS-only.
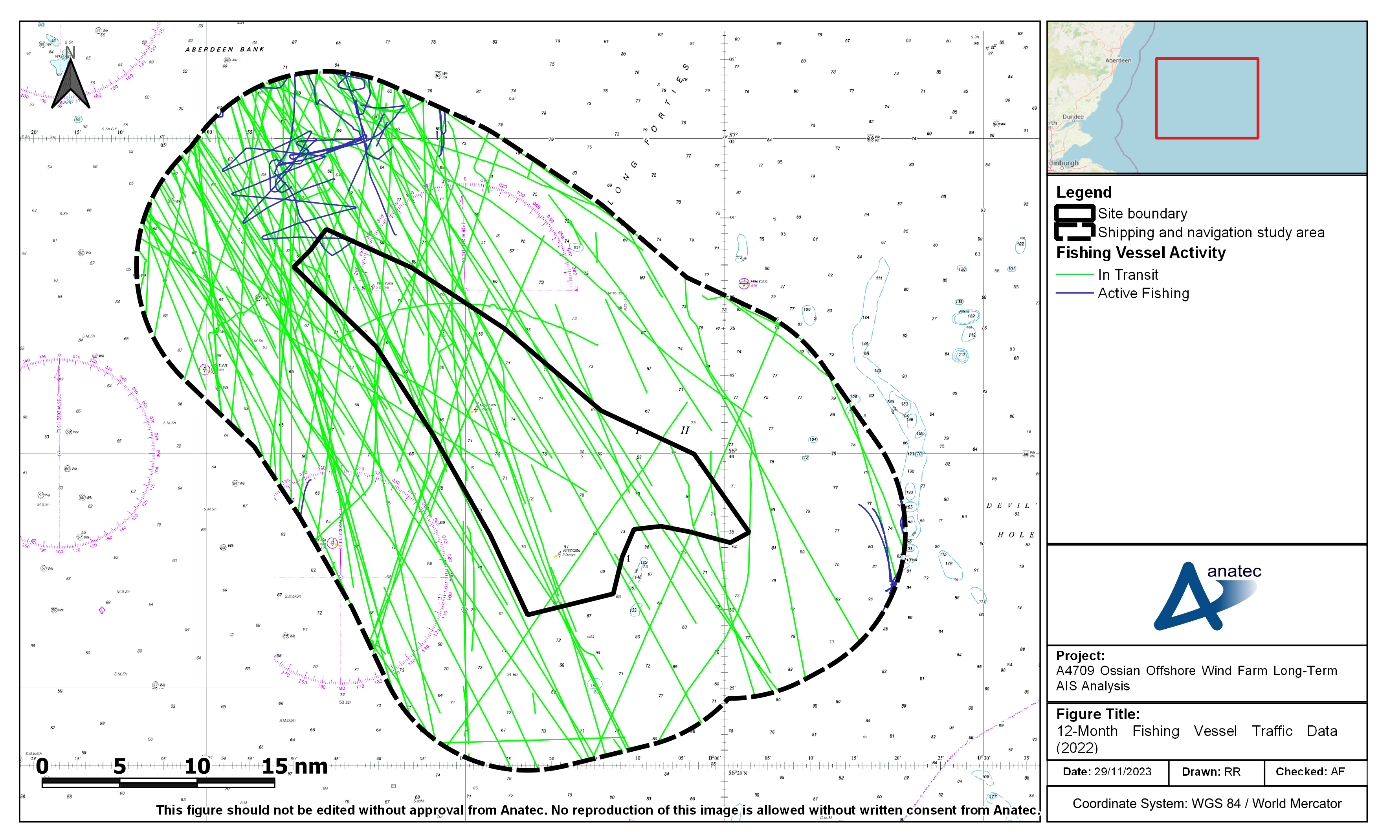
- Overall, fishing was relatively low in the shipping and navigation study area across 2022 with the majority of vessels in transit to/from fishing grounds notably transiting north-west/south-east. Only a small proportion of fishing vessels were considered to be involved in likely active fishing activity. These vessels were noted to the south-east extent and the north of the shipping and navigation study area, and only engaged in likely activity during the months of May, June, and September 2022. Approximately 32% of fishing vessels intersected the site boundary during 2022 and approximately 14% of all fishing vessels recorded were likely engaged in fishing activities.
- Figure E.16 presents the average number of unique fishing vessels recorded per month within the shipping and navigation study area during 2022.
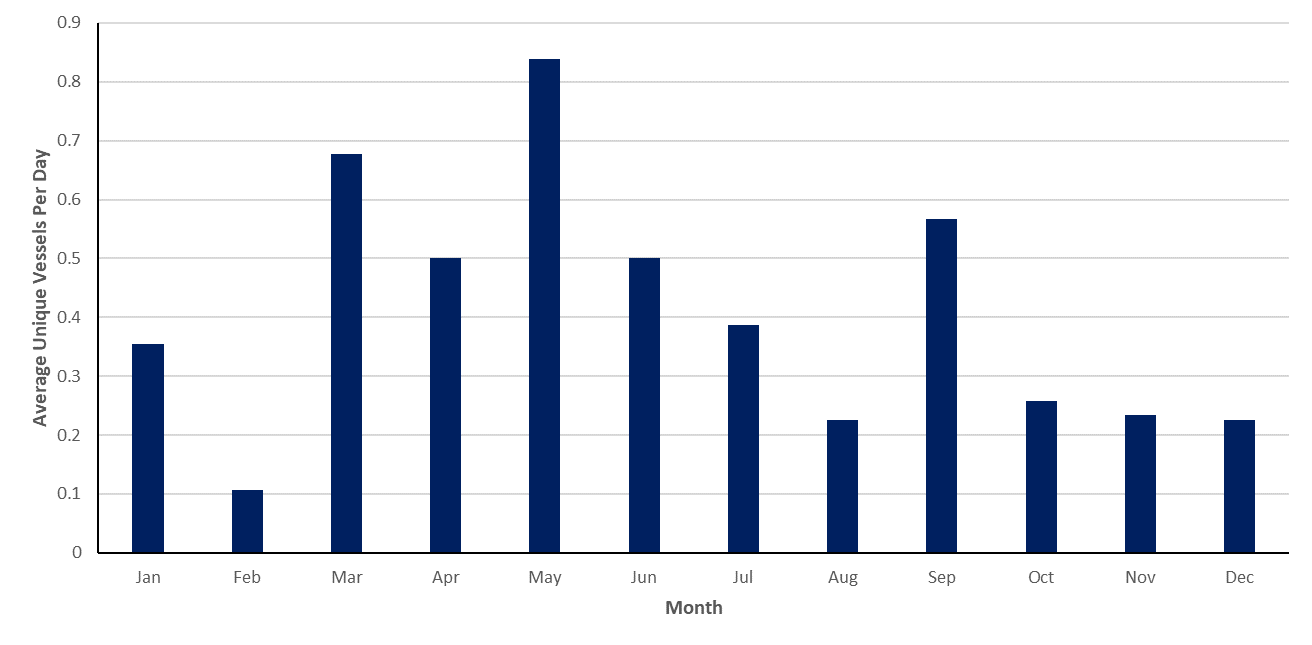
- Average Daily Fishing Vessels per Month Within the Shipping and Navigation Study Area (12 months, 2022)
- The presence of fishing vessels can be regarded as seasonal with a greater average of unique vessels per day being recorded across the spring and summer months when compared with winter. On average, one fishing vessel was seen within the shipping and navigation study area every two to three days across 2022. May 2022 was the busiest month for fishing vessels with an average of one vessel recorded per day within the shipping and navigation study area. February 2022 was the quietest month with only three unique vessels being recorded across the whole month, averaging at one vessel every nine days.
- Recreational vessels made up less than 1% of all vessels recorded on AIS during 2022. Figure E.17 presents all recreational vessels recorded on AIS within the shipping and navigation study area during 2022. Following this, the average number of unique recreational vessels recorded per month within the shipping and navigation study area during 2022 is presented in Figure E.18. It is noted that AIS data is likely to underrepresent recreational activity.
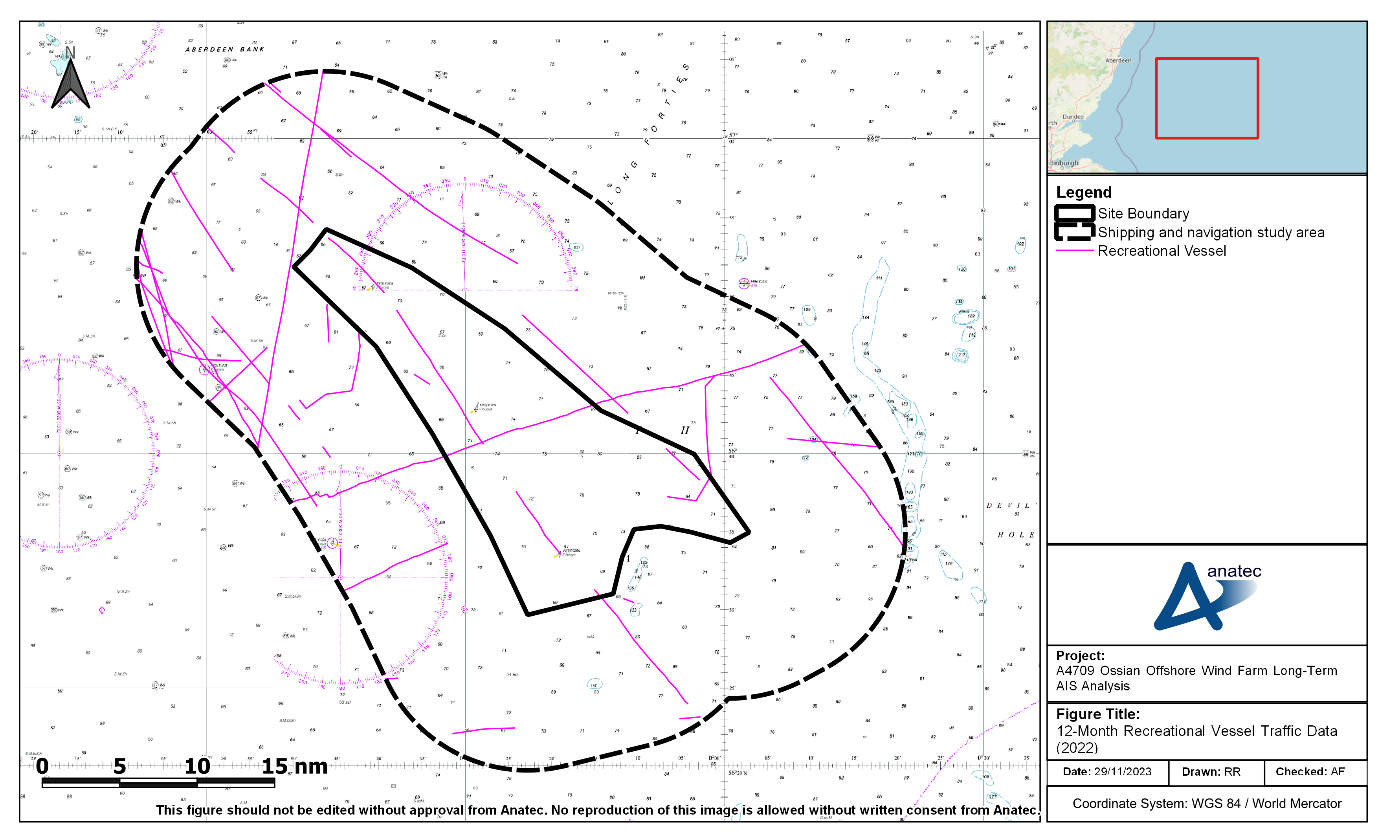
- Recreational Vessels Recorded Within the Shipping and Navigation Study Area Across 12 Months in 2022
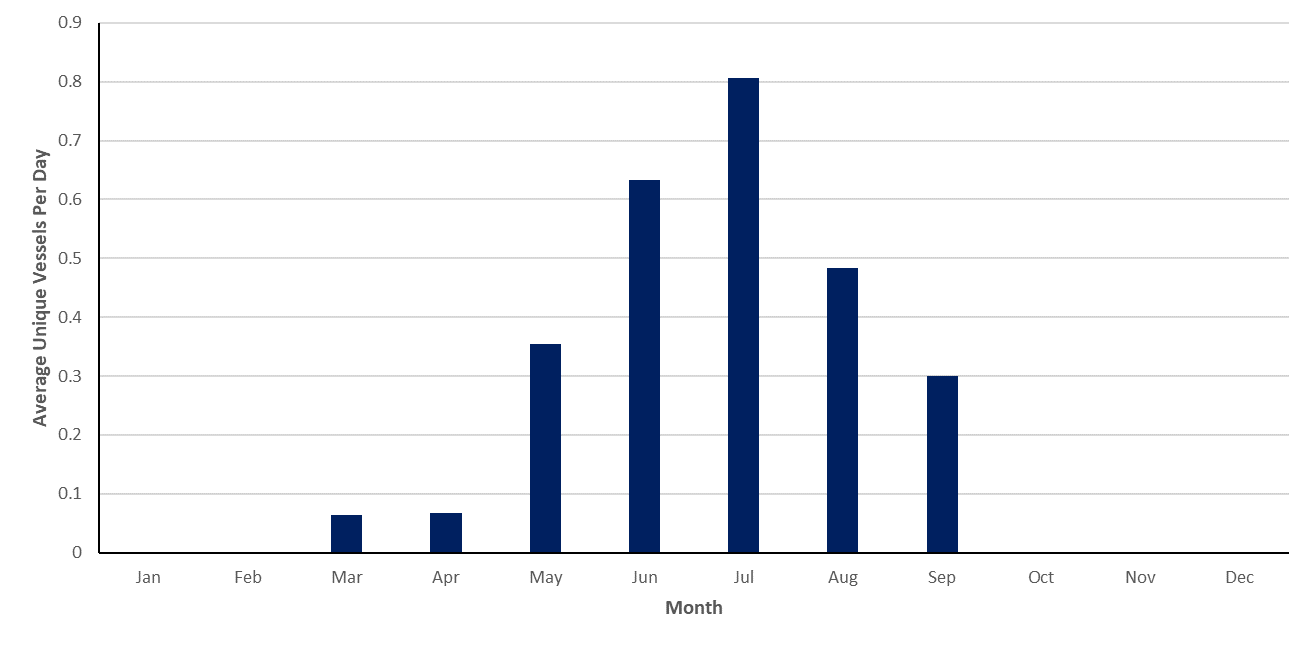
- Average Daily Recreational Vessels per Month Within the Shipping and Navigation Study Area (12 months, 2022)
- Recreational vessels were highly seasonal with vessels only recorded within the shipping and navigation study area from March to September 2022, noting this would be expected given recreational activity would generally tend to be most prevalent during summer conditions, particularly far offshore. An average of one recreational vessel was recorded within the shipping and navigation study area every five days. July 2022 was the busiest month for recreational vessels with an average of one unique vessel being recorded per day. Approximately 17% of recreational vessels intersected the site boundary, with north-west/south-east routeing most prominent.
- Figure E.19 presents the vessel tracks that intersected the site boundary during 2022.
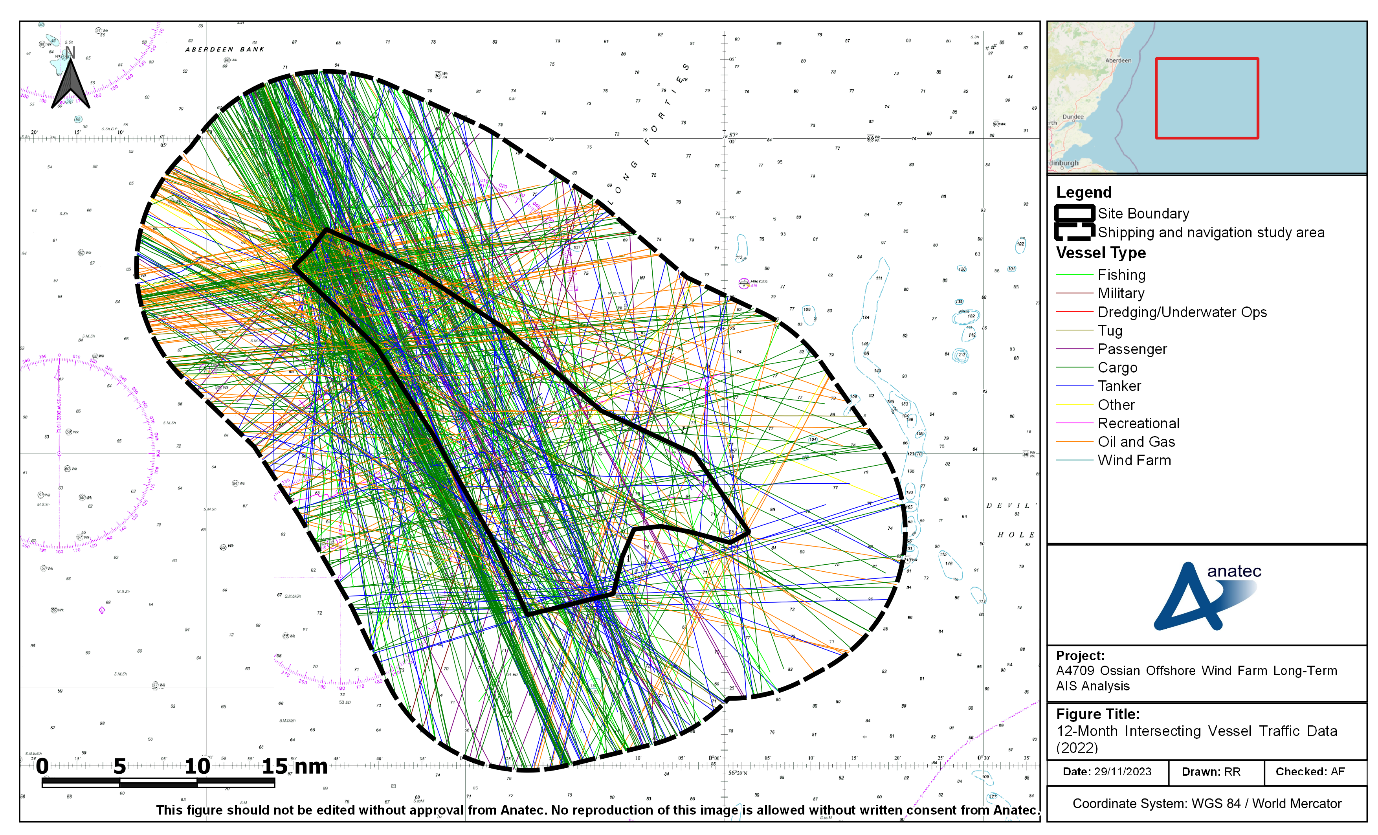
- On average, two unique vessels per day intersected the site boundary. The busiest month for intersecting vessel traffic was June 2022, when an average of three unique vessels per day were recorded, and the quietest month was January 2022, when one unique vessel per day intersected.
- The vessel type distribution of vessels which intersected the site boundary during 2022 is presented in Figure E.20.
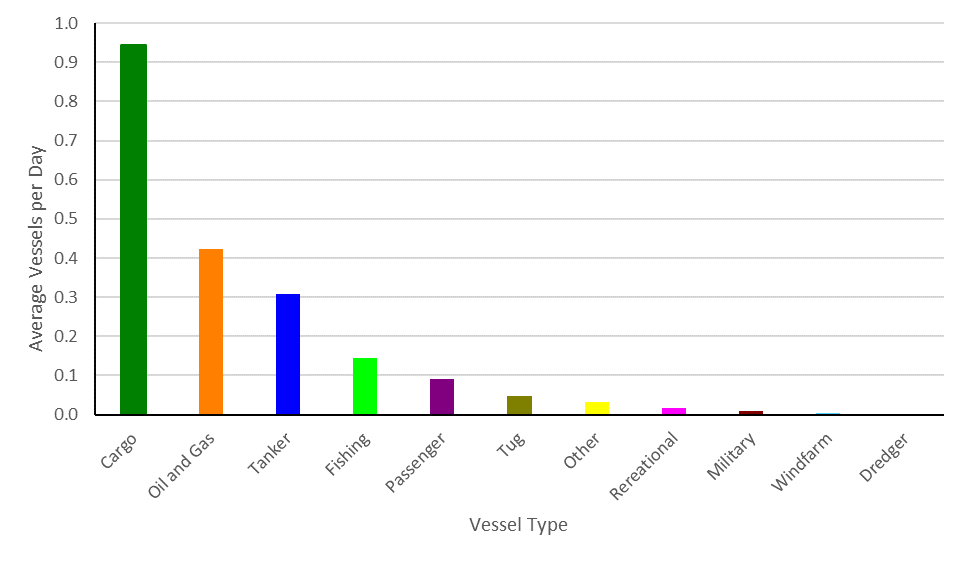
- The most common vessel type recorded intersecting the site boundary was cargo vessels (47%). Oil and gas vessels (21%) and tankers (15%) were also common vessel types. Overall, 21% of all vessels recorded within the shipping and navigation study area intersected the site boundary across 2022.
- Summary
Summary
- A summary of the average unique vessels counts per day for the main vessel types for the shipping and navigation study area during the long-term data period are presented in Table E.1. A comparison with the average unique vessels counts per day from the winter and summer vessel traffic survey datasets are also presented here.
Vessel Type | Average Vessels per Day within Shipping and Navigation Study Area | ||
|---|---|---|---|
Long-term Data Period | Winter 2022 Survey | Summer 2023 Survey | |
Oil and gas | 4 | 4 | 3-4 |
Cargo | 3-4 | 3-4 | 4-5 |
Tanker | 1 | 1 | 1-2 |
Fishing | 0-1 | 0-1 | 1-2 |
Recreational | 0-1 | 0 | 0-1 |
All Vessels | 9-10 | 9 | 11 |
- Unique vessel counts per day within the shipping and navigation study area from the long-term data generally align with those recorded from the winter survey carried out in December 2022 and the summer survey carried out in July 2023.
- Conclusion
Conclusion
- This appendix presents the analysis of the AIS data recorded during the entirety of 2022 within the shipping and navigation study area surrounding the site boundary. The aim of this appendix was to capture long-term activity within the area and to assess any seasonal variation in vessel volumes or behaviours.
- On average, nine to ten unique vessels per day were recorded within the shipping and navigation study area (excluding any temporary traffic). The most common vessel types recorded were oil and gas (44% of all vessels recorded), cargo vessels (36%), and tankers (10%). The average length of vessels recorded within the shipping and navigation study area during 2022 was 114 m.
- Overall, 21% of vessel traffic within the shipping and navigation study area intersected the site boundary. The most common vessel types to intersect was cargo vessels (47% of all intersecting vessel traffic), oil and gas vessels (21%), and tankers (15%).
- In terms of seasonal variation, seasonality was most prevalent in recreational vessels with no vessels being recorded during the months out with March to September 2022, and a peak in vessel numbers in July 2022.
- Fishing vessels were recorded all year round with higher volumes between March and September 2022. Fishing peaked in May 2022 with the quietest month being February 2022. Little active fishing was recorded within the shipping and navigation study area with activity only present to the south-east extent of the shipping and navigation study area and to the north of the site boundary. The vessels engaged in likely active fishing were only present during the months of May, June, and September 2022. Of all fishing vessels recorded, 14% were likely engaged in fishing activities.
- Oil and gas vessels showed seasonal variation with only slight seasonality present in cargo vessels and tankers.
- Given broad correlation between the datasets in terms of vessel numbers and routeing patterns, the 12 months AIS has been used as the primary dataset to assess vessel routeing in the NRA as it allows for definition of lower use routes.
[1] A figure was attached showing the routes relative to the Array that would be expected to be undertaken. This figure highlighted the route between Morven and Seagreen 1 Offshore Wind Farms and the route between Bellrock and Campion Offshore Wind Farms.
[2] It is noted that next to each of these aids to navigation on the Admiralty chart is the note “2 buoys”.
[3] A template is a large steel structure which is used as a base for various subsea structures, e.g. wellheads.
[4] Noted that mobilisation stations detailed as Tighnabruaich, Mallaig and Humber within the data, which may be an error in the data based on distance to site.
[5] Includes only incidents reported to an accident investigation branch or an anonymous reporting service. Unconfirmed incidents have not been considered, noting that to date (November 2023), only one further incident has been alleged but there is no evidence to confirm its occurrence.
[6] It is acknowledged that other theoretical analysis has been undertaken.
[7] Distance bordered on both sides by wind turbines is approximately 10 nm, which would require a distance of approximately 4nm between the Array and the Bellrock array under the MGN 654 20 degree corridor guidance. The actual width exceeds this, noting it also exceeds the minimum of 3.5 nm that would be required under the Shipping Template (Annex 2 to MGN 654)
[8] April 2022 was observed to be busiest month for fishing vessel numbers in the Array in the 12 months AIS – the AIS from this month was therefore used as the primary basis of the modelling assessment, with results then factored up to account for overall fishing vessel numbers recorded in 2022.
[9] As per SI 2007 No 1948 “The Electricity (Offshore Generating Stations) (Safety Zones) (Application Procedures and Control of Access) Regulations 2007
[10] For the purposes of this assessment, UK waters is defined as the UK European Economic Zone and UK territorial waters refers to the 12 nm limit from the British Isles, excluding the Republic of Ireland.
[11] Vessels included in the ‘All Other’ category include military, dredger/subsea operations, other, and wind farm.