10.3 Vessel Type
- Figure 10.7 presents the percentage distribution of the main vessel types recorded passing within the shipping and navigation study area, as well as the site boundary, during the winter vessel traffic survey period. The same distribution for the summer vessel traffic survey data is presented in Figure 10.8.
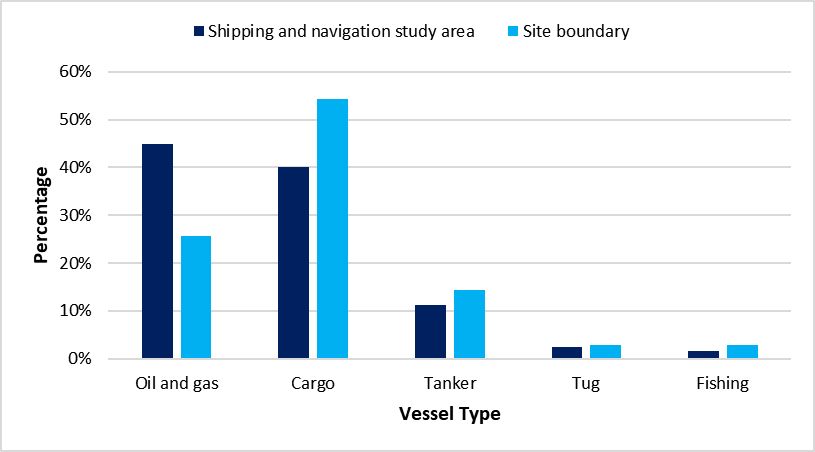
Figure 10.7: Distribution of Vessel Types Recorded During the Winter Vessel Traffic Survey (14 Days; December 2022)
Figure 10.8: Distribution of Vessel Types Recorded During the Summer Vessel Traffic Survey (14 Days; July 2023)
- During the winter vessel traffic survey period, the most common vessel types within the shipping and navigation study area were oil and gas, and cargo, accounting for 45% and 40% respectively. This was followed by tankers (11%), tugs (2%), and fishing vessels (2%).
- Within the site boundary, the most common vessel type was cargo (54%). This was followed by oil and gas (26%), tankers (14%), tugs (3%) and fishing vessels (3%).
- During the summer vessel traffic survey period, the most common vessel types within the shipping and navigation study area were cargo and oil and gas, accounting for 38% and 29% respectively. This was followed by tankers (11%), fishing (6%), recreational (5%), ‘other’ (5%), passenger (4%), and military (1%). Also recorded was a vessel of unspecified type and a tug (each of which accounted for less than 1%).
- Within the site boundary, the most common vessel type was cargo (40%). This was followed by tankers (15%), fishing (15%), ‘other’ (12%), oil and gas (6%), recreational (6%), passenger (4%), and military (2%).
- The following subsections consider each of the main vessel types individually.
10.3.1 Cargo Vessels
- Figure 10.9 presents the cargo vessels recorded within the shipping and navigation study area during the combined 28-day survey period.
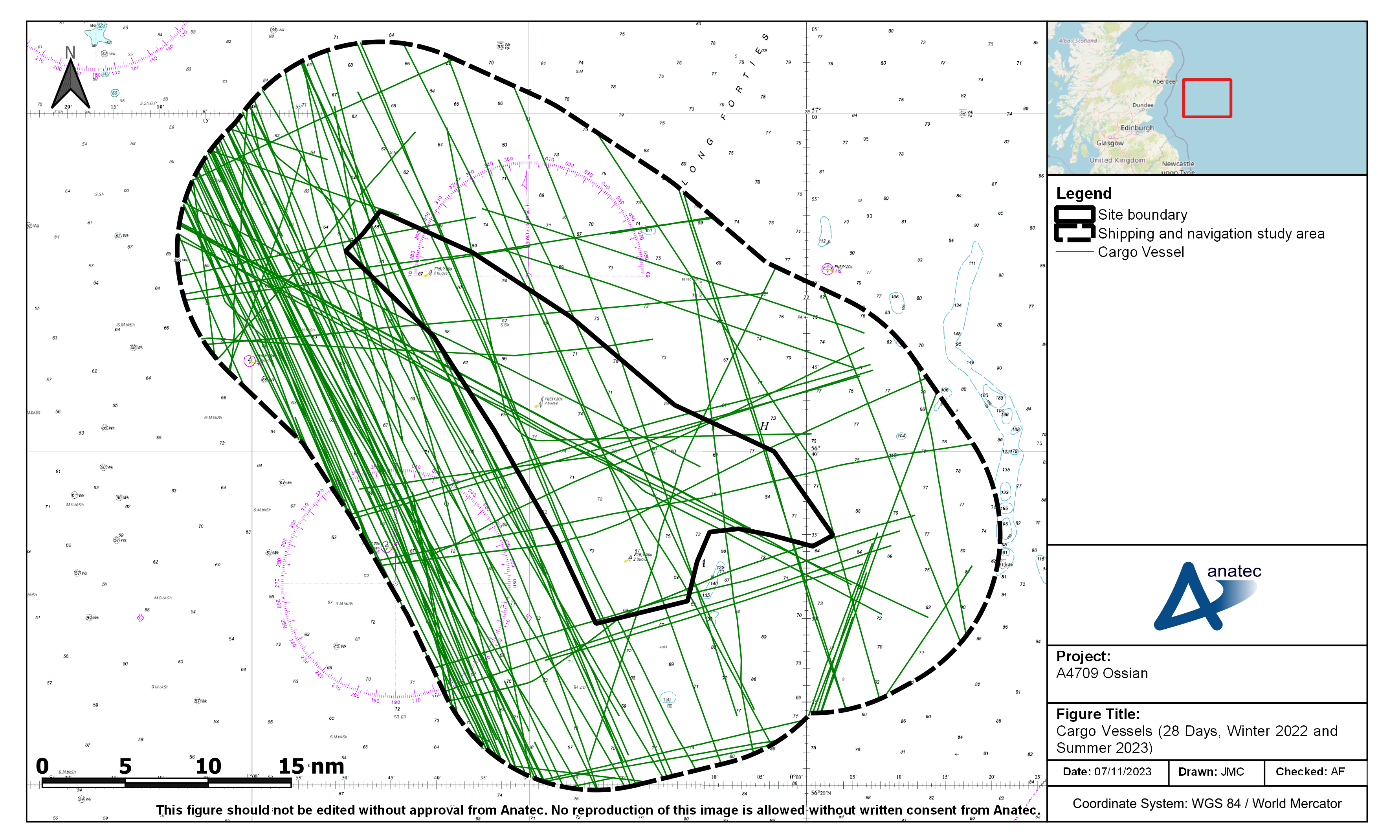
Figure 10.9: Cargo Vessels Recorded During the Combined 28-Day Vessel Traffic Survey Period (Winter 2022 and Summer 2023)
- Cargo vessels were most commonly seen in south-east/north-west transit inshore of the site boundary, with Rotterdam (Netherlands) and Iceland being common destinations. An average of four cargo vessels per day was recorded within the shipping and navigation study area during the combined 28-day period, with one to two per day within the site boundary.
- The data indicates that two Roll On Roll Off cargo ferries use the area, the Mykines and the Akranes both operated by Smyril Line. Input from Smyril Line during consultation was that these vessels transit the area two times every week all year round, i.e. a total of four transits for both vessels every week.
10.3.2 Oil and Gas Vessels
- Figure 10.10 presents the oil and gas vessels recorded within the shipping and navigation study area during the combined 28-day survey period.
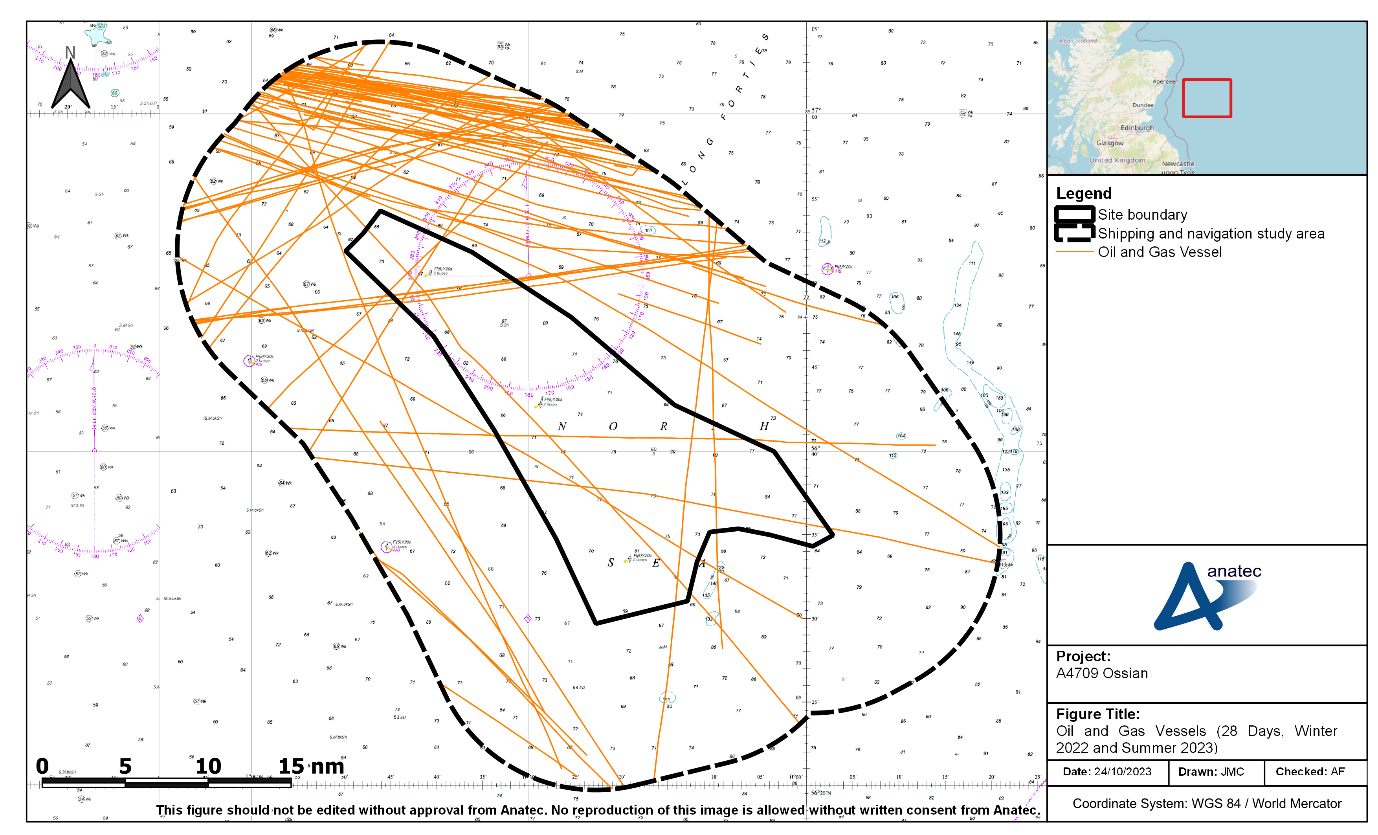
Figure 10.10: Oil and Gas Vessels Recorded During the Combined 28-Day Vessel Traffic Survey Period (Winter 2022 and Summer 2023)
- Oil and gas vessels were most commonly seen in south-east/north-west transit north of the site boundary, between Aberdeen and various oil and gas infrastructure. An average of three to four oil and gas vessels per day was recorded within the shipping and navigation study area during the combined 28-day period, with one every two to three days within the site boundary.
10.3.3 Tankers
- Figure 10.11 presents the tankers recorded within the shipping and navigation study area during the combined 28-day survey period.
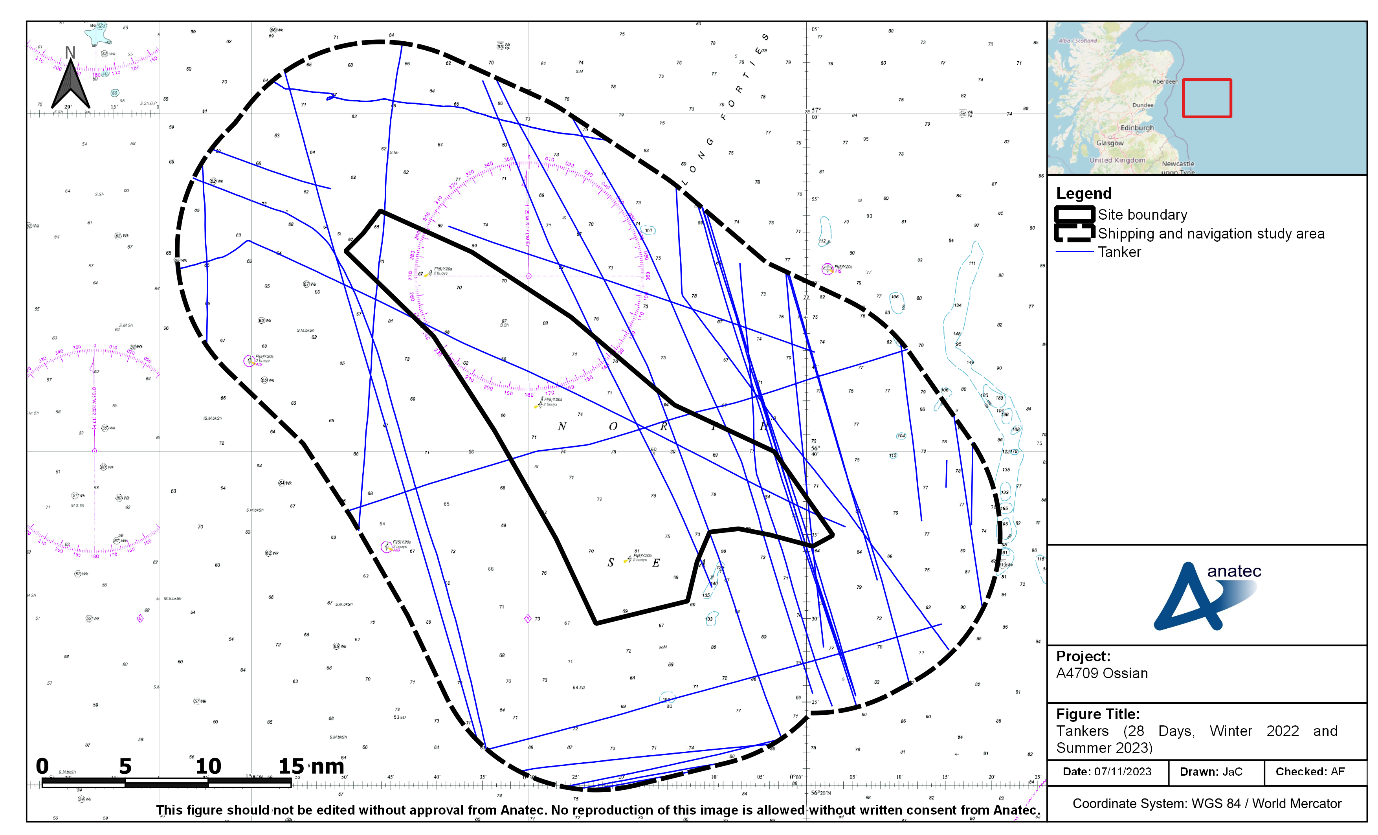
Figure 10.11: Tankers Recorded During the Combined 28-Day Vessel Traffic Survey Period (Winter 2022 and Summer 2023)
- Tankers were most commonly seen transiting south-east/north-west within the eastern half of the shipping and navigation study area, with destinations including Rotterdam (Netherlands), Iceland and the Shetland Islands. An average of one tanker per day was recorded within the shipping and navigation study area during the combined 28-day period, with one every two days within the site boundary.
10.3.4 Fishing Vessels
- Figure 10.12 presents the fishing vessels recorded within the shipping and navigation study area during the combined 28-day survey period, colour-coded by average speed. As a general heuristic, average speeds of below six knots are indicative of potential active fishing.
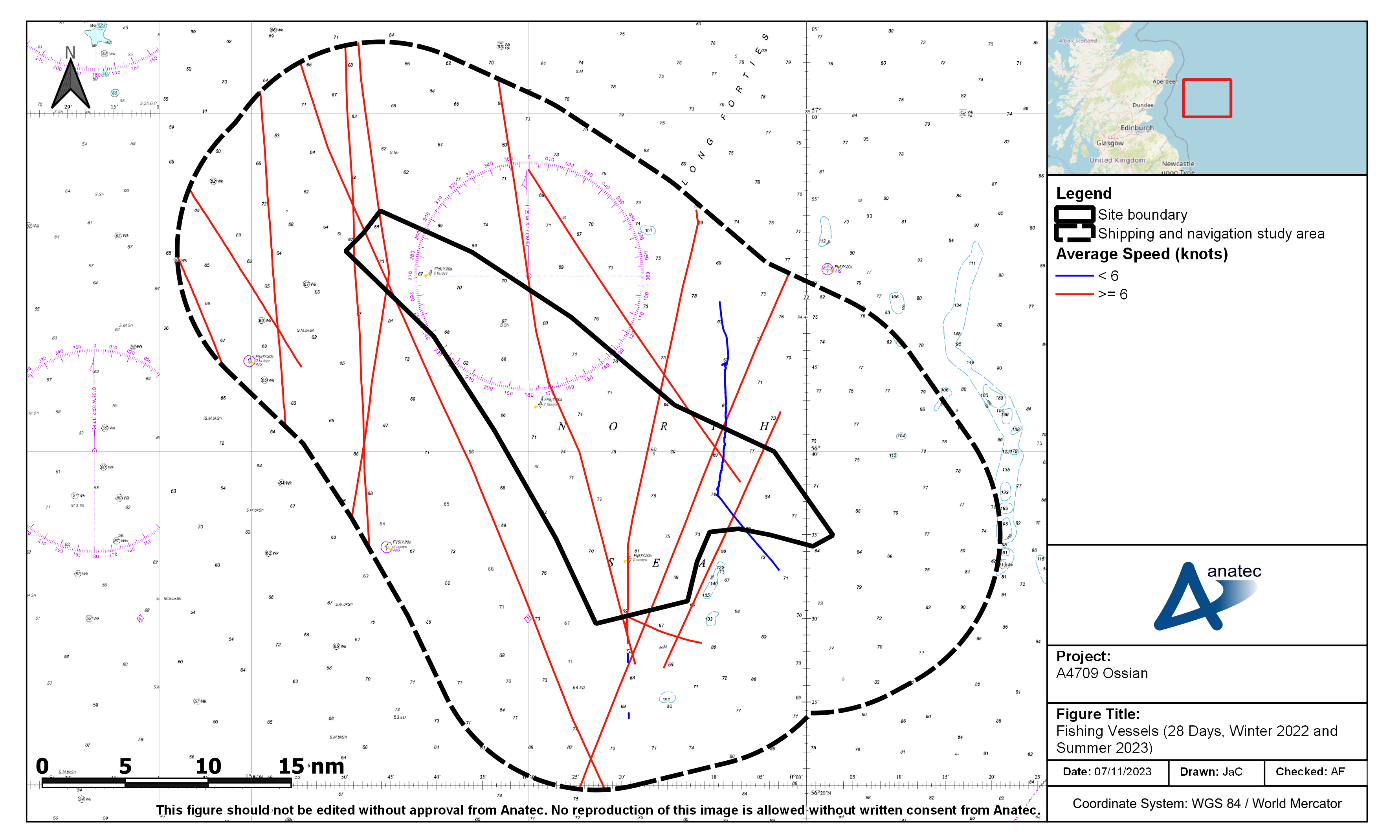
Figure 10.12: Fishing Vessels Recorded During the Combined 28-Day Vessel Traffic Survey Period (Winter 2022 and Summer 2023)
- Fishing vessels were recorded in a variety of locations throughout the shipping and navigation study area, with one vessel exhibiting potential active fishing behaviour (based on its average speed, navigational status and track behaviour). It was noted during consultation (see section 4) that routes used by fishing vessels are not always consistent and depend on choice of port and fishing grounds.
- There were low levels of fishing vessel activity recorded during the 28-day period, which aligns with input received during consultation (see section 4). An average of one fishing vessel every two to three days was recorded within the shipping and navigation study area during the combined 28-day period, with one every three days within the site boundary.
- Further information about commercial fisheries can be found in volume 2, chapter 12.