15.4 Post Wind Farm
15.4.1 Simulated Automatic Identification System
- Anatec’s AIS Simulator software was used to gain an insight into the potential re-routed commercial traffic following the installation of the Array structures. The AIS Simulator uses the mean positions of identified commercial main routes within the shipping and navigation study area and the anticipated shift post wind farm, together with the standard deviations and average number of vessels on each commercial main route to simulate tracks.
- A plot of 28 days of simulated AIS (to match the total duration of the vessel traffic surveys) within the shipping and navigation study area based on the deviated main commercial routes (see section 13.4.2) is presented in Figure 15.3.
- It is noted that the simulated AIS represents an MDS based on a mean 1 nm passing distance from the site boundary for routes.
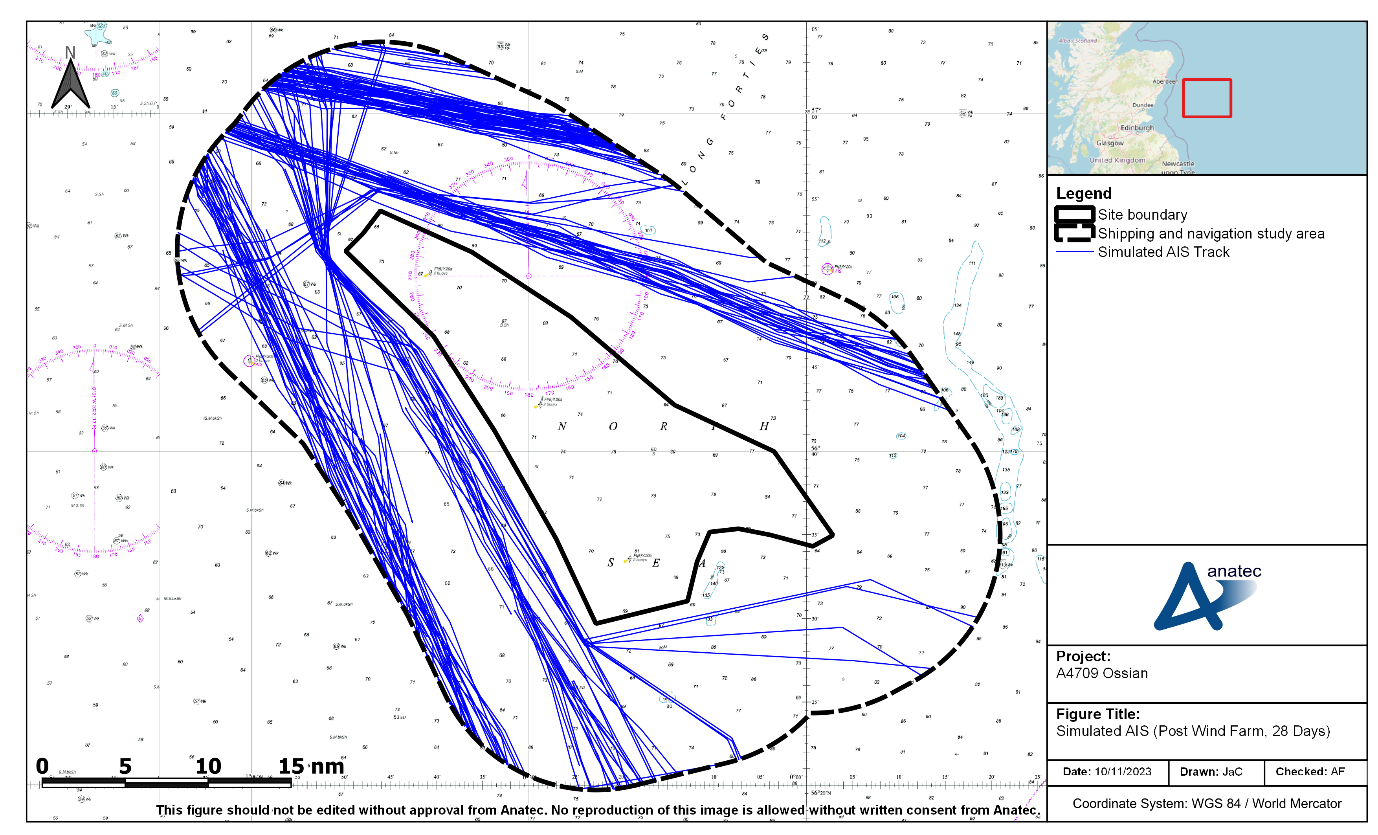
Figure 15.3: Simulated AIS Within the Shipping and Navigation Study Area (Post Wind Farm, 28 Days)
15.4.2 Vessel to Vessel Collisions
- Using the post wind farm routeing as input, Anatec’s COLLRISK model has been run to estimate the anticipated vessel to vessel collision risk in proximity to the site boundary.
- A heat map based upon the geographical distribution of collision risk within a 0.5 nm by 0.5 nm grid for the post wind farm base case is presented in Figure 15.4.
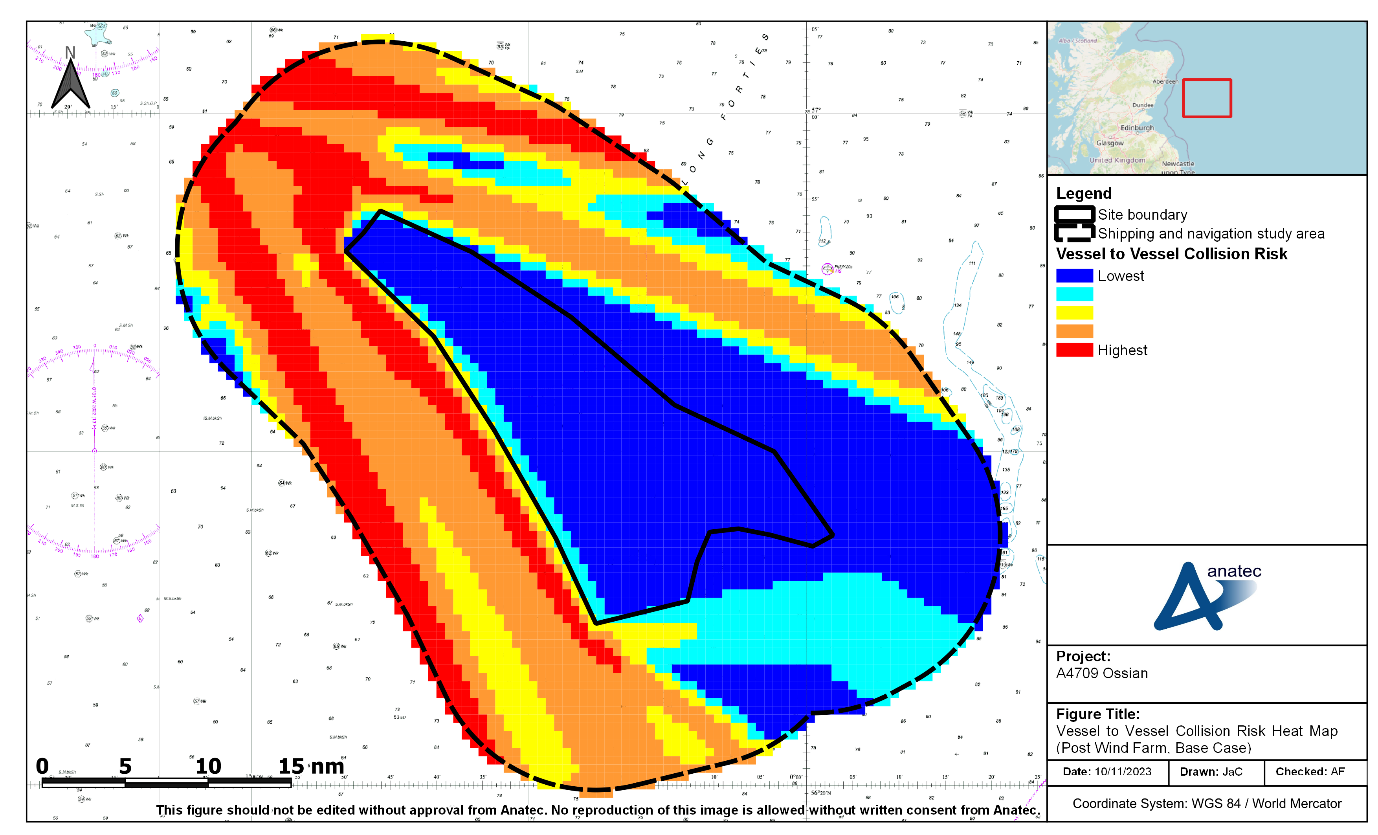
Figure 15.4: Vessel to Vessel Collision Risk Heat Map (Post Wind Farm, Base Case)
- Assuming base case vessel traffic levels, the annual collision frequency post wind farm was estimated to be 5.42×10⁻⁴, corresponding to a return period of approximately one in 1,845 years. This represents a 31% increase in collision frequency compared to the pre wind farm base case result.
- The largest increase in vessel-to-vessel collision risk from the pre wind farm to post wind farm scenarios corresponds to the region immediately inshore of the site boundary where multiple deviated routes are assumed to pass 1 nm from the western edge of the site boundary as a worst-case assumption; see section 13.4.2 for further details on these routes.
15.4.3 Powered Vessel to Structure Allision
- Based upon the vessel routeing identified in the shipping and navigation study area, the anticipated re-routeing as a result of the presence of the Array, and assumptions that relevant embedded mitigation measures are in place (see section 18.1), the frequency of an errant vessel under power deviating from its route to the extent that it came into proximity with a wind farm structure associated with the Array is considered to be low.
- From consultation with the shipping industry, it is also assumed that commercial vessels would be highly unlikely to navigate between wind farm structures due to the restricted sea room and will instead be directed by the aids to navigation located in the region and those present at the Array. During the construction and decommissioning phases this will primarily consist of the buoyed construction area whilst during the operation and maintenance phase this will primarily consist of the lighting and marking of the wind farm structures themselves.
- Using the post wind farm routeing as input, together with the MDS and local meteorological ocean data, Anatec’s COLLRISK model was run to estimate the likelihood of a commercial vessel alliding with one of the wind farm structures within the site boundary whilst under power. In order to maintain a MDS, the model did not consider one structure shielding another.
- A plot of the annual powered allision frequency per structure for the base case is presented in Figure 15.5.
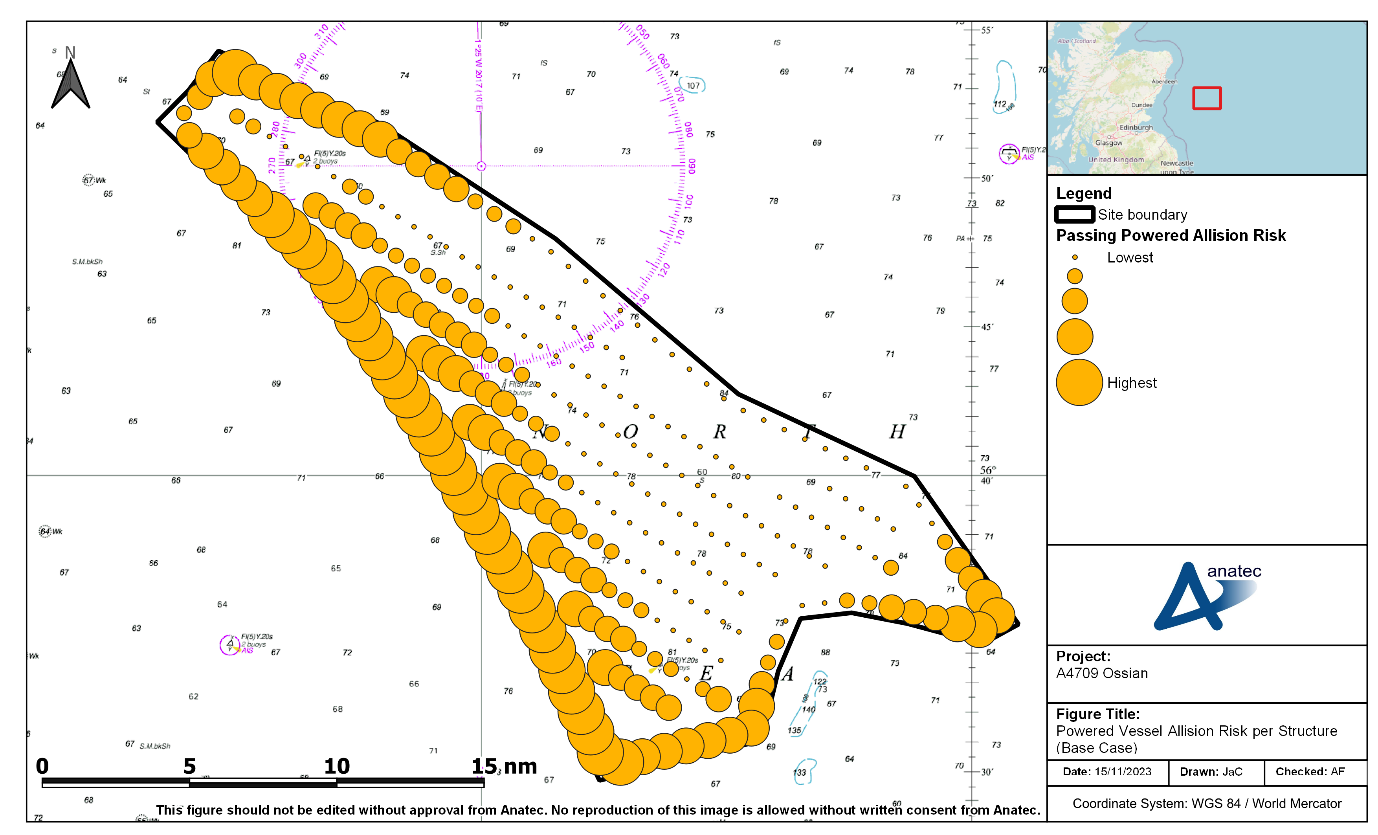
Figure 15.5: Powered Vessel Allision Risk per Structure (Base Case)
- Assuming base case vessel traffic levels, the annual powered vessel allision frequency was estimated to be 6.91×10⁻³, corresponding to a return period of one in 145 years.
- The greatest powered vessel to structure allision risk was associated with structures on the western periphery (where multiple deviated routes pass at a minimum mean distance of 1 nm from the site boundary, as seen in section 13.4.2); the 30 highest risk values were all associated with the western periphery. The greatest individual allision risk was 2.86×10⁻⁴, corresponding to one allision in 3,493 years; this illustrates that the overall allision risk is largely spread over a large number of peripheral structures.
15.4.4 Drifting Vessel to Structure Allision
- Using the post wind farm routeing as input, together with the worst-case indicative array layout and local meteorological ocean data, Anatec’s COLLRISK model was run to estimate the likelihood of a commercial vessel alliding with one of the wind farm structures within the Array. The model is based on the premise that propulsion on a vessel must fail before drifting will occur. The model takes account of the type and size of the vessel, the number of engines and the average time required to repair but does not consider navigational errors caused by human actions.
- The exposure times for a drifting scenario are based upon the vessel hours spent within 10 nm of the site boundary. These have been estimated based on the vessel traffic levels, speeds and revised routeing patterns. The exposure is divided by vessel type and size to ensure that these specific factors (which, based upon analysis of historical incident data, have been shown to influence incident rates) are taken into account for the modelling.
- Using this information, the overall rate of mechanical failure in proximity to the site boundary was estimated. The probability of a vessel drifting towards a wind farm structure and the drift speed are dependent on the prevailing wind, wave, and tidal conditions at the time of the incident. Therefore, three drift scenarios were modelled, each using the meteorological ocean data provided in section 8:
- wind;
- peak spring flood tide; and
- peak spring ebb tide.
- The probability of vessel recovery from drift is estimated based upon the speed of the drift and hence the time available before arriving at a wind farm structure. Vessels which do not recover within this time are assumed to allide. Conservatively, no account is made for another vessel (including a project vessel) rendering assistance.
- After modelling the three drifting scenarios, it was established that the flood tide dominated scenario produced the worst-case results. A plot of the annual drifting vessel allision frequency per structure for the base case is presented in Figure 15.6.
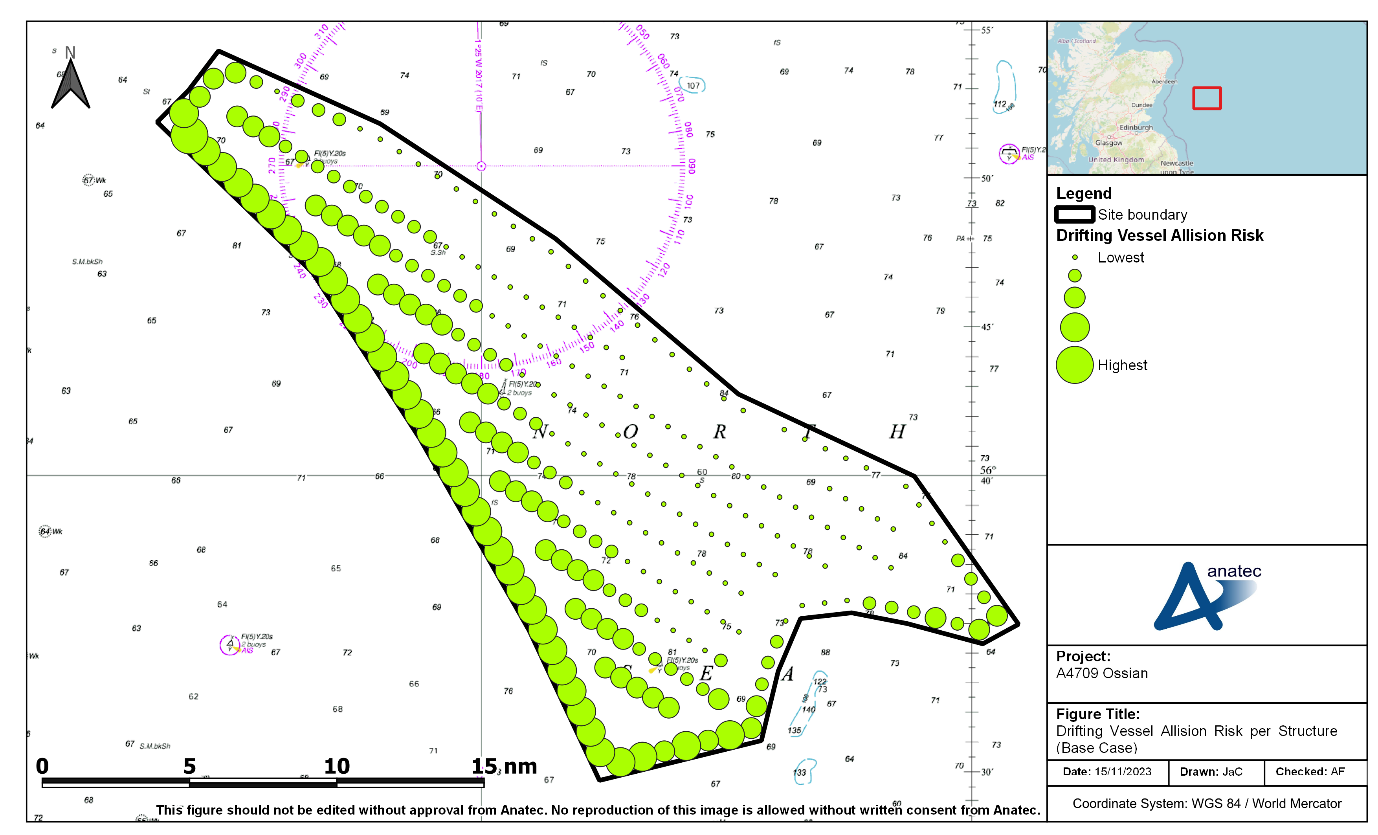
Figure 15.6: Drifting Vessel Allision Risk per Structure (Base Case)
- Assuming base case vessel traffic levels, the annual drifting allision frequency was estimated to be 2.16×10⁻⁴, corresponding to one allision in 4,619 years.
- Similar to the powered vessel allision risk results (as seen in section 15.4.3), the greatest drifting vessel to structure allision risks were associated with structures on the western periphery (where multiple deviated routes pass at a minimum mean distance of 1 nm from the site boundary, as seen in section 13.4.2). The greatest individual allision risk was associated with the northernmost structure on the western periphery, which had an allision risk of 1.33×10⁻⁵, corresponding to one allision in 74,999 years; this illustrates that the overall allision risk is largely spread over a large number of peripheral structures.
- Whilst drifting vessels do occur every year in UK waters, in most cases the vessel has been recovered prior to any allision incident occurring (such as by anchoring, restarting engines, or being taken in tow); see Table 9.1.