13 Future Case Vessel Traffic
- The characterisation of vessel traffic established in the baseline is used as an input to the risk assessment (see section 14). However, it is also necessary to consider potential future case vessel traffic, in terms of general volume and size changes, port developments which may influence movements, and changes to movements associated with the presence of the Array (the ‘post wind farm’ scenario).
- The following subsections provide details of high-level future case scenarios which have been used to inform the risk assessment.
13.1 Increases in Commercial Vessel Activity
- There is uncertainty associated with long-term predictions of vessel traffic growth, including the potential for any other new developments in UK or transboundary ports and the long-term impacts of Brexit on shipping.
- Therefore, two independent scenarios of potential growth in commercial vessel movements of 10% and 20% have been estimated throughout the lifetime of the Array. These are standard values for similar assessments, and were presented to attendees at the Hazard Workshop.
13.2 Increases in Commercial Fishing Vessel and Recreational Vessel Activity
- There is similar uncertainty associated with long-term predictions for commercial fishing vessel and recreational vessel transits given the limited reliable information on future trends upon which any firm assumption could be made. There are no known major developments which would increase commercial fishing or recreational vessel activity in the local region, i.e. in the vicinity of the shipping and navigation study area.
- Therefore, a conservative potential growth in commercial fishing vessel and recreational vessel movements of 10% and 20% has been estimated throughout the lifetime of the Array. These are standard values for other similar assessments and were presented to attendees at the Hazard Workshop.
13.3 Increase in Traffic Associated with Array Activities
- During the construction phase, up to 7,902 return trips will be made by vessels involved in the installation of the Array (see section 6.5.1) including site preparation. During the operation and maintenance phase, up to 508 return trips per year will be made by vessels involved in the operation and maintenance of the Array (see section 6.5.2).
13.4 Commercial Traffic Routeing (Array in Isolation)
13.4.1 Methodology
- It is not possible to consider all potential alternative routeing options for commercial traffic and therefore worst-case alternatives have been considered where possible in consultation with operators. Assumptions for re-routeing include:
- all alternative routes maintain a minimum mean distance of 1 nm from offshore installations and existing offshore wind farm boundaries in line with industry experience. This distance is considered for shipping and navigation from a safety perspective as explained below; and
- all mean routes take into account sandbanks, aids to navigation and known routeing preferences.
- Additionally, some routes which pass at a mean distance greater than 1 nm are sufficiently wide that there may be some interaction with the offshore wind farm boundaries (within the 90th percentile range). In such instances, the width of the route has been reduced. This is a conservative approach as a narrower route leads to greater collision risk.
- Annex 2 of MGN 654 defines a methodology for assessing passing distance from offshore wind farm boundaries (the Shipping Route Template) but states that it is “not a prescriptive tool but needs intelligent application” (MCA, 2021).
- To date, internal and external studies undertaken by Anatec on behalf of the UK Government and individual clients (Anatec, 2016) show that vessels do pass consistently and safely within 1 nm of established offshore wind farms (including between distinct developments) and these distances vary depending upon the sea room available as well as the prevailing conditions. This evidence also demonstrates that the mariner defines their own safe passing distance based upon the conditions and nature of the traffic at the time, but they are shown to frequently pass 1 nm off established developments.
- Evidence also demonstrates that commercial vessels do not transit through offshore wind farm arrays. It is noted that during consultation (see section 4), Regular Operators stated that they may consider passing through the Array; however, it was also stated that this would depend on factors including the spacing between structures, the depths and positions of structures, weather conditions, currents and traffic density. On this basis, it has still been assumed for the purposes of the NRA modelling that all commercial vessels on the main routes identified will deviate.
- The NRA also aims to establish the MDS based on navigational safety parameters, and when considering this the most conservative realistic scenario for vessel routeing is considered to be when main commercial routes pass 1 nm off developments. Evidence collected during numerous assessments at an industry level (e.g. Anatec, 2016) confirms that it is a safe and reasonable distance for vessels to pass; however, it is likely that a large number of vessels would instead choose to pass at a greater distance depending upon their own passage plan and the current conditions.
13.4.2 Main Commercial Route Deviations
- An illustration of the anticipated worst-case shift in the mean positions of the main commercial routes within the shipping and navigation study area following the development of the Array is presented in Figure 13.1. These deviations are based on Anatec’s assessment of the MDS including the indicative array layout presented in section 6.2.1.
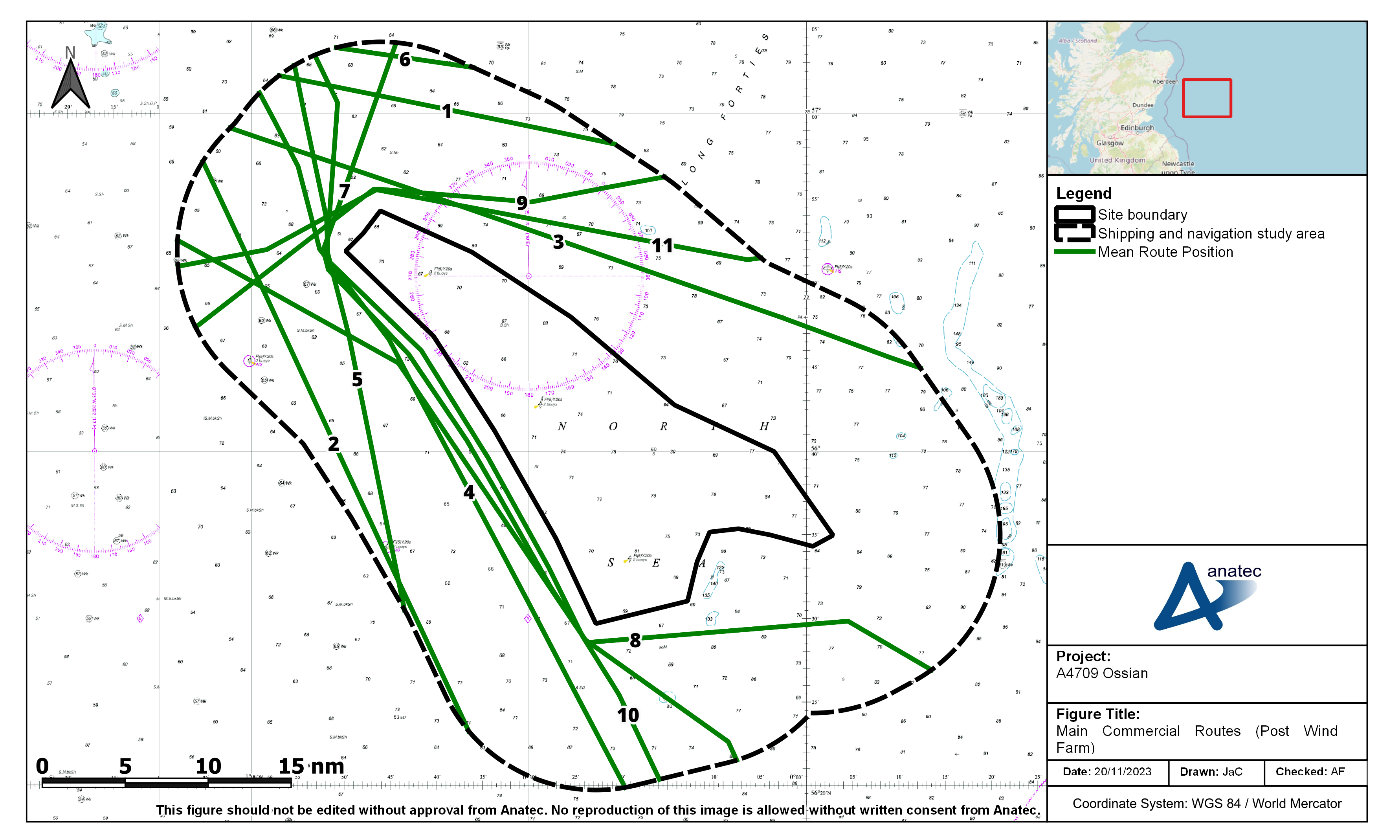
Figure 13.1: Anticipated Deviations of Main Commercial Routes (Post Wind Farm)
- Deviations from the pre wind farm scenario (current baseline) would be required for seven out of the 11 main commercial routes identified, with the level of deviation varying between an increase of 5.7 nm for Route 7 and an increase of less than 0.1 nm for Route 5. For the displaced routes, the increase in distance from the pre wind farm scenario (current baseline) is presented in Table 13.1.
Table 13.1: Summary of Main Commercial Route Deviations Post Wind Farm
Route Number | Average Vessels per Week | Change in Route Length (nm) |
|---|---|---|
4 | 6 | 0.2 |
5 | 2 – 3 | < 0.1 |
7 | 1 – 2 | 5.7 |
8 | 1 – 2 | 4.9 |
9 | 1 – 2 | 0.7 |
10 | 1 | 1.8 |
11 | < 1 | 3.0 |